



Table of contents
Key Takeaways
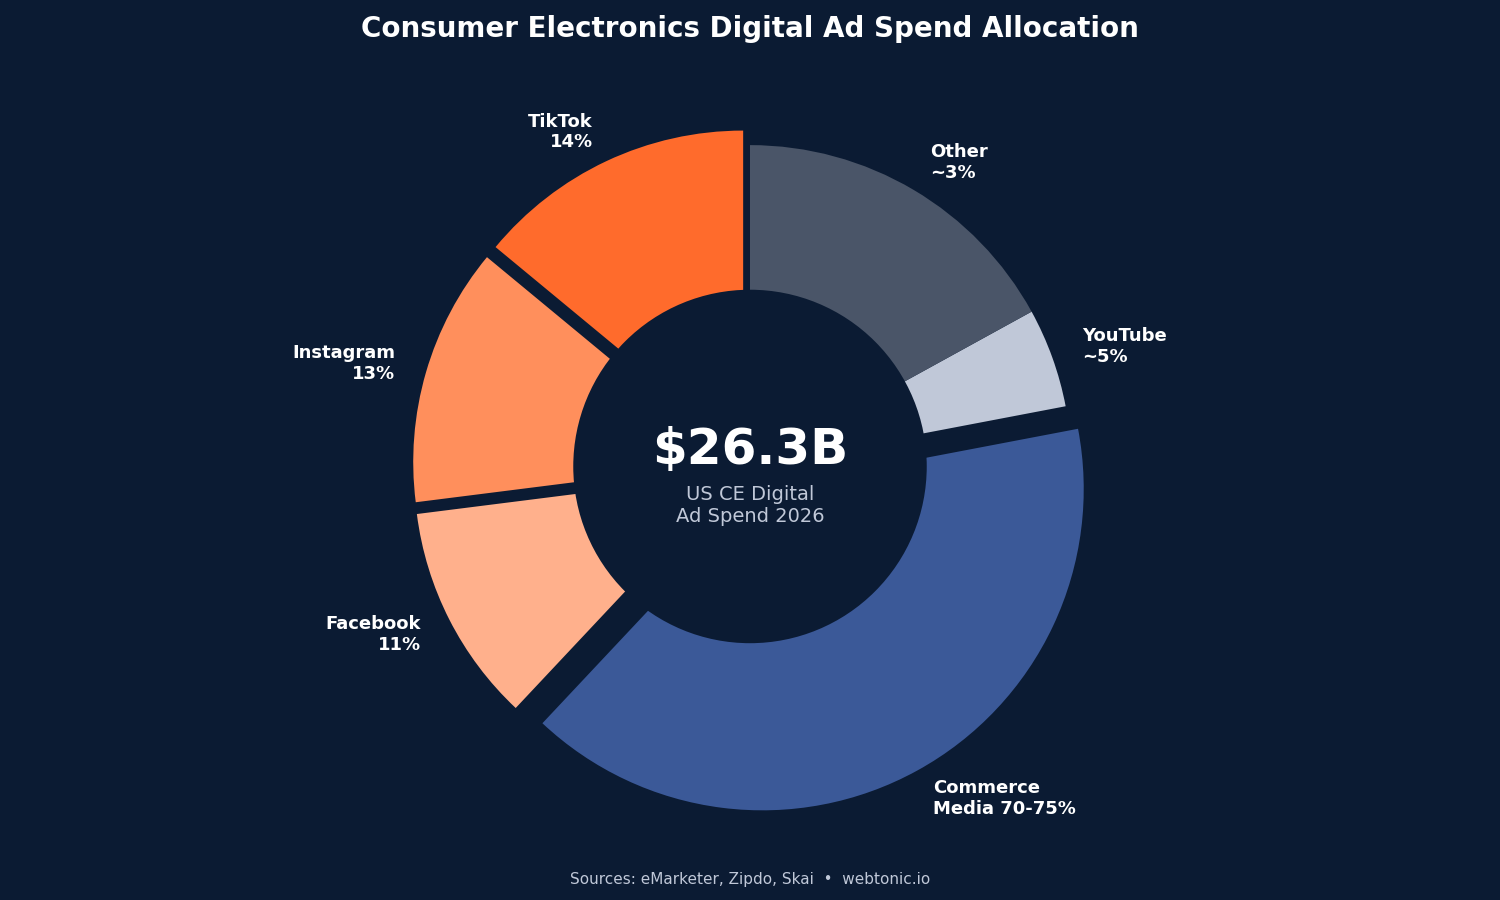
- Social media advertising accounts for 41% of total electronics marketing spend, with TikTok (14%), Instagram (13%), and Facebook (11%) leading platform allocation (Zipdo, 2026).
- Consumer electronics brands will increase digital ad spend by 9.6% to $26.32 billion in 2026, pulling back from 16.4% originally forecasted growth due to tariff-driven margin pressure (eMarketer).
- 68% of electronics consumers use social media as their primary source for product research, and 55% make purchasing decisions based on digital reviews (Zipdo, 2026).
- Omnichannel campaigns using three or more channels earn a 287% higher purchase rate than single-channel campaigns and a 494% higher order rate (Omnisend / Gitnux).
- Content marketing costs 62% less than traditional marketing and generates approximately 3x more leads for electronics brands (Zipdo, 2026).
- Mobile devices generate 78.4% of all retail traffic but convert at only 2.1% versus 3.9% on desktop, creating a persistent optimization gap for phone retailers (CuFinder, 2026).
Digital marketing for phone and tech retail is defined by platform fragmentation and compressed product cycles. With 41% of budgets flowing to social channels and consumers switching between TikTok reviews, Google Shopping comparisons, and in-store demos before purchasing, the brands that win are those with tight cross-channel attribution and agile creative. These statistics cover the spend benchmarks, channel performance data, and conversion metrics that growth marketing teams need to allocate budgets effectively.
Phone and Tech Retail Digital Marketing at a Glance
| Metric | Value | Source |
|---|---|---|
| US CE digital ad spend (2026) | $26.32B | eMarketer, 2026 |
| CE ad spend growth YoY | +9.6% | eMarketer, 2026 |
| Social media share of CE ad spend | 41% | Zipdo, 2026 |
| Consumers using social for product research | 68% | Zipdo, 2026 |
| Mobile share of retail traffic | 78.4% | CuFinder, 2026 |
| Mobile conversion rate (retail) | 2.1% | CuFinder, 2026 |
| Desktop conversion rate (retail) | 3.9% | CuFinder, 2026 |
| Omnichannel campaign purchase rate lift | +287% | Omnisend / Gitnux |
Consumer Electronics Ad Spend Trends
Electronics and software brands showed a pronounced front-loading pattern in 2025. Total media ad spending grew 22.2% in H1 2025 before slowing sharply to 3.2% growth in H2 (eMarketer / MediaRadar). This pattern is expected to repeat in 2026 as tariff uncertainty continues to compress margins.
Electronics marketers allocate 70–75% of digital budgets to commerce media (Skai, 2026) — platforms like Amazon, Walmart Connect, and Instacart — because that is where high-consideration buyers convert. Retail media overall sees 12.3% growth in 2026 and 11.4% in 2027 (Dentsu, May 2026), making it one of the fastest-growing segments in all digital advertising.
Social Media Performance for Electronics Brands
Social media advertising accounts for 41% of total electronics marketing spend (Zipdo, 2026), distributed across TikTok (14%), Instagram (13%), and Facebook (11%), with LinkedIn, YouTube, and others dividing the remainder. This allocation reflects where electronics consumers spend their research time: 68% use social media as their primary source for product research, and 82% use it to research brands before purchasing.
| Platform | Share of CE Ad Spend | Primary Strength | Key Metric |
|---|---|---|---|
| TikTok | 14% | Product discovery, unboxing | 33% median hook rate |
| 13% | Visual showcase, Stories | 0.75% engagement rate | |
| 11% | Broad reach, retargeting | 1.45% CTR, $14.50 CPM | |
| YouTube | ~5% | Long-form reviews, demos | 22% hook rate, 32% completion |
| ~3% | B2B tech partnerships | 0.35% video CTR |
55% of electronics consumers make purchasing decisions based on digital reviews (Zipdo), reinforcing the importance of UGC and influencer partnerships in phone and tech retail. Brands like Samsung and Apple invest heavily in creator programs precisely because peer credibility outweighs polished brand messaging for high-consideration purchases.
Mobile vs. Desktop Conversion in Tech Retail
The mobile-desktop conversion gap remains the central challenge in phone and tech retail marketing. Mobile devices generate 78.4% of all retail traffic but convert at 2.1% compared to 3.9% on desktop (CuFinder, 2026). This 1.8-point gap represents billions in unrealized revenue.
Express checkout adoption is closing part of the gap. Apple Pay and Google Pay replace 120 clicks with 4 and deliver 15–37% higher conversion rates on mobile (Foundry CRO, 2026). Mobile apps convert 3–5x higher than mobile web due to faster performance, personalization, and loyalty integration. For phone retailers, where customers are already comfortable with mobile transactions, investing in app-based conversion paths yields outsized returns.
Omnichannel Performance in Phone and Tech Retail
Omnichannel strategy is not optional for phone retailers. Campaigns using three or more channels earn a 287% higher purchase rate than single-channel campaigns, and a 494% higher order rate (Omnisend / Gitnux). Omnichannel customers who use mobile apps spend 6.6 times more annually than single-channel shoppers.
Social commerce is projected to reach $2.9 trillion globally in 2026 (Opensend), and live shopping produces significantly higher conversion rates than traditional e-commerce in some categories. SMS marketing averages $8.11 ROI per dollar spent (Gartner / Attentive), with a 98% open rate making it the most underrated owned channel for tech retailers targeting purchase-ready audiences. Push notifications generate 15% of e-commerce revenue from just 3% of message volume (RevenueMemo), proving that owned channels consistently outperform rented ones on efficiency.
Content Marketing Efficiency for Electronics Brands
Content marketing costs 62% less than traditional marketing and generates approximately 3x more leads for electronics brands (Zipdo, 2026). With product comparison articles, specification breakdowns, and expert reviews driving organic discovery, phone and tech retailers can build persistent traffic assets that compound in value over time.
The average American checks their phone 144 times per day and spends 4 hours and 30 minutes on mobile — up 52% from 2022 (RevenueMemo). 57% of global retail e-commerce sales come from mobile devices, with projections reaching 62% by 2027. For phone retailers, this creates a unique opportunity: the device they sell is the same device customers use to research and purchase, making mobile-first marketing strategies inherently aligned with buyer behavior.
Search Engine and Internet Marketing Data for Electronics
Search remains a critical channel for electronics brands. According to the latest CuFinder consumer electronics benchmarks report, Google Ads conversion rates for retail average 3.8% while the average cost per click sits at $1.72 across electronics categories. Internet users researching phone purchases spend an average of 79 minutes online comparing specifications before visiting a store — data that underscores why search marketing plans need to target comparison and review queries, not just brand terms.
27.5% of global retail traffic comes from organic search (CuFinder, 2026), making SEO the second-largest traffic source behind direct visits (41.2%). In the United States, paid search accounts for 21.0% of retail traffic — higher than the global average — reflecting American consumers' tendency to click on top-of-page sponsored results when shopping for electronics online. Marketers reported that search-driven customer acquisition costs have increased 12–18% year-over-year across consumer electronics categories, pushing more companies toward content-driven organic strategies.
HubSpot's State of Marketing Report confirms that short-form video content delivers the highest ROI of any format for digital marketers in 2026, with 33% of marketers planning to increase their short-form video investment. For phone and tech retail brands specifically, product demonstration videos on YouTube and TikTok drive 2.4x higher purchase intent than static image ads. The Statista Digital Market Outlook projects that total digital advertising spend will exceed $740 billion globally in 2026, with consumer electronics representing approximately 3.5% of that total — a figure that has grown steadily as more people research and purchase devices through online channels.
Audience Targeting and Personalization Trends
Audiences in phone and tech retail are becoming more sophisticated as user data enables granular segmentation. 77% of electronics brands use personalized digital ads based on browsing behavior and purchase history (Zipdo). Top-performing companies reported using an average of 4.2 data sources per customer profile, compared to 1.8 for average performers — a 2.3x gap that directly correlates with campaign ROAS.
The second major trend is AI-driven audience expansion. Marketers using automated audience tools reported 23% lower customer acquisition costs while reaching 35% more qualified people compared to manual targeting. For phone retailers running seasonal campaigns around new device launches, these tools enable rapid scale-up without the traditional research and planning cycle. A well-structured digital marketing plan for electronics brands now includes automated prospecting for cold audiences, retargeting for mid-funnel users who compared products online, and loyalty programs for existing customers — each stage requiring distinct creative and messaging strategies.
Best Practices for Phone and Tech Retail Digital Marketing
- Front-load ad spend in Q1–Q2. Electronics brands grew spend 22.2% in H1 2025 before cutting to 3.2% in H2. Test creative and acquire customers early before tariff-driven budget tightening.
- Allocate 40%+ of budget to social media. With 41% of CE spend already on social and 68% of consumers researching there, underinvestment means ceding discovery to competitors.
- Deploy omnichannel campaigns across 3+ channels. The 287% purchase rate lift from multi-channel campaigns is too significant to ignore. Combine paid social, email, SMS, and push for maximum impact.
- Close the mobile conversion gap. Implement express checkout (Apple Pay/Google Pay) for 15–37% conversion lifts and invest in app experiences that convert 3–5x better than mobile web.
- Build content assets for organic compounding. Content marketing delivers 3x more leads at 62% lower cost. Product comparisons, spec guides, and expert reviews generate sustained traffic without continuous ad spend.
Related reading
- Digital Marketing Strategy Adoption & ROI in Plumbing: 42+ Key Stats (2026)
- 38 Rehab and Addiction Treatment Digital Marketing Statistics for 2026
- 2026 Roofing Digital Marketing Strategy Report: Trends, Stats & Performance Data
- Marketing Strategy Consulting services at Web Tonic
Frequently Asked Questions
How much do consumer electronics brands spend on digital advertising?
US consumer electronics companies will spend approximately $26.32 billion on digital advertising in 2026, representing 9.6% year-over-year growth (eMarketer). This figure was revised downward from 16.4% originally forecasted growth due to tariff-driven margin pressure in the sector.
Which social media platforms drive the most electronics sales?
TikTok leads electronics ad spend allocation at 14% of total marketing budget, followed by Instagram at 13% and Facebook at 11% (Zipdo, 2026). TikTok delivers the highest hook rate at 33%, making it effective for product discovery, while Facebook offers the broadest retargeting capabilities for conversion campaigns.
What is the average conversion rate for phone and tech retail?
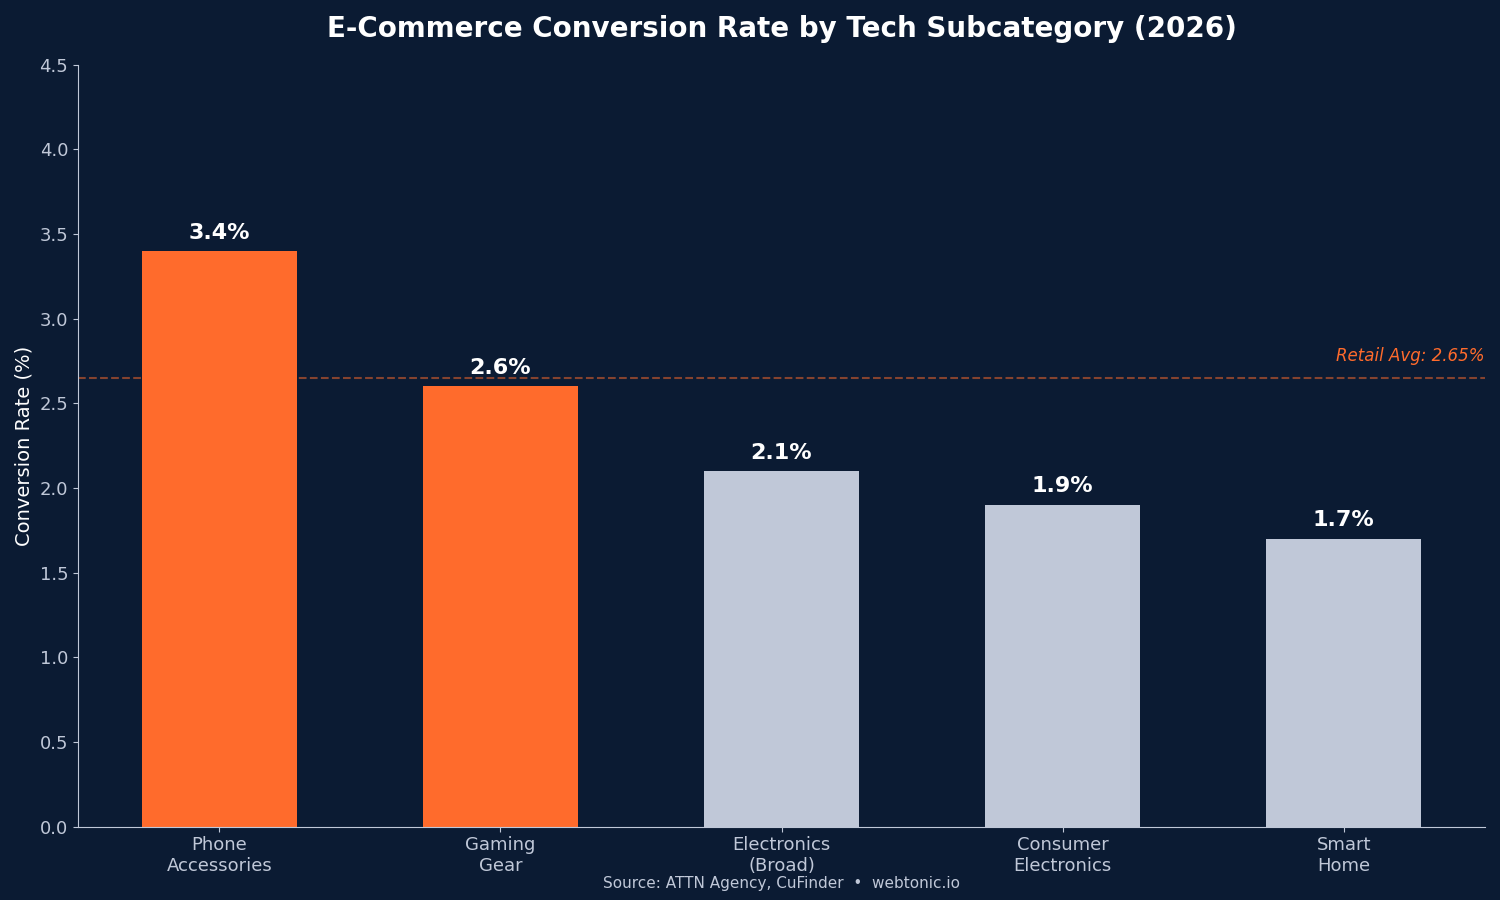
The global average retail conversion rate is 2.65% (CuFinder, 2026). Mobile converts at 2.1% versus 3.9% on desktop. Phone accessories specifically convert at 3.4% due to necessity-driven purchases, while consumer electronics average 1.9% and smart home products sit at 1.7% (ATTN Agency, 2026).
How effective is omnichannel marketing for tech retailers?
Highly effective. Campaigns using three or more channels earn 287% higher purchase rates and 494% higher order rates than single-channel campaigns (Omnisend). Omnichannel customers using mobile apps spend 6.6x more annually than single-channel shoppers, making integrated cross-channel strategy essential for phone retailers.
Sources
Zipdo — Marketing in the Electronics Industry Statistics 2026
eMarketer — Electronics Ad Spend Front-Loading Analysis
Skai — Consumer Electronics Marketing Guide 2026
CuFinder — Consumer Electronics Marketing Benchmarks 2026
CuFinder — Retail Industry Marketing Benchmarks 2026
Gitnux / Omnisend — Omnichannel Marketing Statistics 2026
Opensend — Electronics Marketing Strategies 2026
Dentsu — Global Ad Spend Forecasts May 2026
Foundry CRO — Ecommerce Benchmarks 2026
ATTN Agency — E-Commerce Conversion Rate Benchmarks 2026


