Table of contents
Pest control operators doubled their planned software investment in 2026, from 20% to 44%. Most of that spend will land on dashboards that report numbers nobody acts on, unless the metric set is chosen deliberately.
Key Takeaways
- Planned software investment rose from 20% of operators in 2025 to 44% in 2026.
- The survey behind that figure polled 1,027 pest control and lawn care businesses.
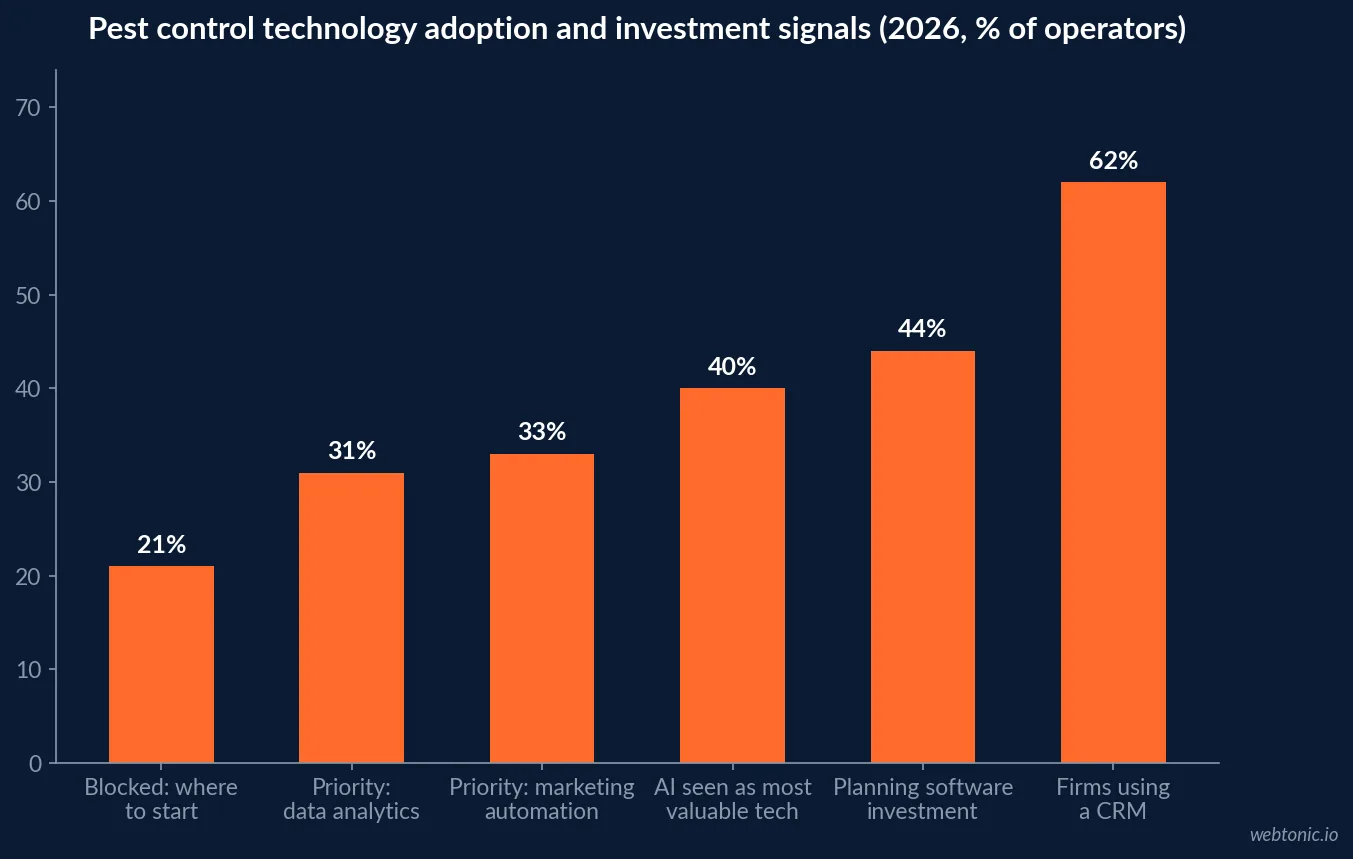
- 40% of operators name AI the technology with the greatest expected value.
- Marketing automation follows at 33% and data analytics at 31%.
- Barriers to adoption: cost 42%, implementation time 23%, not knowing where to start 21%.
- 53% of operators expect conditions to improve and 62% expect revenue growth.
- 68% cite material costs as the top risk; 51% cite customer retention.
- 87% of marketers call data-driven marketing critical but only 32% trust their data.
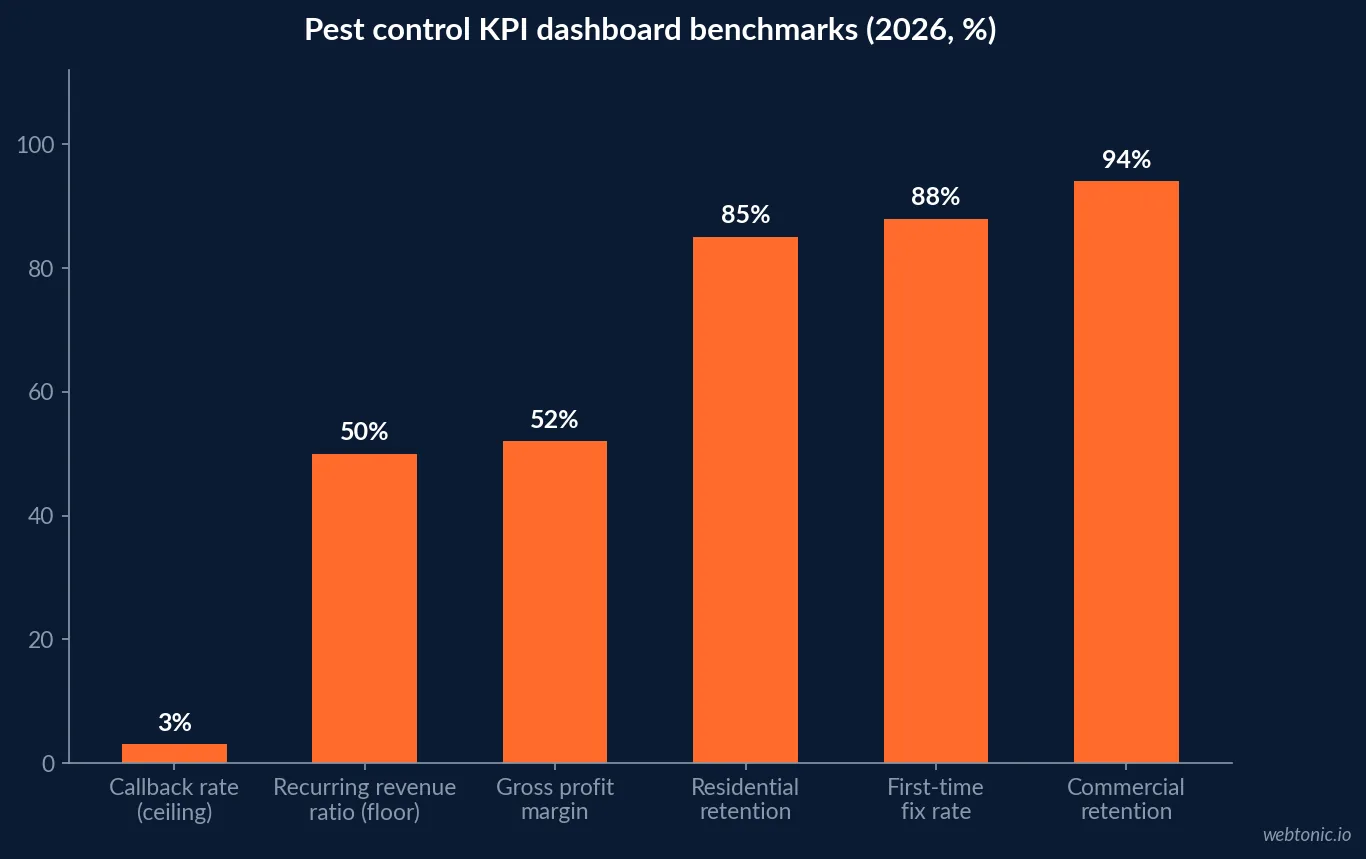
- Gross profit margin benchmark is 50–55%.
- Recurring revenue ratio should exceed 50% of total revenue.
- Revenue per technician benchmarks near $136,250 a year.
- Callback rate should stay under 3%; above 6% is alarming.
- First-time fix rate should exceed 88%.
- Residential retention benchmarks 82–87%; commercial exceeds 94%.
- Customer acquisition cost benchmarks $200–$400 with a 3:1 value-to-cost ratio.
- Lead source auto-tagging lifts attribution accuracy from 40–50% to over 90%.
- 71% of firms report using route optimisation software; 62% use a CRM.
- Route optimisation cases show 80–100% productivity gains.
- Proactive churn work moved retention from 75% to 83% in one documented plan.
- Marketing reallocation lifted new customer acquisition 40% on the same budget.
The Industry Is Buying Software Faster Than It Is Buying Clarity
The spending signal is unambiguous. Planned investment in software more than doubled year over year, from 20% of operators in 2025 to 44% in 2026, with 53% expecting market conditions to improve and 62% expecting revenue growth, across a survey of 1,027 pest control and lawn care businesses.
| Operator signal | 2026 figure | Reporting implication |
|---|---|---|
| Planned software investment | 44% (from 20%) | Dashboards are being bought this year |
| Expect conditions to improve | 53% | Growth plans need measurable pacing |
| Expect revenue growth | 62% | Forecast lines belong on the dashboard |
| Top expected value from AI | 40% | Ahead of automation and analytics |
| Marketing automation priority | 33% | Follow-up sequences need reporting |
| Data analytics priority | 31% | Lowest of the three, highest leverage |
| Blocked by cost | 42% | Start with the tools already owned |
| Blocked by not knowing where to start | 21% | Metric selection is the real barrier |
The risk register explains the urgency: 68% of operators name material costs as their biggest challenge, and 51% name customer retention, alongside material availability at 51% and profitable margins at 49%. Those are margin and churn problems, which means the dashboard that matters is not a traffic report.
The Trust Gap Is the Real Problem
More reporting does not produce more confidence. Marketing analytics research finds only about 32% of marketers measure spend holistically across channels, and a majority say they lack the time to analyse the data they already collect. Cross-industry surveys put the same tension plainly: 87% call data-driven marketing critical while only 32% trust their own data.
In pest control the root cause is upstream of the dashboard. Lead source tracking is described as the single most critical and most overlooked data point in the trade, and auto-tagging through call tracking plus required CRM fields can push attribution accuracy from 40–50% to over 90%. Building charts on a field a customer service representative fills in from memory produces confident, wrong pictures.
| Data quality issue | Figure | Fix before dashboarding |
|---|---|---|
| Attribution accuracy without auto-tagging | 40–50% | Dynamic call tracking numbers |
| Attribution accuracy after auto-tagging | 90%+ | Required, validated CRM source field |
| Marketers measuring spend holistically | ~32% | One spend table, all channels |
| Marketers trusting their data | 32% | Publish definitions with every metric |
| Marketers calling data-driven work critical | 87% | Intent is not the constraint |
| Firms using a CRM | 62% | No CRM means no dashboard |
| Firms using route optimisation software | 71% | Operational data already exists |
The Twelve Numbers Worth a Dashboard Tile
Pest control KPI guidance converges on four pillars — financial health, operational excellence, customer value and marketing performance — with published benchmarks for each. This is the reference table worth pinning above the reporting build.
| KPI | Pillar | Benchmark | Data source |
|---|---|---|---|
| Gross profit margin | Financial | 50–55% | Accounting |
| Recurring revenue ratio | Financial | Above 50% | CRM / accounting |
| Revenue per technician | Financial | ~$136,250 / year | CRM / accounting |
| Callback rate | Operational | Under 3% | Field service software |
| First-time fix rate | Operational | Above 88% | Field service software |
| Billable hours ratio | Operational | Non-billable under 25% | Time tracking |
| Customer retention rate | Customer | 82–87% residential, 94%+ commercial | CRM |
| Net promoter score | Customer | Above 50 strong, 70 excellent | Survey |
| Customer lifetime value | Customer | At least 3x acquisition cost | CRM / accounting |
| Customer acquisition cost | Marketing | $200–$400 | CRM / ad platforms |
| Cost per recurring plan | Marketing | Track against plan value | Call tracking + CRM |
| Answered-call rate | Marketing | Above 90% | Call tracking |
Two of those tiles rarely appear on pest control dashboards and both belong there. Answered-call rate is a marketing metric in a trade where most conversions are voice calls, and cost per recurring plan is the only acquisition number that reflects the subscription economics of the business.
Retention Deserves the Largest Tile
With 51% of operators naming retention a top concern and commercial accounts renewing above 94%, churn reporting is where a dashboard earns its keep. Industry benchmarking puts annual account retention at 82–88%, with top-quartile companies above 85% renewal through proactive communication and bundled termite and mosquito programmes.
| Retention view | Benchmark | Why it belongs on the dashboard |
|---|---|---|
| Annual account retention | 82–88% | Directly sets sustainable acquisition spend |
| Top-quartile renewal | 85%+ | Realistic ceiling, not a stretch goal |
| Commercial retention | 94%+ | Justifies long commercial sales cycles |
| Cancellation rate | Under 5% | Leading indicator, reported monthly |
| Documented churn programme result | 75% to 83% | Shows the metric is movable |
| Retention gain from bundling | Measurable per plan | Segment the tile by plan type |
| Callback rate link to churn | Under 3% target | Service quality predicts cancellations |
The reason retention outranks lead volume is arithmetic. Documented improvement plans in the trade moved retention from 75% to 83% through proactive churn work, and that eight-point swing is worth more than any plausible improvement in cost per lead — the same logic that governs how we structure growth marketing scorecards for recurring-revenue businesses.
Role-Based Views Beat One Big Dashboard
A single dashboard serving an owner, an operations manager and a marketing lead serves none of them. The KPI framework that works splits the same data into role-based views, with technician-facing views creating accountability without micromanagement.
| Role | Primary tiles | Cadence |
|---|---|---|
| Owner | Gross margin, recurring ratio, CAC:LTV, revenue per tech | Monthly |
| Operations manager | Callback rate, first-time fix, stops per day, billable ratio | Weekly |
| Marketing lead | Cost per plan, answered calls, source mix, unknown share | Weekly |
| Customer service | Answered-call rate, booking rate, follow-up speed | Daily |
| Technician | Callbacks, review requests sent, upsell attach rate | Per route |
Documented action plans built on these views report material operational gains: route optimisation driving 80–100% productivity improvement, tiered pricing lifting gross margin to 51%, and marketing reallocation increasing new customer acquisition by 40% on the same budget. The common thread is that each dashboard answered one question a specific person could act on that week.
Cadence Has to Absorb the Season
Pest control demand is not stable enough for month-over-month reporting to mean anything. Spring inquiry volume rises sharply and summer runs well above winter, so a June-versus-May comparison measures the calendar, not the marketing.
| Cadence | What it should cover | Comparison basis |
|---|---|---|
| Daily | Answered calls, unbooked leads | Same weekday last week |
| Weekly | Spend pacing, booked jobs, plan conversions | Trailing four weeks |
| Monthly | Cost per plan by channel, unknown-source share | Same month last year |
| Quarterly | Budget reallocation, retention cohorts | Same quarter last year |
| Annually | CAC:LTV, valuation metrics, tech stack review | Multi-year trend |
One line belongs on every monthly view: the share of leads with an unknown or blank source. If it exceeds 10%, every channel number on the page is provisional. Reporting that share openly is the cheapest way to close the trust gap that leaves only 32% of marketers confident in their own data.
Build Order for a Pest Control Dashboard
Cost is the top adoption barrier at 42%, and not knowing where to start blocks another 21%. Both are solved by sequencing rather than by tooling. The first three steps below use systems most operators already pay for — 71% of firms already report using route optimisation software and 62% already run a CRM.
| Step | Action | Effort |
|---|---|---|
| 1 | Put a tracking number on every campaign and listing | Low |
| 2 | Make the CRM source field required and validated | Low |
| 3 | Add a recurring-plan flag to every lead record | Low |
| 4 | Report cost per plan beside cost per lead | Medium |
| 5 | Pull retention and callback rate from field service software | Medium |
| 6 | Split into role-based views with defined owners | Medium |
| 7 | Automate refresh and archive weekly snapshots | Higher |
Steps one to three cost a few hundred dollars a month and fix the input data that makes every later step credible. Steps four to seven are where reporting starts changing budget decisions rather than describing them. Skipping straight to step seven produces an automated, beautifully refreshed view of numbers that are 40–50% wrong.
The other reason to sequence it this way is credibility with the owner. A dashboard that opens with cost per plan, retention and answered calls speaks directly to the two risks 68% and 51% of operators named — margins and churn. A dashboard that opens with impressions and sessions speaks to neither, which is how reporting ends up ignored inside a business that just doubled its software budget. The same principle applies to paid channels: a Google Ads report that stops at clicks and never reaches plan conversions cannot tell an operator whether the season paid for itself.
Finally, archive weekly snapshots. Seasonality means the only trustworthy comparison is the same week or month last year, and platforms rewrite historical attribution as conversions arrive late. A stored snapshot is the only version of the number that will still match the decision it justified. Operators who kept snapshots through the 2025 season are the ones able to judge whether the 44% software investment wave actually moved retention.
One last discipline: write the definition of every metric next to it. Half the disagreements in a monthly marketing review are definitional — whether a lead means a call, a form or a booked job. Publishing the formulas beside the tiles removes that argument permanently. If you want a second pair of eyes on the metric set before you build it, get in touch or read how we approach data intelligence for recurring-service businesses.
Frequently Asked Questions
What should a pest control marketing dashboard actually show?
Six things, in this order: answered-call rate, cost per lead by source, plan conversion rate, customer acquisition cost against the $200–$400 benchmark, recurring revenue ratio against the 50%+ benchmark, and retention against 82–87% residential or 94% commercial. Everything else is supporting detail.
How much are pest control operators investing in software in 2026?
Planned software investment more than doubled year over year, from 20% of operators in 2025 to 44% in 2026, in a survey of 1,027 pest control and lawn care businesses. AI was named the technology expected to deliver the most value by 40% of operators, ahead of marketing automation at 33% and data analytics at 31%.
What are the core pest control KPI benchmarks?
Gross profit margin 50–55%, recurring revenue ratio above 50%, revenue per technician around $136,250 a year, callback rate under 3%, first-time fix rate above 88%, residential retention 82–87%, commercial retention above 94%, customer acquisition cost $200–$400, and a lifetime value to acquisition cost ratio of at least 3:1.
Why do marketing dashboards fail in the trades?
Data trust, not data volume. 87% of marketers say data-driven marketing is critical while only 32% trust their data, and lead source tagging in home services is accurate only 40–50% of the time until it is automated. A dashboard built on a broken source field reports errors faster.
How often should pest control marketing reporting run?
Weekly for anything fixable inside a week — answered calls, spend pacing, booked jobs. Monthly for channel and segment performance. Quarterly for reallocation decisions. Because demand swings 40–47% between seasons, quarterly comparisons should be year over year, never month over month.
Sources
PCT — FieldRoutes 2026 Pest Control State of the Trades
Cube Creative — Pest Control KPIs That Drive Profit
BizMetricsHQ — Pest Control Industry Benchmarks
BaaDigi — Pest Control Marketing Benchmarks 2026
WifiTalents — Pest Control Statistics 2026
Konabayev — Marketing Analytics Statistics 2026
Pulse RevOps — Best KPIs for Pest Control Companies