Table of contents
Pest control is a $13.4 billion US industry where 85.4% of residential revenue renews and 87% of younger homeowners refuse to hire below four stars. That combination makes brand a retention line item rather than a design project.
Key Takeaways
- US structural pest control revenue hit $13.416 billion in 2025, up $762 million from $12.654 billion.
- 16,565 firms operate in the US, 81.4% from one or two locations.
- The industry employs an estimated 109,384 service technicians.
- 13.29 million residential customers received a professional pest control service.
- 85.4% of residential service revenue is recurring, up from 85.2%.
- A 5% retention improvement can raise profits 25–95%.
- 87% of Millennial and Gen Z homeowners will not hire a company rated below four stars.
- Businesses rated 4.0 or above appear in local pack results 58% more often.
- Review signals carry an estimated 15% of Google local pack ranking weight.
- 47% of consumers will not engage with a business that has too few recent reviews.
- 89% of consumers expect owners to reply to reviews; 80% are more likely to use a business that does.
- Baby Boomers account for 42% of US home buyers and prefer phone contact.
- 33% of Gen Z and 24% of Millennials name search engines as their primary discovery method.
- 76% of Millennial pest control users keep an ongoing service relationship.
- 56% of homeowners want 24/7 scheduling or after-hours contact options.
- Brand visibility is 3.5x higher for consistently presented brands.
- Consistent brand presentation is associated with up to 23% higher revenue.
- Vehicle wraps deliver roughly $0.48 CPM over a five-to-seven-year lifespan.
- Email marketing returns 3,600–4,500% in pest control — the highest of any channel.
- Pest control CPCs average about $34, so national CPL runs $170–$340.
A Fragmented Industry With Recurring Revenue
The structural facts explain why brand behaves differently here than in one-off trades. US structural pest control generated $13.416 billion in service revenue, a $762 million increase on 2024, across 16,565 firms of which 81.4% operate from one or two locations, based on a survey of 800 owners and managers.
| Industry metric | 2026 figure | Brand implication |
|---|---|---|
| Total US service revenue | $13.416 billion | Large enough for regional brand plays |
| Year-over-year increase | +$762 million | Growth market, not a share fight only |
| Firms operating | 16,565 | Crowded, undifferentiated local field |
| Single or two-location firms | 81.4% | Brand is the cheapest differentiator |
| Service technicians employed | 109,384 | Every tech is a brand touchpoint |
| Residential customers served | 13.29 million | Recall compounds across neighbourhoods |
| Recurring share of residential revenue | 85.4% | Retention beats acquisition economics |
The 85.4% recurring figure is the single most important number in the industry for a marketer. When most revenue renews, brand work has two jobs: win the first appointment and then keep the relationship legible enough that the quarterly invoice never feels like a decision. Classic retention research puts the value of that second job plainly — a 5% improvement in retention can lift profits by 25–95%.
Acquisition costs make the same argument from the other side. Pest control CPCs average about $34 in competitive markets, putting national CPL at $170–$340 depending on conversion rate, with recurring contracts worth $1,500–$2,500 in lifetime value and termite work reaching $3,000–$5,000 over five years. Every point of brand-driven conversion improvement cuts that CPL directly: moving site conversion from 5% to 10% halves cost per lead.
Reputation Is the Brand Asset That Ranks
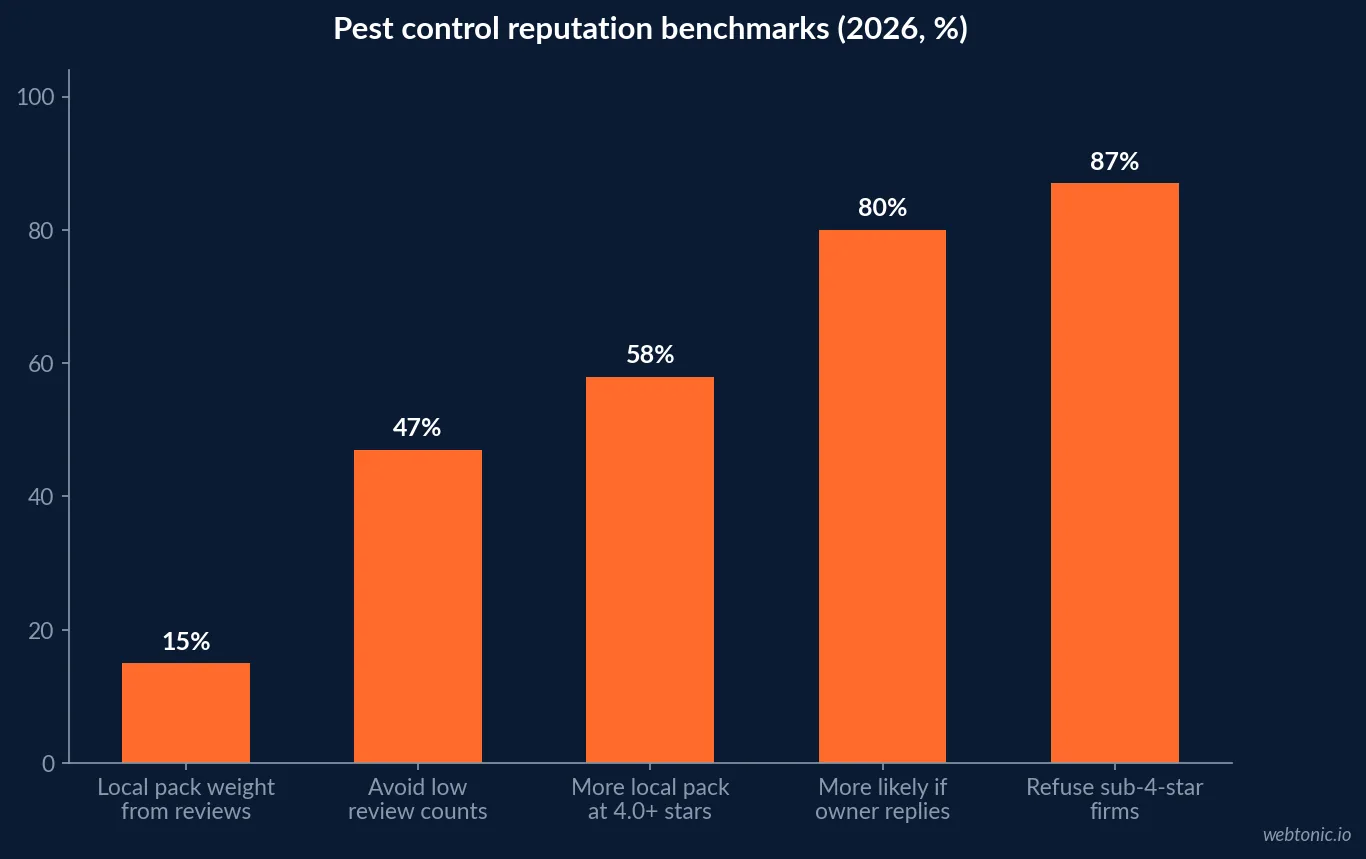
In local services, the brand a homeowner encounters first is a star rating, not a logo. Review signals account for an estimated 15% of the weight Google uses to rank local pack results, and businesses with a 4.0-plus aggregate rating appear in those results 58% more often.
| Reputation metric | Figure | What it governs |
|---|---|---|
| Local pack ranking weight from reviews | ~15% | Visibility in the highest-click surface |
| Lift in local pack appearances at 4.0+ | 58% more often | Rating is a distribution input |
| Younger homeowners refusing sub-4-star firms | 87% | Hard floor on consideration |
| Consumers ignoring low-review-count firms | 47% | Recency and volume both matter |
| Consumers expecting owner replies | 89% | Response discipline is brand voice |
| More likely to use a business that replies | 80% | Cheapest trust signal available |
| Local searches ending without a click | ~65% | The profile is the brand experience |
Two behaviours compound this. Homeowners increasingly cross-check three or more review platforms before calling, so a strong Google profile alongside a stale Facebook page and an empty BBB record reads as inconsistency rather than strength. And with roughly 65% of local searches ending without a click, the profile itself — photos, categories, review replies, hours — is frequently the entire brand experience a prospect ever sees.
The operational fix is unglamorous: reply publicly to every review within 24 to 48 hours, trigger review requests from the field service platform the moment a job closes, and route request volume toward whichever platform currently looks weakest rather than piling more reviews onto the profile that is already strong.
Four Generations, Four Brand Expectations
A pest control customer base spans four decades of buying habits, and the discovery route differs sharply by cohort. Industry generational research reports 33% of Gen Z and 24% of Millennials naming search engines as their leading discovery method, and 76% of Millennial pest control users maintaining ongoing service relationships, one third of them on monthly visits.
| Cohort | Share / behaviour | Primary discovery | Brand requirement |
|---|---|---|---|
| Baby Boomers | 42% of US home buyers | Referral, mailer, truck signage | Answer the phone, same day |
| Gen X | Peak earning homeowners | Search plus referral | Credentials and warranty clarity |
| Millennials | 76% keep ongoing service; 37% almost always hire pros | Search, reviews, online booking | Book at 10:30 PM without calling |
| Gen Z | 33% use search first; 33% attempt DIY first | Search, social, “near me” queries | Fast answers, chat, transparency |
The cross-cutting requirement is availability. 56% of homeowners want 24/7 scheduling or after-hours communication options, and Millennials in particular will not call if the website makes booking hard — they simply tap the next result. That is a brand promise expressed as infrastructure: a booking widget, an answering service, and an SMS auto-reply are branding spend in everything but name.
Meanwhile the Boomer half of the base still runs on human signals — a recognised truck in the neighbourhood, a postcard, a technician who arrives when promised. The mistake is treating these as competing strategies. The postcard drives the recipient to the Google profile; the profile has to hold up, or the mailer subsidised a competitor.
What Brand Consistency Is Worth
Cross-industry branding research gives the consistency argument its numbers. Brand visibility runs 3.5x higher for consistently presented brands, consistent presentation is associated with up to 23% higher revenue, and a consistent colour palette can improve brand recognition by up to 80% — while under 10% of B2B companies describe their own branding as consistent.
| Branding statistic | Figure | Pest control application |
|---|---|---|
| Visibility gain from consistent presentation | 3.5x | Truck, uniform, invoice, profile all match |
| Revenue associated with consistent branding | up to +23% | Cheapest available growth lever |
| Recognition gain from consistent colour | up to +80% | One palette across fleet and web |
| Consumers expecting cross-channel consistency | 90% | Mailer must match the website |
| Consumers recommending brands they connect with | 94% | Referral engine in a referral industry |
| Consumers staying loyal to transparent brands | 94% | Publish pricing and treatment detail |
| Companies claiming consistent branding | <10% | Low bar to clear locally |
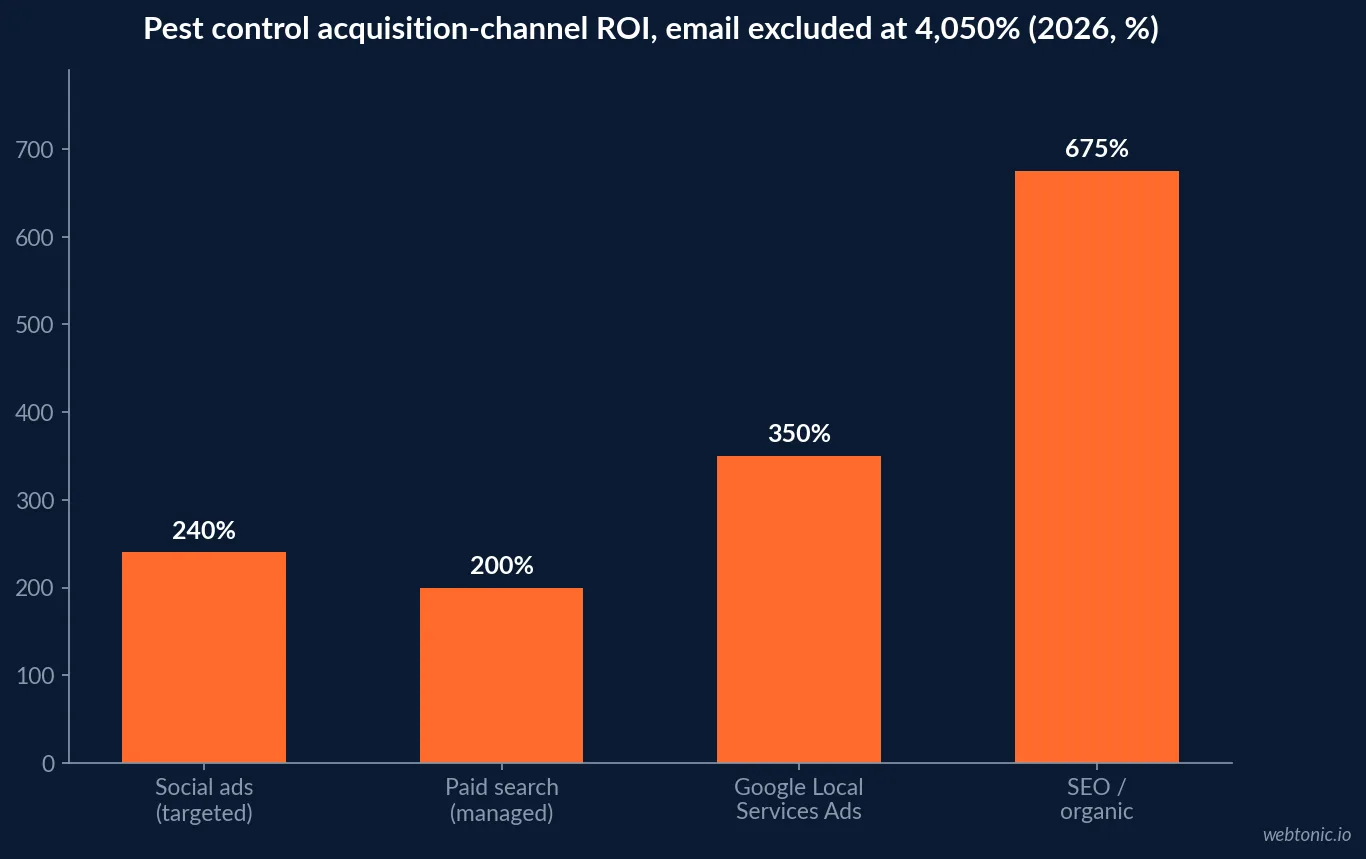
Consistency is also where the cheapest impressions live. A wrapped service vehicle averages roughly $0.48 per thousand impressions across a five-to-seven-year lifespan, and email marketing returns 3,600–4,500% — the highest of any pest control channel — precisely because it addresses people who already recognise the name. Direct mail still achieves 80–90% open rates when targeted to the right neighbourhoods at the right point in the pest season.
Retention Is the Brand Metric That Pays
Because 85.4% of residential revenue renews, the brand question that matters most is not recall among strangers but recognition among existing customers at renewal time. Industry reporting on churn puts average annual customer retention well below where contract economics assume it sits, and retention under 40% a year is flagged as the point where paid acquisition stops being sustainable at any CPL.
| Retention lever | Figure | Why it is brand work |
|---|---|---|
| Recurring share of residential revenue | 85.4% | The asset being protected |
| Profit lift from 5% better retention | +25–95% | Highest-leverage marketing outcome |
| Recurring contract lifetime value | $1,500–$2,500 | Justifies $170–$340 CPL |
| Termite contract five-year value | $3,000–$5,000 | Warranty renewals hinge on trust |
| Millennials keeping ongoing service | 76% | The renewing cohort is digital-first |
| Homeowners wanting 24/7 access | 56% | Convenience is a brand promise |
| Email marketing ROI | 3,600–4,500% | Only works on a base that knows you |
That last row is the clearest proof that brand and retention are the same budget line. Email returns $36–$45 per dollar in pest control not because email is magic but because the recipient already recognises the sender — automated renewal reminders at 30, 14 and 7 days before the service anniversary, seasonal pest-pressure notices timed to regional biology, and service reports that look like they came from the same company as the truck.
Marketing investment benchmarks for the industry sit at 8–12% of gross revenue, typically split 60% paid acquisition, 30% SEO and 10% retention programmes. Given that 85.4% of revenue is recurring, a 10% retention allocation is arguably the most mispriced line in the average pest control budget — and the one where consistent branding, review discipline and proactive communication all land.
Brand Consistency Across Every Touchpoint
With 109,384 technicians in the field, the largest branded surface in this industry is people and vehicles, not advertising. A practical audit list, ordered by how often a prospect or customer encounters each surface:
| Touchpoint | Frequency of exposure | Common failure |
|---|---|---|
| Google Business Profile | Every search, every review check | Stale photos, unanswered reviews |
| Service vehicle wrap | Daily, neighbourhood-level | Mismatched palette, no URL or QR |
| Technician uniform and ID | Every visit | Generic shirts, unbadged arrivals |
| Website and booking flow | Pre-hire and rebooking | No after-hours booking option |
| Invoice and service report | Every recurring cycle | Plain text, no brand, no next step |
| Email and SMS reminders | 30/14/7 days pre-service | Unbranded, generic templates |
| Direct mail and door hangers | Seasonal | Different look from the truck |
The sequencing that follows from the data is simple. Fix the review engine first, because it gates both visibility and consideration. Standardise the visual system second, because it is a one-time cost that lifts recall across 109,384 daily field impressions industry-wide. Then build the availability layer — online booking, after-hours response, SMS confirmations — because that is what the 56% of homeowners wanting 24/7 access are actually judging. Our growth marketing approach sets that order, performance creative produces the assets, data intelligence measures whether recall moves, and our Google Ads strategy guide covers the paid layer that sits on top.
Frequently Asked Questions
How big is the US pest control industry in 2026?
US structural pest control service revenue reached $13.416 billion in the 2025 season, a $762 million increase on the $12.654 billion measured in 2024. There are 16,565 firms operating, 81.4% of them from one or two locations, employing an estimated 109,384 service technicians.
Why does branding matter more in pest control than in other trades?
Because the revenue is recurring. 85.4% of residential pest control service revenue comes from recurring contracts, up from 85.2% the prior year, and a 5% improvement in retention can lift profits 25–95%. A brand a customer recognises and trusts each quarter is a churn defence, not a vanity asset.
How much do reviews and ratings drive pest control hiring?
Heavily. 87% of Millennial and Gen Z homeowners will not hire a company rated below four stars, review signals carry an estimated 15% of local pack ranking weight, and businesses rated 4.0 or higher appear in local pack results 58% more often. 47% of consumers will not engage with a business that has too few recent reviews.
What does brand consistency actually deliver?
Published branding research puts brand visibility 3.5x higher for consistently presented brands, revenue up to 23% higher with consistent presentation, and brand recognition up to 80% stronger with a consistent colour palette. 90% of consumers expect the same branded experience across channels, yet under 10% of B2B companies say their branding is consistent.
Which channels carry the brand most cheaply?
Vehicle wraps and email. A wrapped truck averages $0.48 per thousand impressions over a five-to-seven-year life, and email marketing returns 3,600–4,500% in pest control because it speaks to customers who already know the brand. Direct mail still achieves 80–90% open rates.
Sources
US structural pest control market crosses $13 billion
Pest control cost per lead benchmarks 2026
Pest control review sites that drive real leads
Marketing pest control to all four generations
The real ROI behind every pest control marketing channel
NPMA: the new generation of homeowners
50+ branding statistics for 2026
Extermination and pest control industry market research