



Table of contents

GA4 redefined what counts as a "bounce" in 2023, which means a bounce rate you pull today is not measuring the same thing a Universal Analytics report measured a few years ago. Cross-industry GA4 data now clusters around a 47.4% bounce rate (52.6% engagement rate), but the number that actually separates a good session from a wasted one is pages per session and session duration read together, not bounce rate alone.
Key Takeaways
- GA4's cross-industry median bounce rate is 47.4%, engagement rate 52.6%.
- GA4 defines an engaged session as 10+ seconds, a conversion, or 2+ pageviews.
- Cross-industry median pages per session sits at 3.81 in one 2026 benchmark set.
- B2B SaaS marketing sites can see 5 to 10 minute sessions, far above general content sites.
- Ecommerce averages roughly 3.27 to 4.1 pages per session across cited 2026 studies.
- Organic traffic drives more pages per session than direct, 5.8 versus other channels in one dataset.
- Contentsquare's 2026 benchmark is built from 99 billion sessions across 6,500+ sites.
- Bounce rates improved for AI-influenced traffic, down about 5%, per Contentsquare.
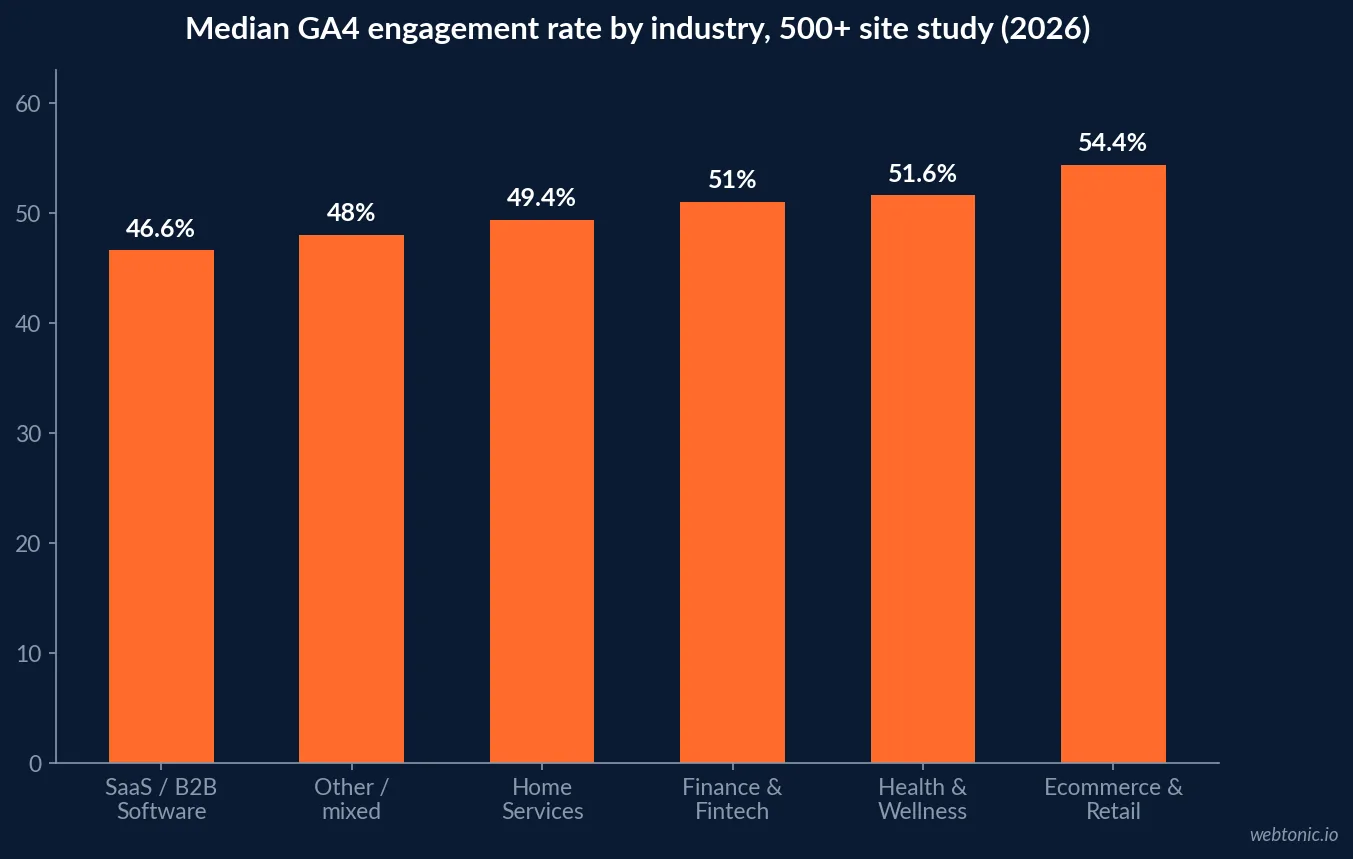
- Ecommerce & Retail leads GA4 engagement at 54.4% in one 500+ site study.
- SaaS/B2B software engagement trails at 46.6% in the same dataset.
- Global mobile share was 52.23% in June 2026, per Statcounter.
- US desktop share was 55.19% in July 2026, the reverse of the global split.
- Real estate sites average 4.47 to 5.36 pages per session in one industry breakdown.
Benchmarks at a glance
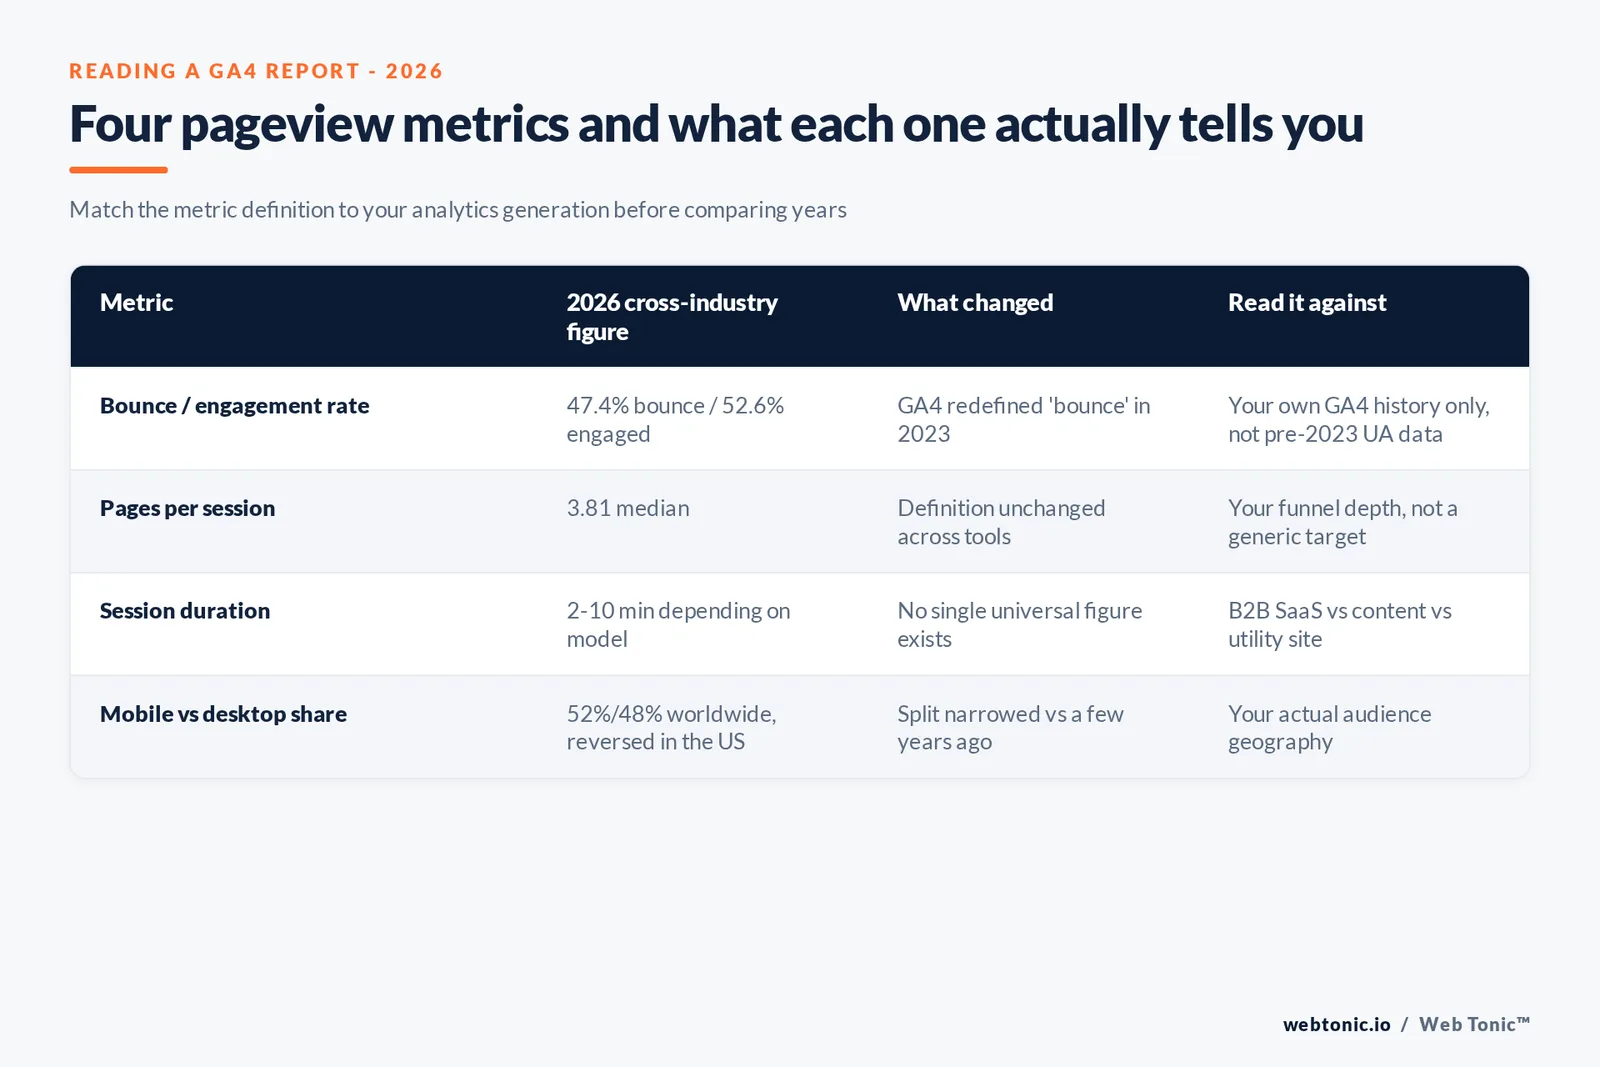
The four numbers worth anchoring on before diving into industry cuts: bounce/engagement rate, pages per session, session duration, and device split. All four come from named 2026 vendor benchmarks, not a single blended "average."
| Metric | Cross-industry figure (2026) | Source |
|---|---|---|
| Bounce rate (GA4) | 47.4% | Cross-industry GA4 estimate, inverse of engagement rate below |
| Engagement rate (GA4) | 52.6% (inverse of bounce) | Directionally matches Semrush's 56.23% median engagement read |
| Pages per session | 3.81 median | Focus Digital, multi-industry study |
| Global mobile traffic share | 52.23% (Jun 2026) | Statcounter Global Stats |
Why "bounce rate" means something different than it used to
This is the methodology point that actually matters for anyone comparing year-over-year traffic reports. Universal Analytics counted any session with a single pageview and no further interaction as a bounce, full stop. GA4 replaced that with an engaged session: a visit lasting 10 seconds or more, firing a conversion event, or reaching two or more pageviews. Semrush's breakdown cites a comprehensive benchmarking study putting the median site-wide engagement rate at 56.23% across industries and content types - a different exact figure from the 52.6% cited elsewhere, which is itself the point: even "median engagement rate" moves by a few points depending on which sites are in the sample.
The practical upshot: a visitor who reads one long article for two minutes and leaves now shows as engaged, not bounced. That is a more honest model of a successful single-page visit, but it also means any bounce-rate trend line spanning the 2023 GA4 migration is comparing two different definitions, not two periods of the same metric.
| Industry (GA4 engagement rate study) | Median engagement rate | Implied bounce rate |
|---|---|---|
| Ecommerce & Retail | 54.4% | 45.6% |
| Health & Wellness | 51.6% | 48.4% |
| Finance & Fintech | 51.0% | 49.0% |
| Home Services | 49.4% | 50.6% |
| Other / mixed content | 48.0% | 52.0% |
| SaaS / B2B Software | 46.6% | 53.4% |
Pages per session: the metric that separates business models
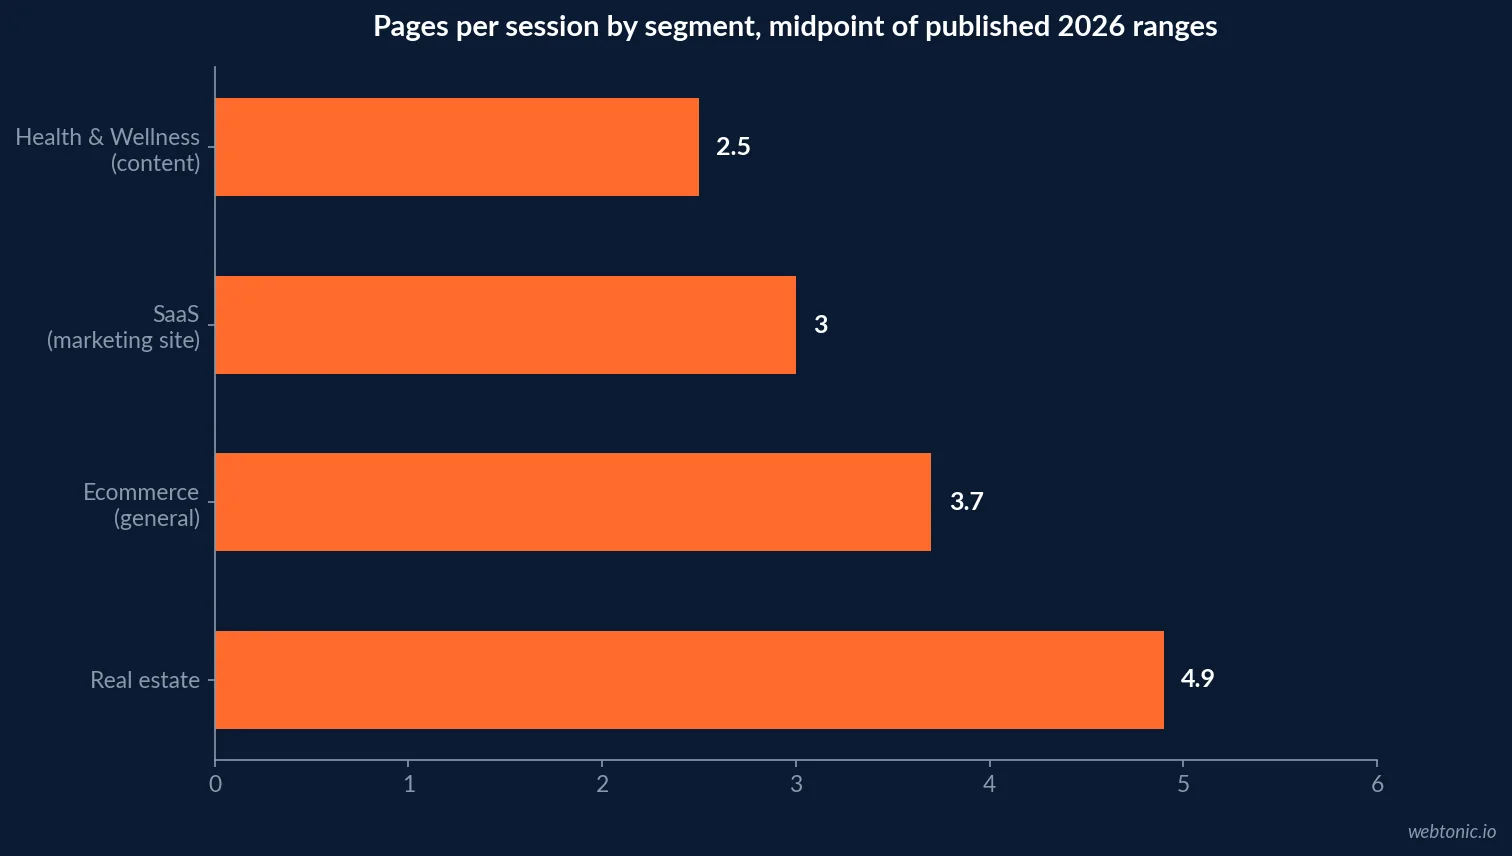
Pages per session (GA4 calls it "views per session") is calculated simply as total pageviews divided by total sessions, and unlike bounce rate its definition has not shifted between analytics generations. A 2026 multi-industry study puts the overall median at 3.81 pages per session, but the range beneath that median is wide: real estate sites averaged 4.47 to 5.36 pages per session in the same dataset, while lighter-intent verticals sat well below the median.
Channel matters as much as industry. One 2026 traffic study found organic search traffic generating 5.8 pages per session on average, ahead of direct and paid channels in the same comparison - a visitor arriving through a specific, relevant search result appears to keep browsing longer once they land than a visitor arriving through a bookmark or an ad click.
| Segment | Pages per session (2026 studies) | Note |
|---|---|---|
| Real estate | 4.47-5.36 | High-consideration browsing, multiple listings |
| Ecommerce (general) | 3.27-4.1 | Range reflects catalog depth and search behavior |
| SaaS (general) | 2.61-3.39 | Marketing site only; product usage is a separate metric |
| Health & Wellness (content) | 2.17-2.82 | Single-answer content, fewer follow-on clicks |
| Cross-industry median | 3.81 | Focus Digital multi-industry benchmark |
| Organic search traffic specifically | 5.8 | Highest of the channels compared in one 2026 study |
Session duration: the number that needs a business-model filter
Average session duration ranges are commonly cited as 2 to 4 minutes for general content sites, but B2B software and services sites regularly run well above that. Multiple 2026 write-ups converge on the same directional finding: B2B SaaS marketing sites often see 5 to 10 minute average sessions, because a buyer is reading pricing pages, security documentation and case studies inside a single visit before deciding whether to book a demo - behavior a consumer content site never sees.
The reverse also holds. A utility or reference site answering one specific question can post session durations in the 30-second range and still be doing exactly its job - the visitor got the answer and left, which under GA4's engaged-session model can still register as engaged if it crossed the 10-second threshold.
| Site type | Typical session duration (2026 estimates) | Why |
|---|---|---|
| Utility / single-answer content | ~30 seconds - 1 minute | One fact, one visit, job done |
| General content / blog | 2-4 minutes | One or two articles read |
| Ecommerce | 2-5 minutes | Browsing depends on catalog size |
| B2B SaaS marketing site | 5-10 minutes | Pricing, security and case study review pre-demo |
The traffic scale behind the 2026 benchmarks
Contentsquare's 2026 Digital Experience Benchmark is built from 99 billion web sessions across more than 6,500 websites in nine industries, comparing Q4 2024 against Q4 2025. It reports bounce rates improving overall, with a roughly 5% reduction attributed to AI-influenced traffic - the theory being that visitors arriving from AI-assisted search or chat referrals already know more precisely what they want before they land, so they move through a site faster and with more intent, registering fewer accidental single-page exits.
That scale is worth naming because it is one of the few benchmark sets built from a first-party session panel rather than a self-reported survey, which is why it is cited alongside vendor-specific GA4 studies rather than in place of them. WebFX's own GA4 event benchmark roundup lands in the same neighborhood for the "all industries" row - a ~62% engagement rate and roughly 2 minutes 38 seconds average session duration - reinforcing that the cross-industry midpoint sits in a fairly narrow band no matter which vendor's panel produced it.
Device split: check the region before you check the label
Statcounter's global tracker put mobile at 52.23% of worldwide traffic against desktop at 47.77% as of June 2026 - a narrower gap than the 60%-plus mobile figures commonly repeated from a few years earlier. The US-specific breakdown flips the picture: Statcounter's United States data for July 2026 shows desktop ahead at 55.19% against mobile at 44.81%, which means a global statistic applied to a US-only property will understate desktop's real share there.
| Region (Statcounter, 2026) | Mobile share | Desktop share |
|---|---|---|
| Worldwide, June 2026 | 52.23% | 47.77% |
| United States, July 2026 | 44.81% | 55.19% |
What a "pageview" even counts as inside GA4
One more definitional gap worth flagging before comparing tools: GA4's page_view
event fires on the initial load of a page and again on most client-side route changes in a
single-page application, which is closer to how modern JavaScript-heavy sites actually behave than
Universal Analytics' page-load-only model. That means a single-page app rebuilt without full page
reloads can show a lower raw pageview count under GA4 even with identical user behavior, simply
because fewer full loads are firing the event - another reason to trend a metric within one
analytics generation rather than splicing GA4 and Universal Analytics data into one chart.
How to benchmark your own pageview data without getting fooled
Match the metric's definition, not just its label, to whatever you last measured: a pre-2023 bounce rate and a current GA4 bounce rate are not the same statistic even if the dashboard widget looks identical. Read pages-per-session against your actual funnel depth - a five-page checkout flow should not be compared to a single-answer blog post. And pull the device split for your actual audience geography before assuming the global 52/48 mobile-desktop split applies to your traffic.
If your GA4 setup needs a second look before you trust any of these comparisons, our data and analytics practice audits tracking configuration first, and our growth marketing team uses these engagement signals to prioritize which pages get rebuilt next. Get in touch if you want that audit run against your own account.
Frequently Asked Questions
What is a good bounce rate in 2026?
It depends entirely on which analytics tool produced the number, because GA4 and Universal Analytics define a bounce differently. Under GA4's engagement-based model, a session only counts as a bounce if it lasts under 10 seconds, has no conversion event and views a single page - so GA4's reported bounce rates run structurally lower than the old Universal Analytics definition. Cross-industry GA4 data puts the median around 47.4% bounce (52.6% engagement), with SaaS and B2B lead-gen sites often engaging higher, near 60-70%, and single-article content or media sites bouncing more, since one satisfying read is a legitimate, successful visit.
How many pages per session is good?
Cross-industry studies cluster around 3 to 5 pages per session as a reasonable middle band, but the spread by business model is wide. One 2026 study covering multiple verticals found real estate and healthcare sites averaging 4.0 to 8.0 pages per session, while health-and-wellness content sites averaged closer to 2.2 to 2.8. A SaaS onboarding flow that drives 4-8 pages per session is doing something very different from a single-article blog post that gets 1.2-2.5 - both can be healthy for what they are trying to accomplish.
Why did GA4 change how bounce rate is calculated?
Google moved from a hit-based model (any single-page visit with no second interaction was a bounce) to an engagement-based model in 2023, where GA4's 'engaged session' requires 10+ seconds, a conversion event, or 2+ pageviews. Bounce rate in GA4 is simply the inverse of engagement rate. The practical effect is that a visitor who reads one long article for two minutes and leaves now counts as engaged, not bounced - which is a more accurate model of a successful single-page visit but makes any bounce rate number from before 2023 not directly comparable to a current GA4 report.
What is a good average session duration?
It varies by business model far more than by industry label. Benchmark ranges commonly cited for 2026 put general content sites at 2 to 4 minutes, ecommerce at roughly 2 to 5 minutes depending on catalog depth, and B2B SaaS marketing sites at 5 to 10 minutes, since buyers are reading pricing, security documentation and case studies in one sitting. A universal target like 'two minutes seventeen seconds' provides little context without knowing what a session is actually being asked to accomplish.
Is mobile or desktop traffic bigger in 2026?
Globally, mobile and desktop are close to even and the split moves month to month. Statcounter's global figures for mid-2026 put mobile in the roughly 50-52% range against desktop around 48-50%, a narrower gap than the 60%+ mobile share commonly cited a few years earlier. The United States skews the other way: Statcounter's US-specific data for the same period shows desktop ahead at around 55%, which is why a single global split should not be applied to a US-only property without checking the regional number.
Sources
Contentsquare - 2026 Digital Experience Benchmark
Contentsquare - Benchmarks: What Does Engagement Look Like in 2026
Semrush - What Is Engagement Rate in GA4?
Siege Media - What's a Good GA4 Engagement Rate? 500+ Websites, Analyzed
Siege Media - Average Session Duration (Benchmarks from 115 Real Sites)
Focus Digital - Average Pages Per Session: Industry Benchmarks (2026)
Statcounter Global Stats - Desktop vs Mobile Market Share Worldwide
Statcounter Global Stats - Desktop vs Mobile Market Share, United States
Databox - Google Analytics 4 Industry Benchmarks
WebFX - GA4 Event Benchmarks: Metrics & Ranges for 2026


