



Table of contents
No published study prices or benchmarks an orthodontic booking page on its own, so this page builds the CRO case from the closest real data: Unbounce's health/wellness landing-page subcategories, WordStream's Google Ads benchmarks for dentists and physicians, and the AAO's 2025 patient census. Every borrowed figure below is labeled by the vertical it actually measures, not repackaged as an orthodontics-only number.
Key Takeaways
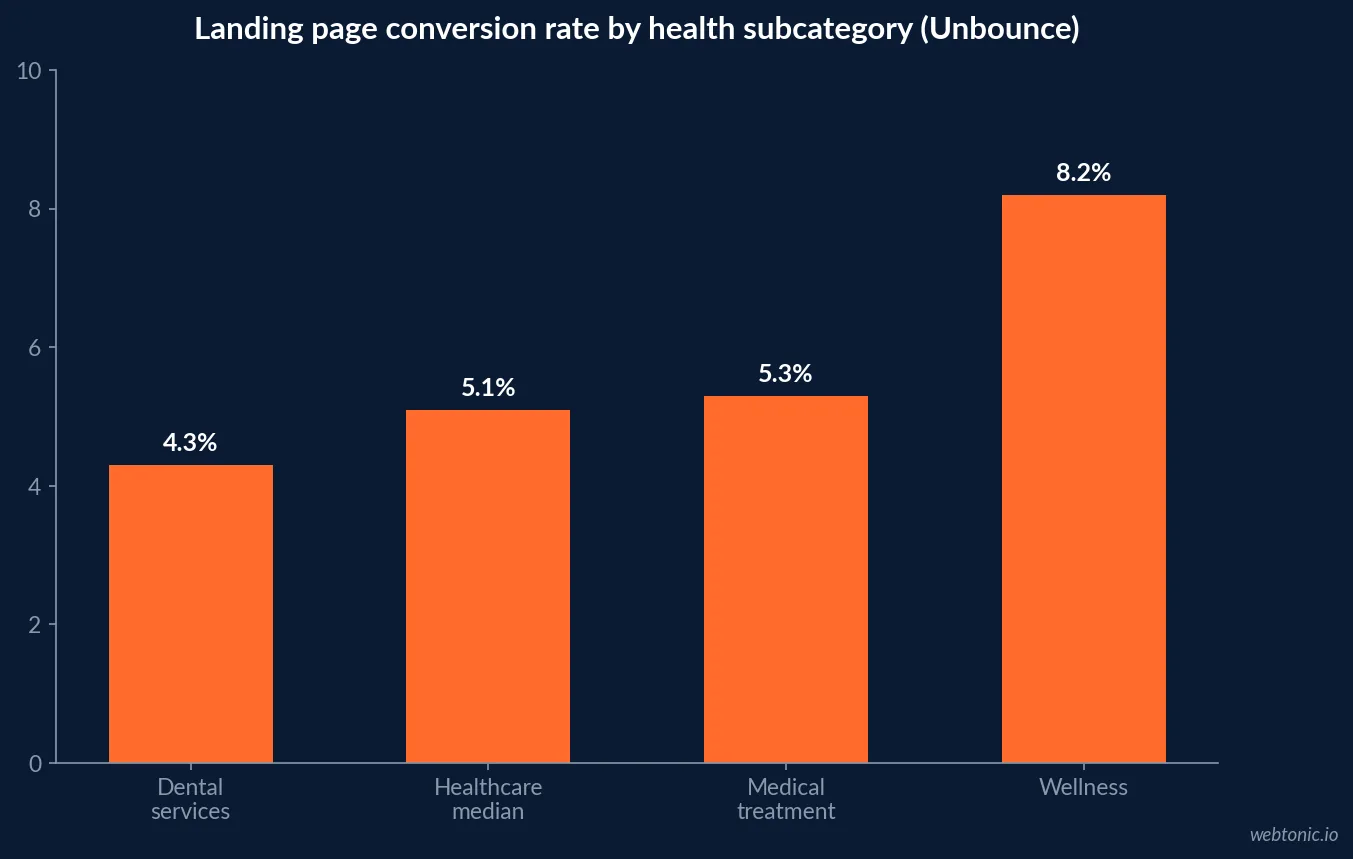
- Dental services convert at a 4.3% median on landing pages, per Unbounce - the only health subcategory below the 5.1% healthcare median.
- Wellness pages convert at an 8.2% median, nearly double the dental figure.
- Medical treatment pages median 5.3%, also above dental services.
- Half of dental landing pages fall between 2% and 8.3% conversion rate.
- Google Ads reports a 9.08% average conversion rate for dentists (WordStream 2025), a different, ad-platform-tracked metric.
- Physicians & Surgeons convert at 11.62% in Google Ads, the highest of 20 industries WordStream tracks.
- The cross-industry Google Ads average conversion rate is 7.52%.
- Dentists pay a $7.85 average cost per click in Google Ads, against $5.26 cross-industry.
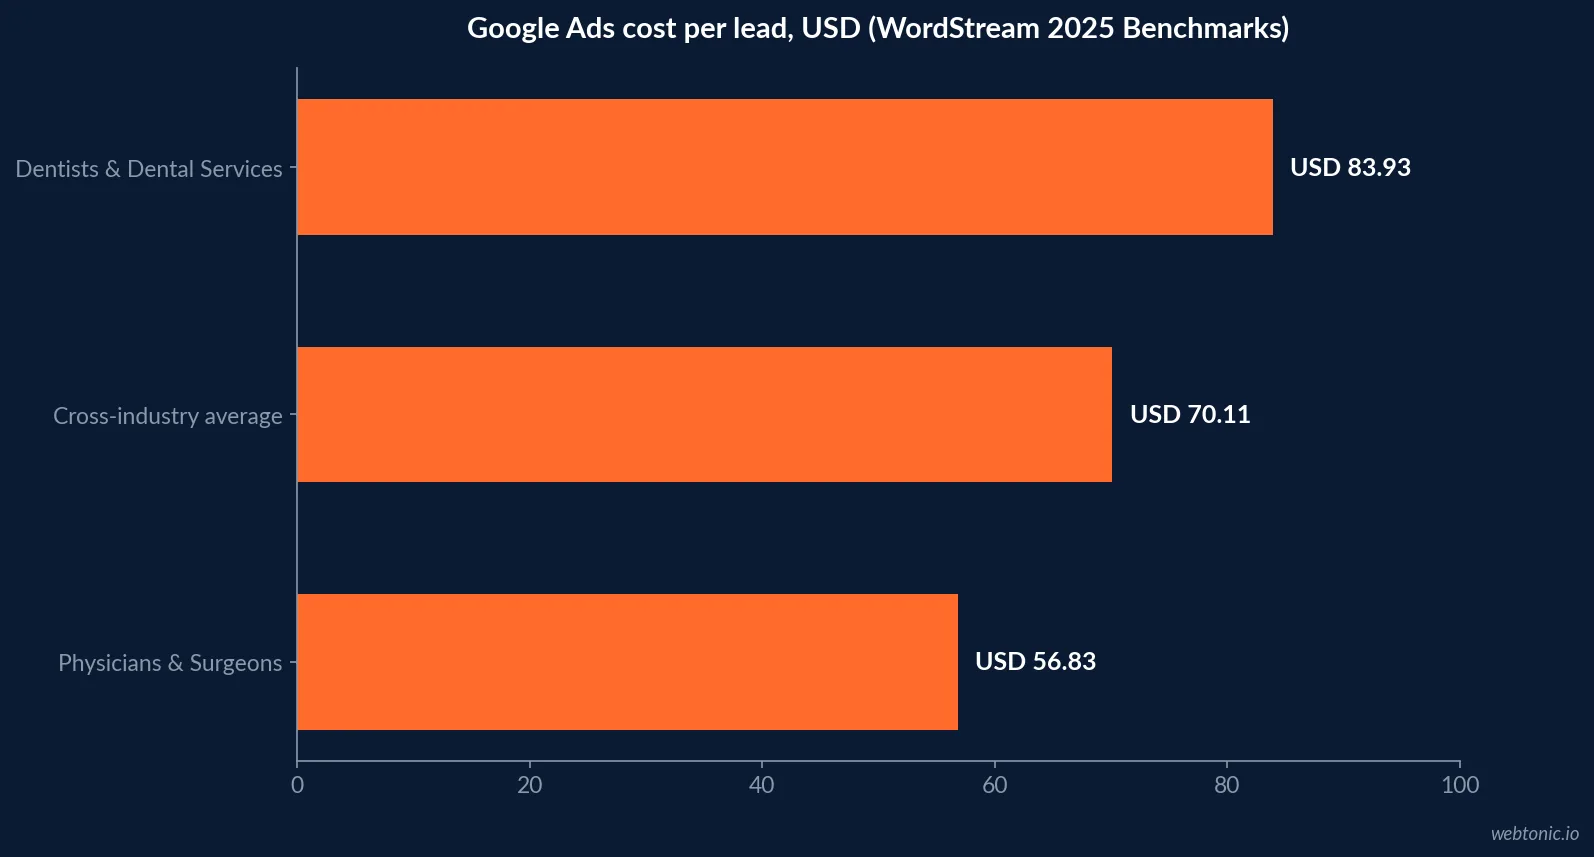
- Cost per lead for dentists in Google Ads averages $83.93, against $70.11 cross-industry.
- 696 active patients per member in 2024, up 21% from 574 in 2022 - the AAO's highest per-member count in 38 years of surveying.
- An estimated 6.66 million patients are in active orthodontic treatment across AAO members in the US and Canada.
- 41% of referrals still come from general dentists, steady since 2018.
- 35% of referrals come from existing patients, also steady since 2018.
- 24% of AAO members cite the Find an Orthodontist directory as a referral source, up from 17% in 2018.
- That directory drove an estimated 28,000 treatment starts in 2024.
- 1.91 million adult patients are in treatment, up from 1.64 million in 2022.
Why the booking page carries more weight than the ad click
An orthodontic sale is rarely decided on the ad. It is decided on the page a parent lands on after clicking, where they have to book a consultation for a multi-month, multi-thousand-dollar treatment - a much bigger commitment than most landing-page offers. Unbounce's Conversion Benchmark Report, drawn from its own platform data across 57 million conversions and 41,000 landing pages, found that among health and wellness subcategories, dental services is the only one below the 5.1% healthcare median, converting at a 4.3% median with half of all dental pages landing between 2% and 8.3%.
Orthodontics is not split out separately in that report, so dental services - the closest sibling vertical, also selling a multi-visit treatment plan rather than a single appointment - is the fairest proxy available, and this page treats it as a proxy, not a direct number.
| Health/wellness subcategory (Unbounce) | Median landing page conversion rate | Notes |
|---|---|---|
| Wellness | 8.2% | Highest subcategory; typically single low-commitment sessions |
| Healthcare (all) | 5.1% | Industry median across all healthcare pages |
| Medical treatment | 5.3% | Above the healthcare median |
| Dental services | 4.3% | Only subcategory below the median; closest proxy for ortho |
What the Google Ads platform itself reports (a different metric)
WordStream's 2025 Google Ads Benchmarks Report, built from more than 16,000 US-based campaigns running April 2024 through March 2025, reports Dentists & Dental Services at a 9.08% average conversion rate, above the 7.52% cross-industry average but below Physicians & Surgeons at 11.62%, the highest of the 20 industries the report tracks. That figure is Google Ads' own tracked-conversion metric (calls, forms, bookings attributed inside the ad account), not a pure landing-page conversion rate like Unbounce's - the two are not directly comparable, and a booking page can score well on one and poorly on the other.
The click itself is not cheap: dentists pay a $7.85 average cost per click, tied with Home & Home Improvement for the second-highest CPC WordStream tracks, and a $83.93 average cost per lead, above the $70.11 cross-industry figure. A weak booking page does not just lose the visitor - it wastes an above-average acquisition cost.
| Google Ads metric (WordStream 2025) | Dentists & Dental Services | Physicians & Surgeons | Cross-industry average |
|---|---|---|---|
| Click-through rate | 5.44% | 6.73% | 6.66% |
| Cost per click | $7.85 | $5.00 | $5.26 |
| Conversion rate | 9.08% | 11.62% | 7.52% |
| Cost per lead | $83.93 | $56.83 | $70.11 |
The patient volume a booking page now has to handle
The stakes for getting the page right have grown. The AAO's 2025 Economics of Orthodontics and Patient Census Survey, based on 635 usable member responses across the US and Canada, found active patients per member reached 696 in 2024, up from 574 in 2022 - a 21% jump and the highest per-member count recorded since the survey began in 1987, more than 10% above the previous record of 628 set in 2001. Scaled across the AAO's roughly 9,554-member database, that implies an estimated 6.66 million patients in active treatment, including 1.91 million adults, up from 1.64 million in 2022.
Every one of those patients passed through a booking page, a phone call, or both, before becoming a start. A page converting at the low end of Unbounce's 2%-8.3% dental range, on that volume, is a measurable number of missed consultations, not a rounding error.
| AAO patient metric | 2022 | 2024 | Change |
|---|---|---|---|
| Active patients per member | 574 | 696 | +21% |
| Estimated total active patients (US/Canada) | ~5.5M (2022 survey base) | ~6.66M | Higher base + higher per-member count |
| Estimated adult patients in treatment | 1.64M | 1.91M | +16% |
Where the traffic actually comes from before it hits the page
A booking page has to convert two very different traffic sources. The AAO's 2023 survey found 41% of referrals came from general dentists and 35% from existing patients, both essentially flat since 2018 - warm traffic that usually arrives with intent already formed. But the AAO's own Find an Orthodontist directory is a growing third channel: 24% of members cited it as a referral source in 2024, up from 20% in 2022 and 17% in 2018, and the AAO estimates it drove 44,000 exams and 28,000 starts in 2024. Directory traffic behaves more like paid-search traffic - lower intent, more comparison shopping - and a booking page tuned only for warm referral visitors will under-convert it.
The booking channel a landing-page metric never sees
A landing page conversion rate, whether it is Unbounce's 4.3% dental median or a practice's own number, only counts what happens on the page. It misses the call a parent places straight from a Google Business Profile listing without ever clicking through to the site. Google's own Business Profile performance documentation confirms that call clicks, direction requests and website clicks are tracked as separate, parallel actions from a profile - meaning a practice auditing only its landing page CRO is blind to a real share of its booking volume, particularly for the directory-sourced traffic the AAO's Find an Orthodontist referrals represent.
The demand behind all of this keeps growing on the clinical side, even if landing pages have not caught up: Align Technology's own Q2 2026 earnings call transcript reported record Clear Aligner shipments of 691,785 cases, up 7.4% year-over-year, with growth continuing "across orthodontists and GP dentist channels" and across "adult, teen, and growing patient segments" - company-reported demand growth that a 4.3%-median booking page is leaving on the table if it is not fixed alongside the call-tracking gap above.
| Booking channel | What it tracks | What a landing-page-only CRO audit misses |
|---|---|---|
| Website landing page | On-page form submits, booked appointments | Nothing - this is the audited channel |
| Google Business Profile calls | Call clicks tracked in GBP Insights | Never reaches the landing page at all |
| Direction requests | In-person walk-in intent from GBP | No page interaction to measure |
| Directory referral (AAO Find an Orthodontist) | Referral click-through to site or phone | Often phones the office directly, bypassing the page |
Five things an orthodontic booking page can fix this quarter
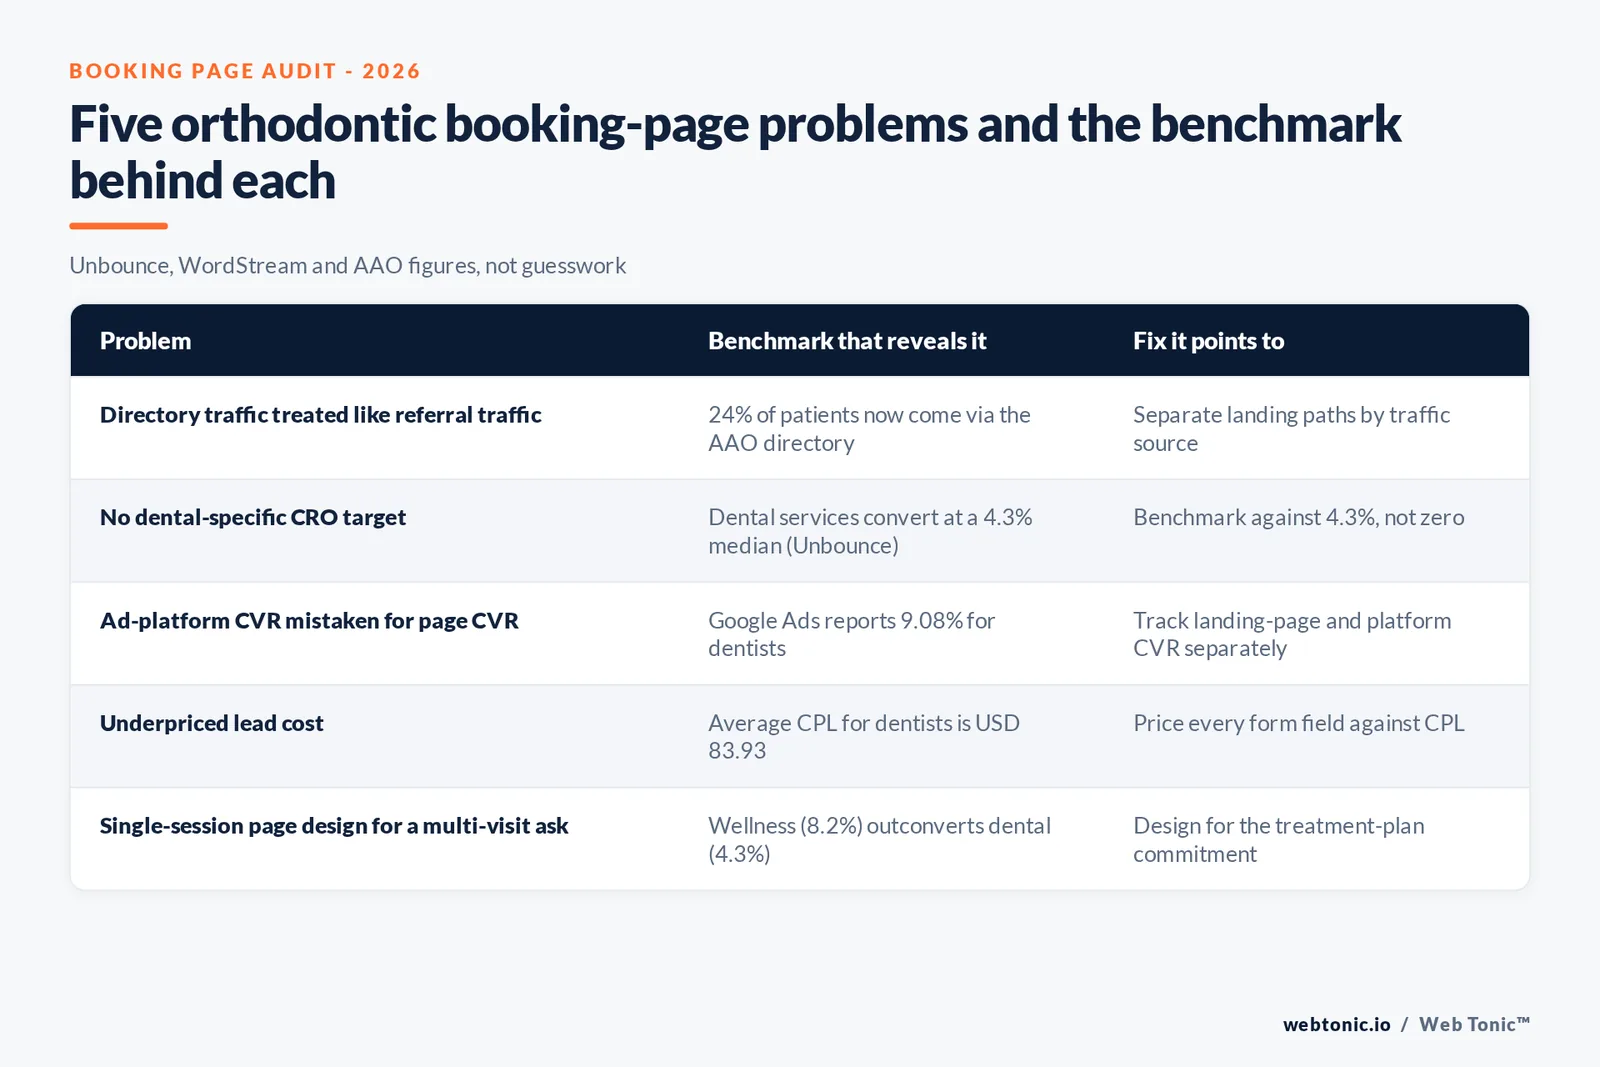
- Separate referral-traffic and directory-traffic landing experiences - the 24% directory-sourced share needs more trust-building content than warm referral traffic.
- Benchmark against 4.3%, not against nothing - Unbounce's dental services median is the closest available yardstick until an ortho-specific study exists.
- Track Google Ads conversions and landing-page conversions separately - a 9.08% platform conversion rate can hide a page converting well below the 4.3% dental median.
- Price the page's job against the $83.93 average cost per lead - a form that adds one extra field can be more expensive than it looks once CPL is factored in.
- Design for the multi-visit commitment, not a single-session ask - Unbounce's gap between wellness (8.2%) and dental (4.3%) tracks with exactly that difference in commitment.
Our performance creative team builds and tests booking pages against benchmarks like these rather than against guesswork, and our breakdown of what Google Ads actually costs is a useful next read before setting next quarter's acquisition budget. If the call-tracking gap above is news to your team, talk to us before the next budget cycle locks in.
Frequently Asked Questions
Is there a landing page conversion rate benchmark for orthodontics specifically?
No. Unbounce's Conversion Benchmark Report, built from its own platform data across 57 million conversions and 41,000 landing pages, breaks health and wellness into subcategories - healthcare overall (5.1% median), medical treatment (5.3%), wellness (8.2%) and dental services (4.3%) - but orthodontics is not split out on its own. Dental services is the closest published proxy, and it is the one subcategory below the industry median.
Why do orthodontic booking pages convert lower than other health pages?
Unbounce does not publish a causal answer, but the pattern fits a high-consideration purchase: Unbounce's own research on landing pages found wellness pages, which tend to sell single low-commitment sessions, convert nearly double the rate of dental pages, which typically ask a visitor to book a consultation for a multi-month treatment plan. That is a bigger ask on the same page.
What conversion rate does Google Ads report for dentists, and how does that differ from a landing page metric?
WordStream's 2025 Google Ads Benchmarks Report, built from over 16,000 US campaigns, puts the average conversion rate for Dentists & Dental Services at 9.08%, against a 7.52% cross-industry average and 11.62% for Physicians & Surgeons. That figure counts any tracked Google Ads conversion action (calls, form fills, bookings), which is a different, usually higher, number than Unbounce's landing-page-only conversion metric - the two should not be compared directly, only tracked separately.
How many patients are actually moving through orthodontic booking funnels right now?
The AAO's 2025 Economics of Orthodontics and Patient Census Survey, based on 635 member responses, found active patients per member reached 696 in 2024, up from 574 in 2022 and the highest figure in the survey's 38-year history. Scaled across the AAO's roughly 9,554-member database, that is an estimated 6.66 million patients in active treatment - each of whom went through a booking page or phone call first.
Where do most new orthodontic patients actually come from before they reach the booking page?
The AAO's 2023 Economics survey found referrals from general dentists held steady at 41% and referrals from existing patients at 35%, both essentially unchanged from 2018. The AAO's own 'Find an Orthodontist' directory contributed to an estimated 44,000 exams and 28,000 treatment starts in 2024, cited by 24% of respondents as a referral source, up from 17% in 2018 - meaning a booking page increasingly has to convert directory traffic, not only referral traffic.
Sources
Unbounce - Healthcare, Wellness & Medical Services conversion rate benchmarks
WordStream by LocaliQ - 2025 Google Ads Benchmarks Report
American Association of Orthodontists - 2025 Economics of Orthodontics and Patient Census Survey
American Association of Orthodontists - 2023 Economics of Orthodontics Survey (referral data)
Google Business Profile Help - Understand your Business Profile performance & insights
Align Technology - Q2 2026 Earnings Call Transcript (The Motley Fool)
Web Tonic - Performance Creative
Web Tonic - How Much Does Google Ads Cost


