



Table of contents
Home loan ad creative is the single biggest lever lenders overlook — a Quality Score jump from 4 to 8 can reduce CPC by 40–50%, turning the same budget into nearly twice the leads. Below are the freshest benchmarks, platform breakdowns, and creative testing insights shaping lending advertising in 2026.
Key Takeaways
- Google Ads mortgage CPC sits at $7.84 with a 2.64% CTR and 3.40% conversion rate (Benchmarketing, 2026).
- Meta Ads delivers a 2.4× ROAS for home lenders at a much lower $3.24 CPC (Benchmarketing).
- Ad volume is the bottleneck — lenders need 50+ conversion events per ad set per week, which demands hundreds of ad variants, not three (Prestyj).
- Diversified ad formats cut CPL by 26% and lifted lead-to-pre-approval rates to 43% in a home lending case study (AdBetter).
- Personalized lending campaigns boost conversions by 20–30%, with 80% of consumers preferring brands that personalize (WorldMetrics).
- Home lending companies invested $12.3 billion in digital advertising, with 35% allocated to social media (WorldMetrics).
Home Loan Ad Performance Benchmarks by Platform
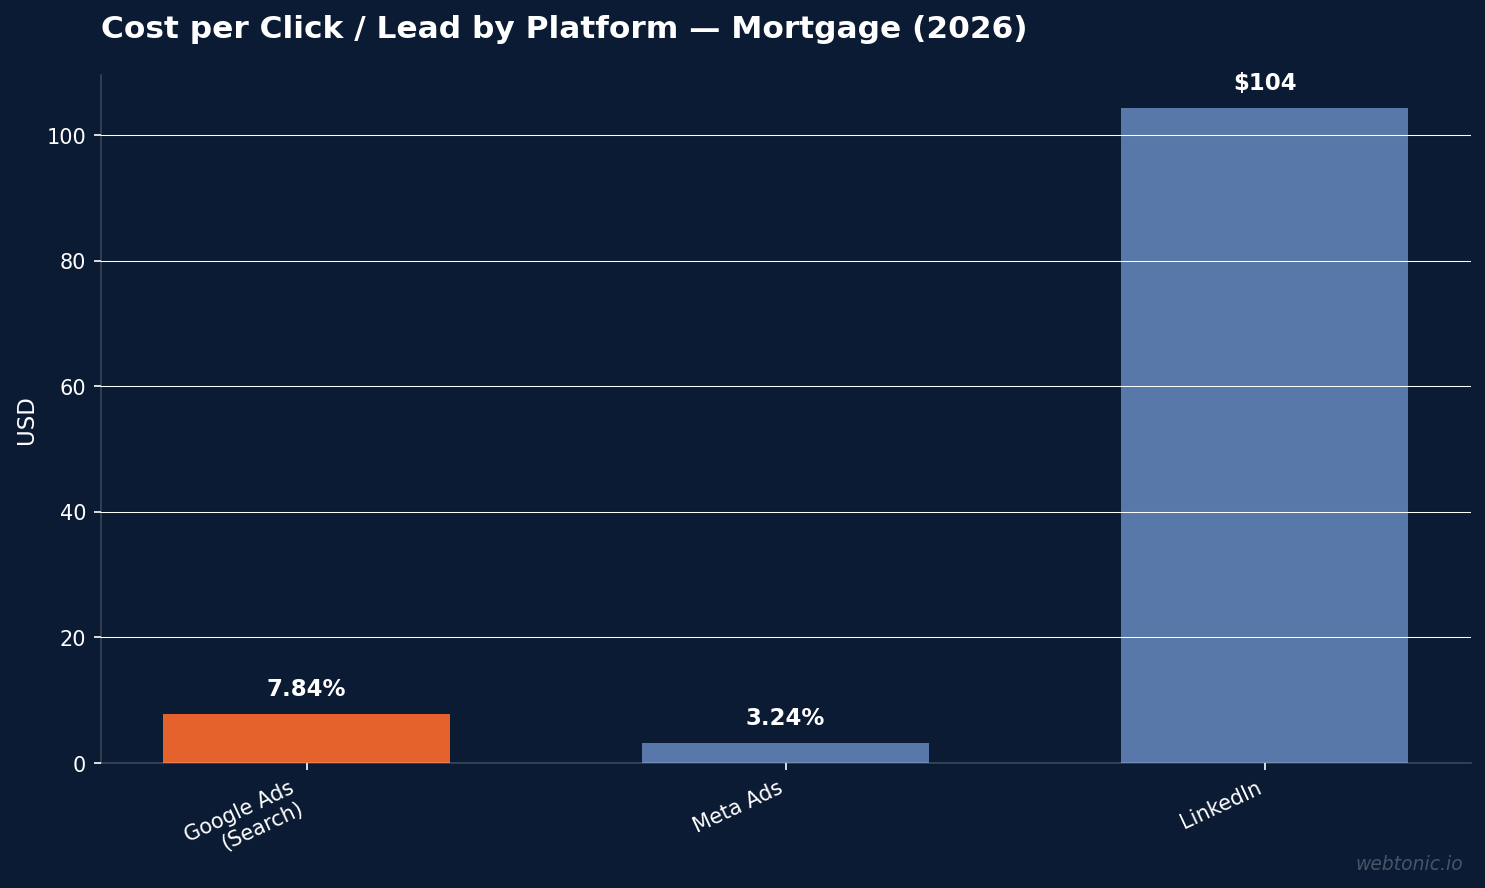
Platform choice shapes every downstream metric. The table below compares the core advertising benchmarks across growth marketing channels used by home lenders in 2026.
| Platform | CTR | Avg. CPC | Conversion Rate | Cost per Lead |
|---|---|---|---|---|
| Google Ads (Search) | 2.64% | $7.84 | 3.40% | $230.60 |
| Meta Ads | 0.74% | $3.24 | — | $15–$60 (first-party) |
| — | — | — | $104.40 | |
| Real Estate Search (Overall) | 7.61% | — | — | — |
Sources: Benchmarketing, LeadPops, LocalIQ
Google Search remains the highest-intent channel at $7.84 CPC, while Meta's lower entry cost makes it the primary testing ground for creative formats. The 7.61% real estate search CTR reported by LocalIQ in 2026 represents a 9.73% year-over-year decline, reinforcing the need for sharper performance creative to hold attention.
Ad Volume and Testing Framework
Running three ad creatives is the most common — and most expensive — mistake in home loan advertising. Facebook's algorithm requires at least 50 conversion events per ad set per week to optimize effectively. At typical typical CPLs of $35–$80 per lead, most loan officers spending $2,000–$4,000 per month cannot generate enough data from a small ad set.
One recording session can produce 300–1,000 unique video variations — each cut with a different hook, body, CTA, B-roll pattern, and opening line — all formatted for Facebook, Instagram, and TikTok (Prestyj). The math is simple: CPL starts at $45 with fresh ads but climbs to $90 by week three when the algorithm exhausts a small ad pool.
| Creative Approach | Typical CPL (Week 1) | CPL Drift (Week 3+) | Algorithm Health |
|---|---|---|---|
| 3 video creatives | $45 | $90+ (2× increase) | Starved — under 50 events/week |
| 50+ ad variants | $35–$45 | $40–$55 (stable) | Healthy — continuous optimization |
| 300+ variants (batch system) | $30–$40 | $35–$45 (refreshed) | Optimal — fresh signals weekly |
Source: Prestyj
Multi-Format Ad Performance
Diversifying ad formats beyond static images delivers measurable results. A mortgage broker case study by AdBetter tested static images, employee-generated content (EGC) videos, and animations simultaneously. The results over a sustained campaign period:
- 26% reduction in cost per lead across all channels.
- 43% lead-to-pre-approval (DIP) conversion rate — nearly double the industry norm.
- 51% reduction in cost per agreement in principle (pre-approval stage).
- 83% reduction in cost per completed sale when combining format diversity with funnel tracking.
- 100+ leads per month generated consistently after format expansion.
The key driver was not any single format but the combination: static images for brand awareness, EGC videos for trust, and animations for rate-comparison messaging. Each format served a different stage of the borrower journey, from initial awareness through to pre-approval intent. Each format served a different funnel stage, and deeper KPI tracking across meeting, agreement-in-principle, and go-live stages allowed rapid reallocation toward the highest-performing combinations.
Personalization and Dynamic Creative
Personalized marketing campaigns increase lending conversion rates by 20–30%, with 80% of consumers more likely to engage with brands that tailor their messaging (WorldMetrics). For mortgage lenders, personalization means interest-specific headlines, location-aware messaging, and loan-type segmentation.
Mortgage professionals report a 45% higher email open rate when using personalized subject lines (WorldMetrics). This principle extends to ad creative: dynamic headlines referencing specific interest environments or local market conditions consistently outperform generic "low rates" messaging. 87% of homebuyers recognize at least one lender brand, making differentiation through personalized creative essential rather than optional.
Digital Ad Spend Allocation
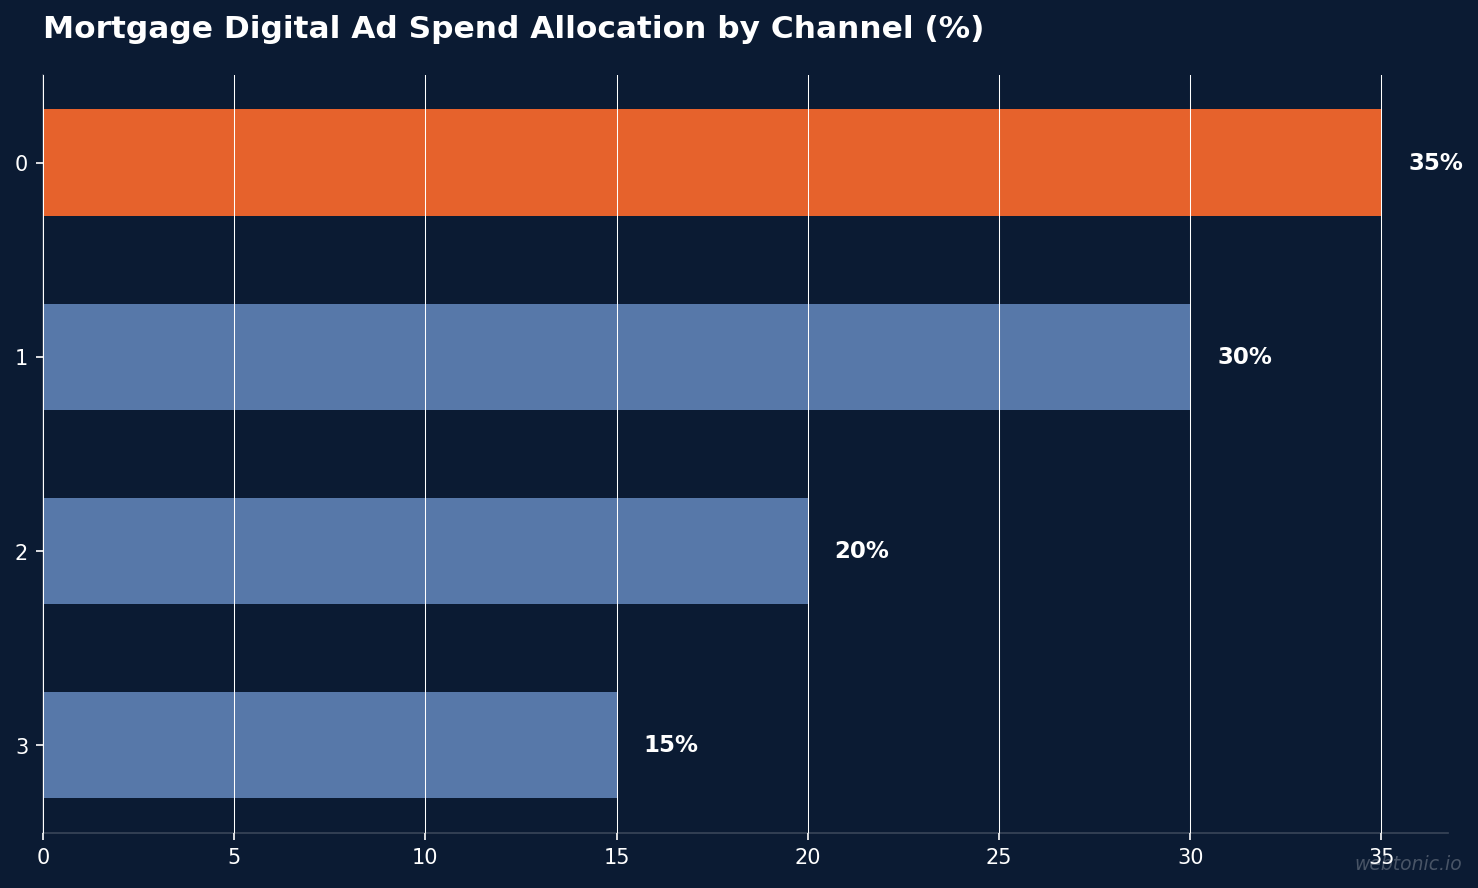
Mortgage lenders invested $12.3 billion in digital advertising, with social media capturing 35% of that spend (WorldMetrics). The allocation reflects a shift toward platforms where ad performance — not just bid strategy — determines performance.
| Channel | Share of Digital Spend | Primary Creative Format | Key Metric |
|---|---|---|---|
| Social Media | 35% | Video + static + carousel | CPL $15–$60 |
| Search (Google/Bing) | ~30% | RSA text ads | CPA $230.60 |
| Display & Programmatic | ~20% | Banner + native | Brand awareness / retargeting |
| Email & Direct | ~15% | Personalized templates | 21.2% open rate |
Sources: WorldMetrics, Benchmarketing
Lead Source Economics by Creative Channel
Not all leads carry the same conversion potential. The creative channel directly shapes both cost and quality, as LeadPops data demonstrates:
| Lead Source | Close Rate | CPL Range | Est. Cost per Funded Loan |
|---|---|---|---|
| Shared aggregator (LendingTree, Zillow) | 0.5–2% | $30–$100 | $5,000–$10,000+ |
| Premium aggregator (well-run) | 8–10% | $120–$250 | $1,750–$2,200 |
| First-party exclusive (paid ads) | 2–5% | $15–$60 | $1,000–$3,000 |
| Organic / SEO | 5–12% | ~$0 (platform cost) | Dramatically lower |
| Database reactivation | 10–20% | ~$0 (email cost) | Very low |
| Agent referrals | 40–60% | ~$0 (relationship cost) | Lowest |
Source: LeadPops
First-party exclusive leads from paid ads cost $15–$60 per lead and close at 2–5%, making ad relevance the primary differentiator at this price point. The gap between a $1,000 and $3,000 cost per funded loan is almost entirely determined by ad ad relevance, landing page alignment, and speed-to-contact — not media spend.
Quality Score and Creative Efficiency
On Google Ads, ad quality directly impacts cost through Quality Score. LeadPops reports that a Quality Score improvement from 4 to 8 reduces CPC by 40–50%. On a $5,000 monthly budget, that translates to the difference between 100 leads and 180 leads with zero additional spend.
For Meta Ads, the 2.4× ROAS benchmark (Benchmarketing) means every dollar spent on ad testing that lifts performance even marginally compounds across the entire budget. A refinance-focused lender's 15% share of voice versus a purchase-focused lender's 9% (WorldMetrics) suggests that ad frequency and format diversity correlate with market share capture.
Ad Design Best Practices Backed by Data
- Test at scale: Generate 50+ ad variants per campaign cycle. One 20-minute video recording can yield 300+ cut variations (Prestyj).
- Mix formats deliberately: Static for awareness, EGC video for trust, animation for interest comparisons. Format diversity drove a 26% CPL reduction in the Limitless Finance case (AdBetter).
- Personalize aggressively: 20–30% conversion lift from personalized campaigns (WorldMetrics). Use rate-specific, location-aware, and loan-type creative.
- Track beyond the lead: Measure meeting, pre-approval, and close ratios by ad variation. The 83% cost-per-sale reduction in AdBetter's case came from funnel-level optimization, not top-of-funnel tweaks.
- Refresh weekly: CPL doubles within 3 weeks on stale creative. Budget 15–20% of ad spend toward ongoing ad production and testing (Bill Rice Strategy Group).
- Optimize Quality Score: On Google Ads, a QS jump from 4 to 8 delivers 40–50% CPC savings — the highest-ROI ad investment available (LeadPops).
Video vs. Static vs. Carousel: Format-Level Benchmarks
Format selection is not a creative preference — it directly impacts delivery efficiency. Mortgage lenders running video-first campaigns on Meta consistently achieve lower CPLs than static-only strategies. Prestyj documents that short-form video (15–30 seconds) outperforms long-form by 2–3× on cost per lead when hooks are tested systematically. The critical variable is not production quality but hook diversity — the first 3 seconds determine whether the viewer watches or scrolls.
Employee-generated content (EGC) consistently outperforms polished studio production for mortgage advertising. The authenticity signal of a real loan officer speaking directly to camera resonates with borrowers seeking trust during one of the largest financial decisions of their lives. Evocalize recommends starting simple, staying authentic, and letting performance data guide design iterations rather than assumptions about what looks "professional."
Carousel ads serve a distinct function in mortgage campaigns: interest comparison and multi-product education. A single carousel can showcase conventional, FHA, VA, and jumbo loan options side by side, allowing borrowers to self-select toward the product that fits their situation. This pre-qualification function reduces unqualified lead volume while improving the quality of form submissions. When combined with data intelligence tracking, carousel engagement patterns reveal which loan products generate the highest-intent borrowers.
Compliance Constraints on Mortgage Ad Creative
Mortgage advertising faces regulatory scrutiny that directly shapes ad approach. Regulatory fines totaled $450 million, with 35% tied to advertising misrepresentation and 25% to disclosure violations (WorldMetrics). Rate-focused ad creative requires specific disclosures, and 70% of lenders cite TRID compliance as their top challenge when creating advertising materials.
This constraint paradoxically benefits lenders who invest in ad production infrastructure. Compliant ad templates that pass legal review once can be deployed at scale through dynamic ad optimization, allowing hundreds of variations that all meet regulatory requirements. Home lenders spend $150,000 on average on compliance software (WorldMetrics), and the fastest-growing use case is automating ad compliance checks so design teams can iterate without bottlenecking on legal review.
Frequently Asked Questions
What is the average CTR for mortgage ads on Google in 2026?
The median click-through rate for mortgage Google Ads is 2.64% according to Benchmarketing's 2026 benchmark data. This is based on median values across Q1 2023 through Q4 2024, making it the most current cross-industry reference. Real estate search ads overall average 7.61% CTR (LocalIQ), but mortgage-specific searches carry higher CPCs and more competitive overlap.
How many ad creatives should a mortgage lender test?
At minimum, 50+ creative variants per campaign cycle. Facebook's algorithm needs roughly 50 conversion events per ad set per week to optimize. At home loan CPLs of $35–$80, most budgets under $5,000/month cannot generate enough data with fewer than 50 variants. A single 20-minute video recording can produce 300–1,000 variations through different hooks, CTAs, and formats.
Does video outperform static images for mortgage advertising?
Neither format wins in isolation. The strongest results come from mixing formats: static images for brand awareness, EGC videos for trust, and animations for rate comparisons. A case study from AdBetter showed this multi-format approach delivered a 26% CPL reduction and 43% lead-to-pre-approval rate compared to a single-format strategy.
What is the cost per funded loan from paid advertising?
For first-party exclusive leads generated through paid ads, the estimated cost per funded loan ranges from $1,000 to $3,000 based on a 2–5% close rate and $15–$60 CPL (LeadPops). Shared aggregator leads (LendingTree, Zillow) are far more expensive at $5,000–$10,000+ per funded loan despite lower per-lead costs, due to their 0.5–2% close rate.
How does personalization impact lending ad performance?
Personalized home loan marketing campaigns increase conversion rates by 20–30%, and 80% of consumers report being more likely to engage with brands offering personalized experiences (WorldMetrics). Personalized email subject lines alone boost open rates by 45%, a principle that extends to ad headlines referencing specific interest environments or local market conditions.
Sources
https://www.benchmarketing.org/benchmarks/industries/mortgage
https://leadpops.com/blog/mortgage-lead-conversion-rates
https://leadpops.com/blog/google-ads-mortgage-brokers
https://prestyj.com/blog/mortgage-broker-video-ad-creative-testing-2026
https://adbetter.com/case-studies/limitless-finance/
https://worldmetrics.org/marketing-in-the-mortgage-industry-statistics/
https://localiq.com/blog/real-estate-search-advertising-benchmarks/
https://billricestrategy.com/blog/mortgage-marketing-budget-allocation-2026
https://www.dataally.ai/blog/mortgage-marketing
https://evocalize.com/blog/best-practices-for-mortgage-ad-images/


