



Table of contents

US mobile revenue crossed 50% of ecommerce sales for the first time in Q2 2026, hitting 51.3%, while mobile traffic already sits at 72.4%. That 21-point gap between traffic share and revenue share is the number ecommerce teams should be tracking, not the traffic percentage alone. This page lays out where that gap comes from and what closes it.
Key Takeaways
- Mobile crossed 51.3% of US ecommerce revenue in Q2 2026, the first time it passed 50% in a quarter.
- Mobile traffic share sits at 72.4% of US ecommerce visits.
- Global mobile commerce revenue was near USD 2.5 trillion in 2025, per Statista.
- Mobile's share of global retail ecommerce is projected to reach 63% by 2028, up from 43% in 2018.
- Mobile's share of retail orders already sits at 71% globally, per Statista.
- Desktop converts at 3.4%, 74% higher than mobile web, per Contentsquare's 2026 benchmark.
- Desktop delivers 47% of time spent from just 30% of visits, the opposite ratio of mobile.
- One in three visits now starts on a product detail page, driving 40% of all page views.
- Baymard's tracked average cart abandonment rate is 70.19%, essentially unchanged in 13 years.
- Salesforce recorded 82% cart abandonment in Q2 2026, a mobile- and social-heavy quarter.
- Global digital traffic grew 18% in Q2 2026 while order volume grew just 1%, per Salesforce.
- Social ecommerce visits grew 29% in the same quarter.
- The average US checkout shows 23.48 form elements against a workable ~12-element ideal.
- Checkout design fixes lift conversion by 35.26% on average, per Baymard's usability research.
- 42% of US shoppers cite "just browsing" as their abandonment reason, the largest single cause.
- 17% abandon due to a checkout process that feels too long or complicated.
| Mobile commerce metric, 2025-2026 | Figure | Source |
|---|---|---|
| US mobile ecommerce revenue share, Q2 2026 | 51.3%, first time over 50% in a quarter | Adobe Analytics, reported by Ecommerce Times |
| US mobile ecommerce traffic share, Q2 2026 | 72.4% | Adobe Analytics, reported by Ecommerce Times |
| Global mobile commerce revenue, 2025 | ~USD 2.5 trillion | Statista |
| Mobile share of global retail ecommerce, 2028 forecast | 63%, up from 43% in 2018 | Statista |
| Mobile share of global retail orders | 71% | Statista |
| Desktop conversion rate vs. mobile web | 3.4% desktop, 74% higher than mobile | Contentsquare 2026 Digital Experience Benchmark |
The crossover that just happened
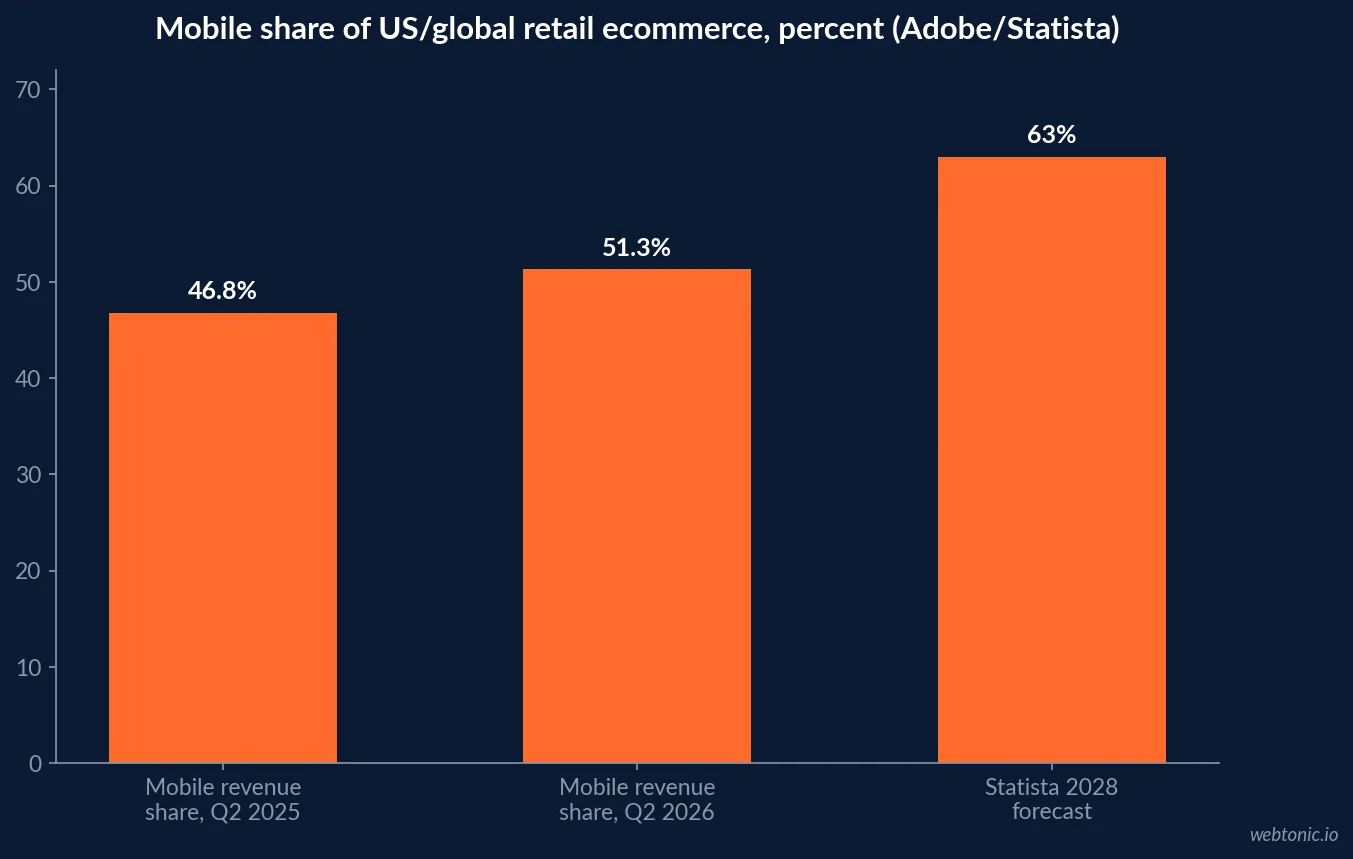
Mobile commerce spent years being described as "almost half" of ecommerce revenue. That framing ended in Q2 2026, when mobile devices accounted for 72.4% of US ecommerce traffic and, for the first time in the tracking history of the underlying data set, mobile revenue also crossed the 50% line, reaching 51.3%, up from 46.8% a year earlier, according to Ecommerce Times' report on Adobe Analytics' Q2 2026 data. Statista's mobile commerce topic page frames the same shift globally: mobile commerce revenue reached roughly USD 2.5 trillion in 2025 and mobile's share of total retail ecommerce is projected to climb from 43% in 2018 to 63% by 2028.
The order-level number is even starker: mobile already accounts for 71% of retail orders globally, per the same Statista data, ahead of its revenue share because mobile shoppers add to cart readily but do not always finish checkout on the same device or in the same session.
| US ecommerce, device split | 2025 | Q2 2026 | Trend |
|---|---|---|---|
| Traffic share, mobile | ~69.9% | 72.4% | Rising |
| Revenue share, mobile | 46.8% | 51.3% | Crossed 50% for the first time |
| Global order share, mobile | - | 71% | Ahead of revenue share |
| Global revenue share, mobile | - | ~59% | Behind order share |
Why the traffic-to-revenue gap exists
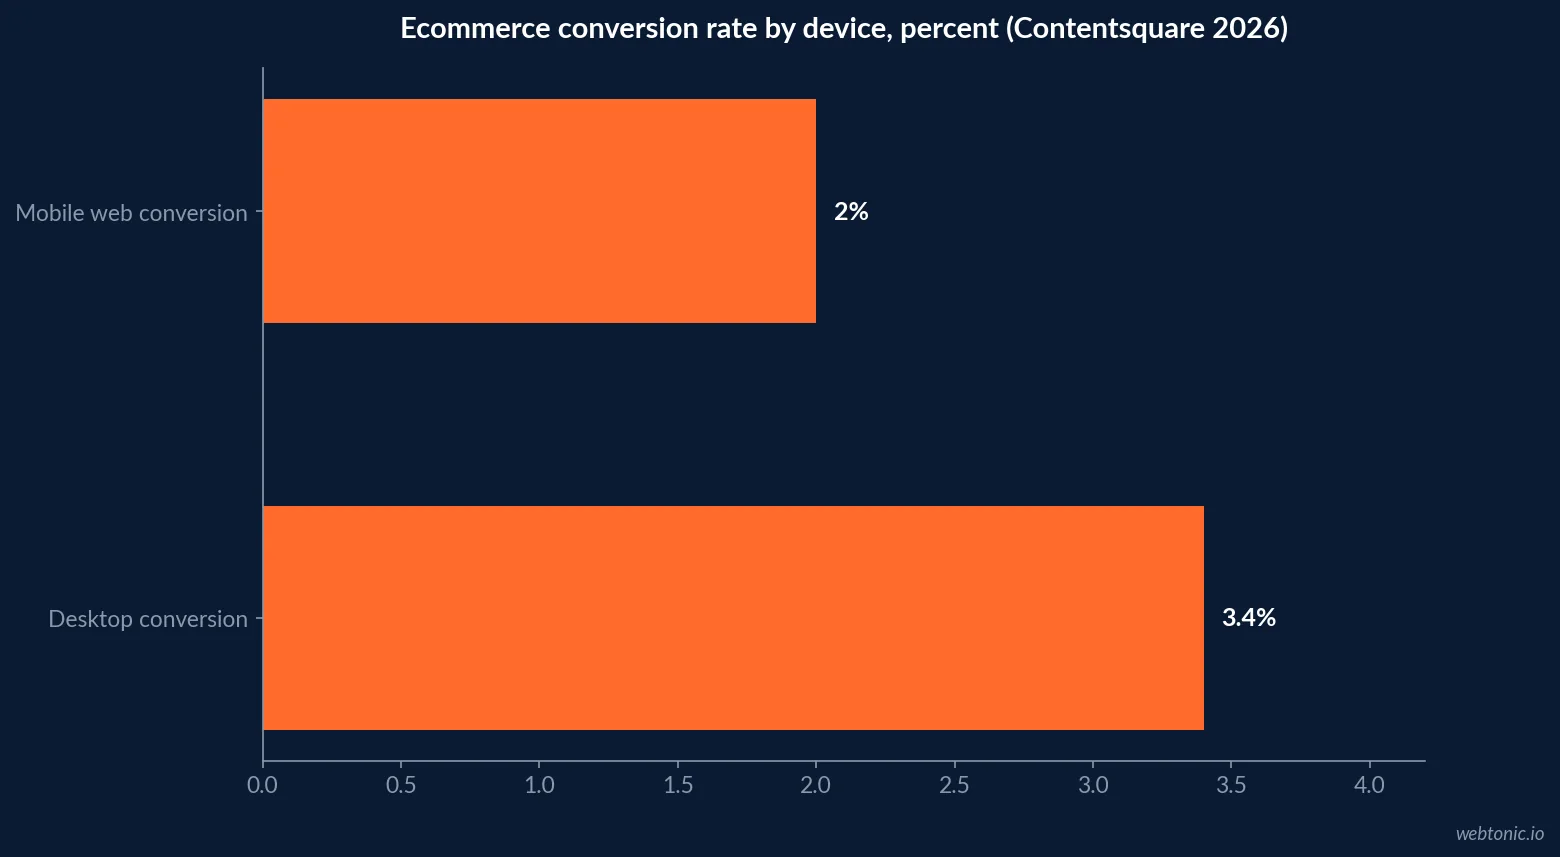
The gap is a conversion story, not a traffic story. Contentsquare's 2026 benchmark report, built from 99 billion web and app sessions across 6,500-plus sites and nine industries, found desktop still converts at 3.4%, which is 74% higher than mobile web. The same report frames it as a reach-versus-depth split: desktop delivers just 30% of visits but 47% of time spent, meaning shoppers still do their considered comparing and deciding on a bigger screen even after discovering a product on mobile.
Product pages have become the real mobile front door: one in three visits now starts on a product detail page, driving roughly 40% of all page views, but nearly two-thirds of those landings bounce - meaning a weak PDP is now a bigger leak than a weak homepage.
| Mobile conversion friction point, 2026 | Figure | Source |
|---|---|---|
| Desktop vs. mobile web conversion gap | Desktop 74% higher | Contentsquare 2026 Digital Experience Benchmark |
| Share of visits starting on a product page | 1 in 3 | Contentsquare 2026 Digital Experience Benchmark |
| Bounce rate from product-page landings | ~2 in 3 | Contentsquare 2026 Digital Experience Benchmark |
| Global cart abandonment rate (13-year average) | 70.19% | Baymard Institute |
| Q2 2026 cart abandonment (social/mobile-heavy quarter) | 82% | Salesforce Shopping Index |
What is actually breaking checkout
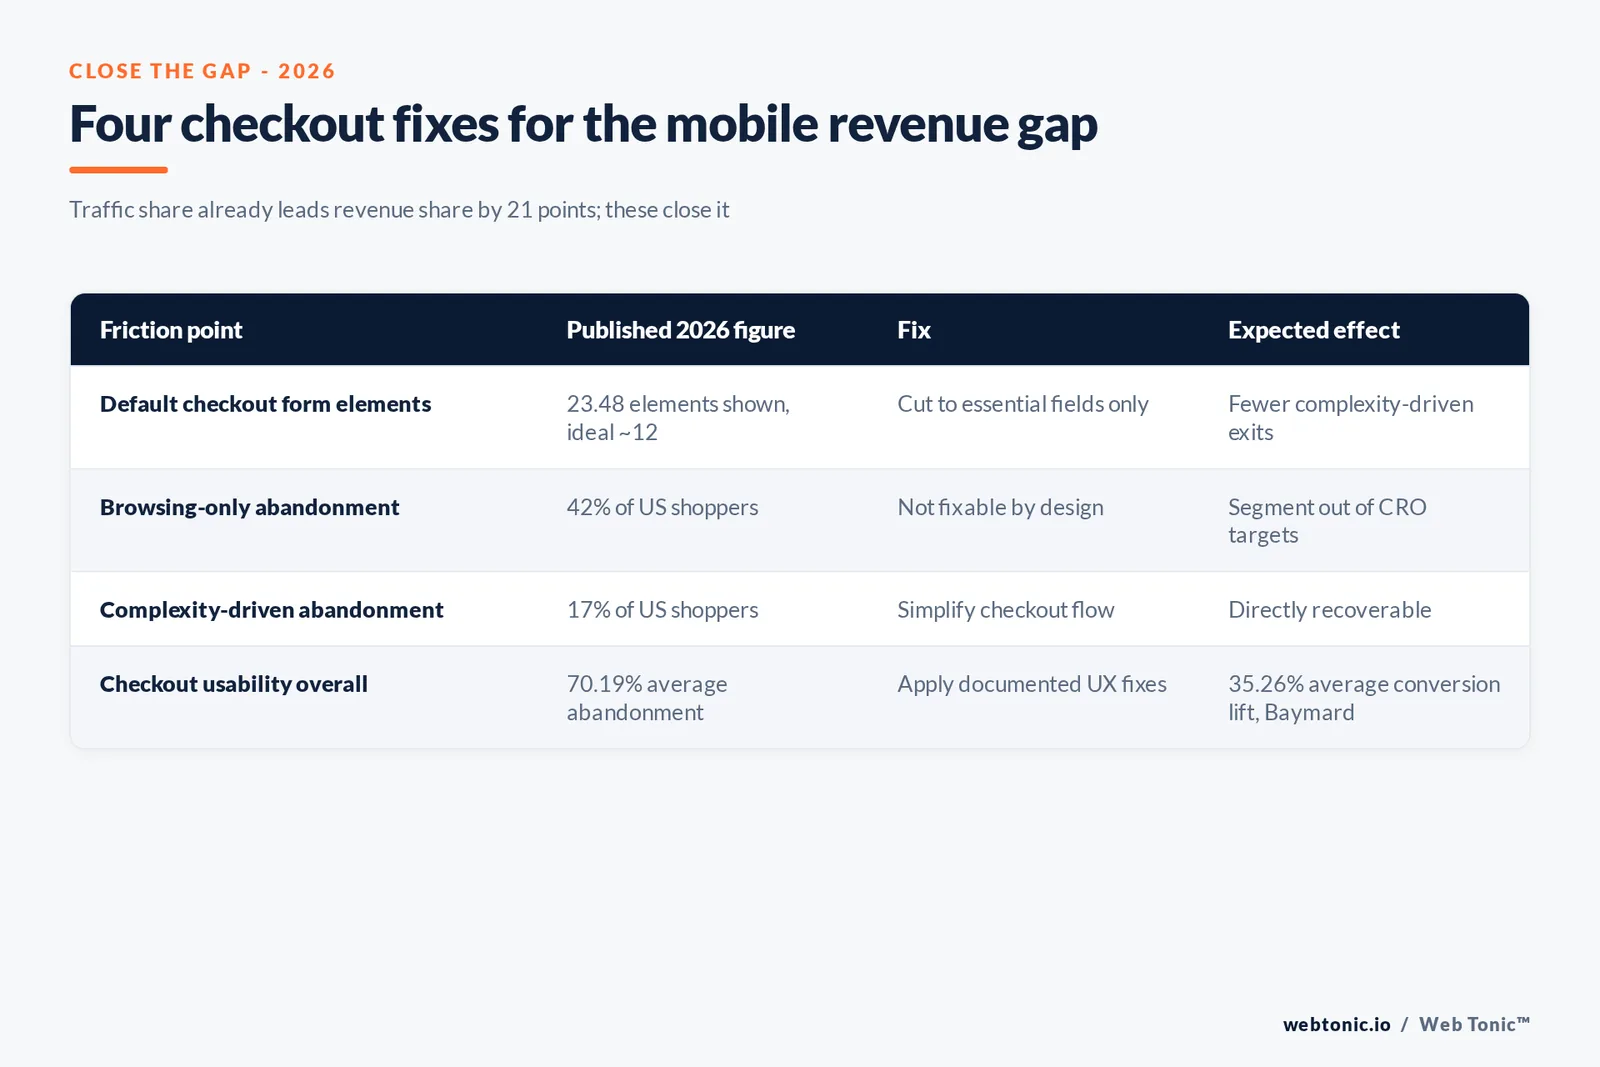
Baymard Institute's checkout usability research, based on 13 years of testing live production sites with real users, finds the global average cart abandonment rate essentially unchanged at 70.19%. Segmenting out unavoidable "just browsing" abandonment - which 42% of US shoppers cite as their reason - still leaves a large share of abandonment that better design can fix. 17% of shoppers abandon specifically because the checkout process feels too long or complicated, and Baymard's benchmark database shows why: the average US checkout flow displays 23.48 form elements by default, against an ideal closer to 12.
The payoff for fixing it is measurable. Baymard's own large-scale usability testing across leading sites - Walmart, Amazon, Wayfair, Crate & Barrel, ASOS among them - found that checkout design improvements alone can lift conversion by an average of 35.26%, even on sites that have already run several rounds of optimization.
Reading the Q2 2026 traffic surge correctly
Salesforce's Q2 2026 Shopping Index adds a warning about assuming more traffic means more revenue. Global digital traffic grew 18% in the quarter, but order volume grew just 1%, and cart abandonment reached 82% for the period. The traffic growth was concentrated in mobile and social: mobile now commands roughly three-quarters of online traffic, and social drove 29% more ecommerce visits than the prior quarter. Traffic from a scrolling, comparison-shopping social session converts at a fundamentally different rate than a direct visit with purchase intent already formed, which is why the traffic-to-order ratio moved so sharply out of sync.
| Q2 2026 quarter-over-quarter change | Figure | Source |
|---|---|---|
| Global digital traffic growth | +18% | Salesforce Shopping Index |
| Global order volume growth | +1% | Salesforce Shopping Index |
| Social ecommerce visit growth | +29% | Salesforce Shopping Index |
| Cart abandonment rate, the quarter | 82% | Salesforce Shopping Index |
The metrics worth putting on a dashboard
Instead of tracking a single "mobile share of revenue" number, ecommerce teams get more signal from three ratios: the gap between mobile traffic share and mobile revenue share (a widening gap flags a conversion problem, not a traffic problem); mobile conversion rate against desktop conversion rate on the same site; and the form-element count on your own mobile checkout against Baymard's roughly 12-element benchmark. Each of those three is actionable in a way that a headline mobile-share percentage is not.
If your product-detail-page bounce rate or mobile checkout friction has not been audited this year, our growth marketing team can benchmark it against the figures on this page before the next high-traffic quarter arrives.
How to run the audit yourself
Start with the cheapest check: count the form elements your own mobile checkout displays by default and compare that against Baymard's roughly 12-element benchmark. Anything above 15-16 is worth a design review before a traffic-driving campaign, not after. Next, pull your own mobile versus desktop conversion rate for the last full quarter and compare the gap against Contentsquare's 74% benchmark - a wider gap than that points to a mobile-specific UX problem rather than a normal device-behavior difference.
Finally, segment your own cart abandonment data the way Baymard does: separate "just browsing" sessions (identifiable by short time-on-page and no shipping-info entry) from sessions that reached the checkout flow and stalled. Only the second group is a design problem you can fix with the 35.26% average lift Baymard's research documents.
| Self-audit step | Benchmark to compare against | Action if you miss it |
|---|---|---|
| Count default checkout form elements | ~12 elements ideal (Baymard) | Remove non-essential fields |
| Pull mobile vs. desktop conversion rate | 74% gap (Contentsquare) | Investigate mobile-specific UX issues |
| Segment abandonment by funnel stage | 42% browsing, 17% complexity (Baymard) | Fix only the complexity-driven share |
| Check mobile vs. desktop revenue share trend | 51.3% mobile in Q2 2026 (Adobe/EMARKETER) | Confirm your own trend matches or lags the market |
How mobile app shopping changes the picture again
Web traffic and revenue are only part of the mobile story. EMARKETER's Retail Mobile App Shopping 2026 report finds that mobile will account for more than 50% of US ecommerce sales in 2027, a year earlier than the firm's previous forecast, and that shopping apps specifically are becoming the retention layer retailers lean on once a shopper has already converted once. A small set of feature-rich apps, tied closely to loyalty program integration, increasingly shapes repeat-purchase behavior more than the mobile web experience does.
That has a direct implication for where a mobile commerce budget should go after checkout is fixed: app and loyalty integration compounds returning-customer revenue in a way a one-time mobile web conversion rate improvement cannot, because it changes the channel a repeat shopper defaults to rather than just the experience on a single visit.
| Mobile app vs. mobile web signal, 2026 | Figure | Source |
|---|---|---|
| US ecommerce sales via mobile, 2027 forecast | Over 50%, a year earlier than expected | EMARKETER Retail Mobile App Shopping 2026 |
| Role of shopping apps | Primary retention and loyalty channel | EMARKETER Retail Mobile App Shopping 2026 |
| Global mobile share of retail orders | 71% | Statista |
| Global mobile commerce revenue, 2025 | ~USD 2.5 trillion | Statista |
Where mobile commerce goes from here
The direction is not in question - Statista's own forecast has mobile reaching 63% of global retail ecommerce by 2028, and the US quarter-over-quarter data is already tracking ahead of prior projections. What is still open is whether conversion closes the gap with traffic growth, or whether abandonment keeps climbing as more low-intent social traffic enters the funnel. Teams that fix checkout friction now capture disproportionate share of that growth; teams that treat mobile share as a vanity metric will keep bleeding it to abandonment.
For a related read on paid channels feeding that mobile traffic, see our guide to what social ads cost in 2026, or talk to our team about auditing your mobile funnel.
Frequently Asked Questions
Has mobile really overtaken desktop for ecommerce revenue?
US mobile devices accounted for 72.4% of ecommerce traffic and, for the first time, crossed 50% of revenue in a single quarter, reaching 51.3% in Q2 2026. Statista projects the mobile share of global retail ecommerce will keep climbing to 63% by 2028, up from 43% in 2018.
Why does mobile traffic share outrun mobile revenue share?
Because conversion still lags. Contentsquare's 2026 Digital Experience Benchmark, built from 99 billion sessions across 6,500-plus sites, found desktop converts at 3.4%, which is 74% higher than mobile web. Mobile wins reach; desktop still wins the close, especially on considered purchases.
What is a realistic mobile cart abandonment rate to benchmark against?
Baymard Institute, which has tracked the metric for 13 years across 50-plus studies, puts the global average cart abandonment rate at 70.19%. Salesforce's Q2 2026 Shopping Index recorded cart abandonment at 82% for the quarter, reflecting a mobile-heavy, social-driven traffic mix that converts at a lower rate than direct site visits.
How much can checkout design actually recover?
Baymard's checkout usability research found that fixing documented usability issues alone can lift conversion by an average of 35.26% on large ecommerce sites, even ones as established as Walmart, Amazon and Wayfair. The average US checkout still shows shoppers 23.48 form elements by default, against a workable minimum closer to 12.
What should ecommerce teams track instead of just traffic share?
Track the gap between traffic share and order share, mobile-specific conversion rate against desktop, and form-element count in your own checkout against Baymard's roughly 12-element ideal. Those three numbers explain the mobile revenue crossover better than a single mobile-traffic percentage on its own.
Sources
Statista - Mobile commerce worldwide, statistics and facts
Contentsquare - 15 mobile analytics stats from the 2026 benchmark report
Baymard Institute - Reasons for Cart Abandonment, 2026 data
Baymard Institute - How to Reduce Cart Abandonment
Salesforce - 2026 Holiday Predictions, Shopping Index data
EMARKETER - Retail Mobile App Shopping 2026
Ecommerce Times - Adobe Commerce Report: Q2 2026 U.S. E-Commerce Hits $387B (Adobe Analytics data)


