



Table of contents
Martech has fallen to 19.4% of the marketing budget, a five-year low, while generative AI use inside marketing rose 220% in a year. Spending less on tools while doing more with them only works if ownership is explicit. Here are the 2026 adoption and tooling benchmarks.
Key Takeaways
- Martech is 19.4% of marketing budget, a five-year low, down from 26.6% in 2021.
- 62% of marketing leaders still plan to invest more in technology.
- 56% are shifting to consumption-based pricing; only 9% are cutting spend.
- 41% are adding usage controls and 24% are overhauling their systems.
- Just 9% describe their stack as fully AI-optimised.
- AI's share of marketing activities rose from 13.1% to 24.2%.
- Generative AI rose from 7.0% to 22.4% - a 220% increase in one year.
- 55.9% of marketing activity is projected to involve AI within three years.
- 41.5% are already working on generative engine optimisation.
- Use cases: content 73.9%, personalisation 65.4%, automation 48.9%, analysis 46.3%.
- 80% of marketers use AI for content and 75% for media production.
- 61% call this marketing's biggest disruption in 20 years.
- Training has fallen to 3.8% of marketing spend, from 5.8%.
- AI capability gaps are the top barrier at 35.7%; architecture blocks 19.1%.
Tool budgets are shrinking as a share
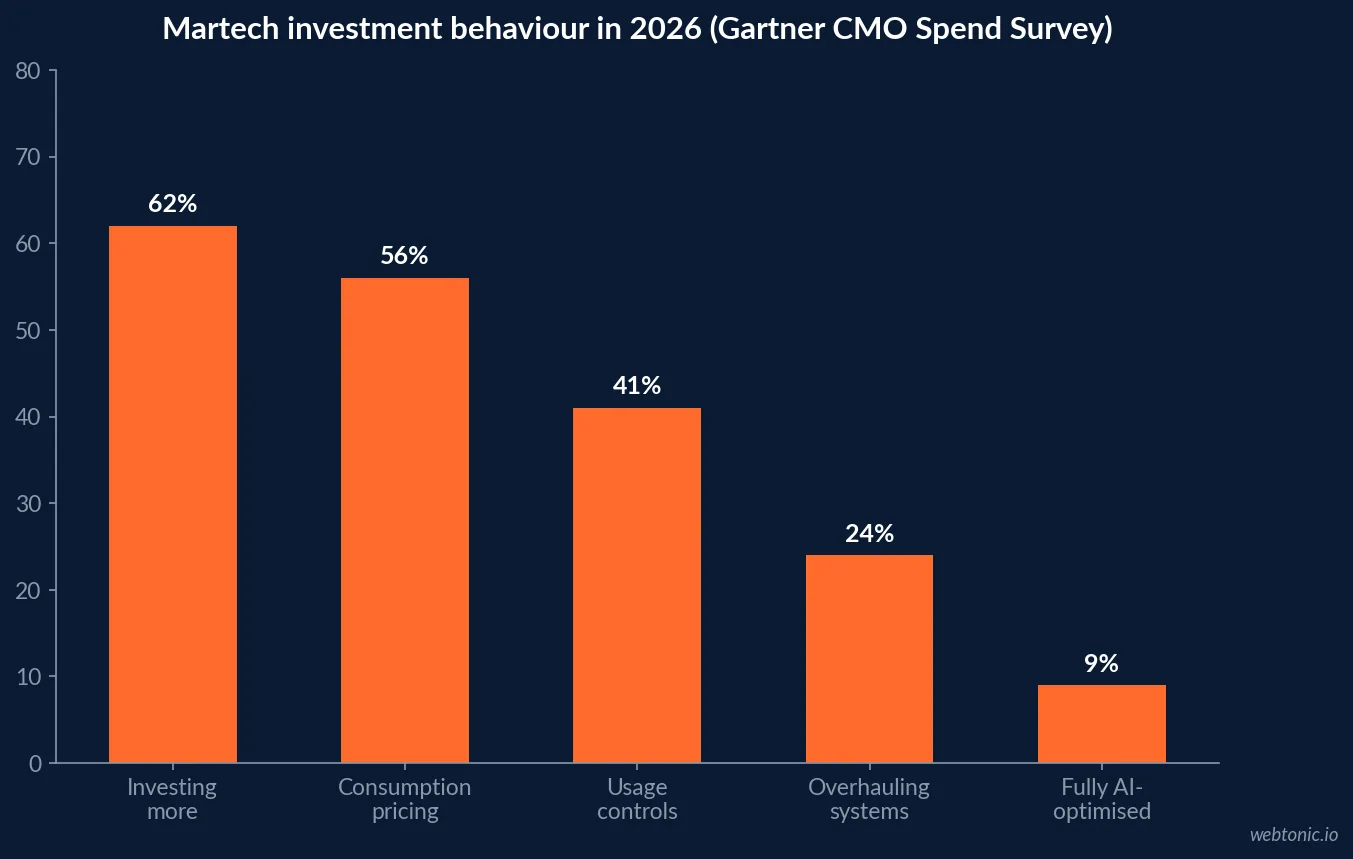
Gartner's 2026 CMO Spend Survey, as reported by Chief Marketer, puts martech at 19.4% of marketing budget - a five-year low, against 26.6% in 2021 - while 62% of leaders plan to invest more. Those two facts coexist because the buying model changed: 56% are moving to consumption-based pricing against 9% cutting spend, 41% are adding usage controls and 24% are overhauling their systems.
For team design, consumption pricing changes who needs to be accountable. A seat licence is a procurement decision; a consumption contract is an operational one, and it needs someone whose job includes watching the meter every month.
| Tooling measure | 2026 figure | Structural consequence |
|---|---|---|
| Martech share of budget | 19.4% | Justify tools against outcomes, not headcount |
| Martech share in 2021 | 26.6% | The scale of the correction |
| Plan to invest more | 62% | Spend is shifting, not stopping |
| Moving to consumption pricing | 56% | Needs a named monthly owner |
| Adding usage controls | 41% | Governance is becoming a role |
| Overhauling systems | 24% | Project-shaped, not business-as-usual |
| Fully AI-optimised stack | 9% | Most stacks are mid-transition |
Adoption is outrunning capability
The CMO Survey 2026 reports AI's share of marketing activities rising from 13.1% to 24.2% and generative AI from 7.0% to 22.4%, a 220% increase, with 55.9% projected within three years and 41.5% working on generative engine optimisation. Over the same window, training fell to 3.8% of marketing spend from 5.8%.
That is the central tension in 2026 team design. The largest reported barrier is an AI capability gap at 35.7%, ahead of resourcing at 22.3%, architecture at 19.1%, bandwidth at 14.1% and talent at 13.1% - and the line that would close it is the one being cut.
| Adoption measure | Prior reading | 2026 | What it implies for the team |
|---|---|---|---|
| AI share of marketing activities | 13.1% | 24.2% | Name an owner per use case |
| Generative AI share | 7.0% | 22.4% | Fund training before more licences |
| Projected AI share in three years | - | 55.9% | Design roles that survive it |
| Generative engine optimisation work | - | 41.5% | Assign it, do not distribute it |
| Training share of marketing spend | 5.8% | 3.8% | The first line to restore |
Where the tools are actually used
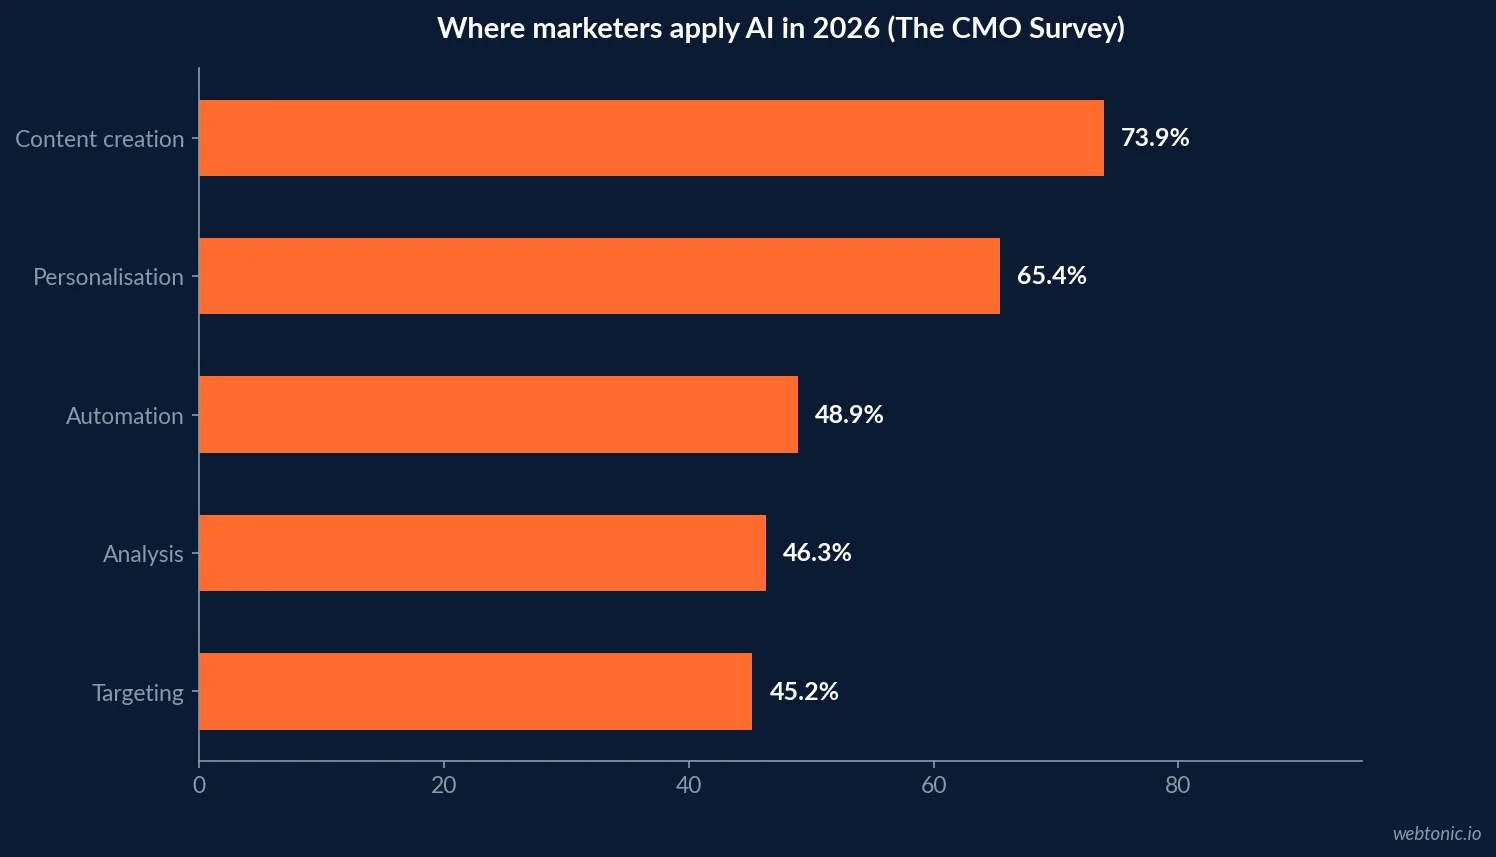
Applications concentrate in production. The CMO Survey ranks them content creation 73.9%, personalisation 65.4%, automation 48.9%, analysis 46.3% and targeting 45.2%. HubSpot's State of Marketing reports 80% of marketers using AI for content and 75% for media production, with 61% calling this the biggest disruption in 20 years.
Production-heavy adoption has a predictable org consequence: output rises before judgement does. If volume grows while the review step stays with the same one or two people, quality control becomes the bottleneck - which is why a creative operations owner is now a structural requirement rather than a nice-to-have in creative production.
| Use case | Share of marketers | Who should own it |
|---|---|---|
| Content creation | 73.9% | Content lead, with a review gate |
| Personalisation | 65.4% | Lifecycle or CRM owner |
| Automation | 48.9% | Marketing operations |
| Analysis | 46.3% | Measurement owner |
| Targeting | 45.2% | Channel owner |
Buying is easy; proving return is not
On the CMO Survey's 1-to-7 self-rating scale, marketers rate vendor selection 4.9, tactical use of data 4.8, systems integration 4.8, generating technology ROI 4.5, demonstrating that ROI 4.2, training 3.9 and hiring the right people 3.7. No capability scores above 5, and the ratings are flat against 2024.
The shape of that list matters more than any single score. The strongest capability is buying and the weakest are proving and enabling, which is precisely the failure pattern that produces a large stack with a contested business case - the gap our data intelligence practice exists to close.
| Capability | Self-rating out of 7 | Tooling consequence |
|---|---|---|
| Selecting vendors | 4.9 | Procurement is not the constraint |
| Using data tactically | 4.8 | Analysis exists; decisions lag |
| Integrating systems | 4.8 | Budget reconciliation work |
| Generating technology ROI | 4.5 | Return is real but unproven |
| Demonstrating that ROI | 4.2 | Fill the measurement seat first |
| Training people | 3.9 | Underfunded at 3.8% of spend |
| Hiring the right people | 3.7 | Rent new capability first |
Governance is the cheapest structural fix
The Content Marketing Institute's 2026 B2B research reports 97% of organisations having a content strategy, with challenges ranked prompting action 40%, resources 39%, measurement 33%, quality content 28% and differentiation 24%, and 52% of top performers describing their governance as mature.
Governance here means something small and specific: one named owner per system, one place where the numbers live, one review rhythm. It costs nothing in licences and it is the only intervention that addresses measurement at 33% and architecture at 19.1% at the same time.

Consumption pricing needs a different owner
With 56% shifting to consumption-based pricing and 41% adding usage controls, tool cost has become variable in a way headcount is not. That converts a once-a-year procurement task into a monthly operational one, and it is why 24% overhauling their systems is best treated as a project with an owner rather than absorbed into business as usual.
The org design implication is narrow but real: someone must be accountable for consumption against outcome, monthly, with authority to turn things off. Without that, usage controls exist on paper only.
| Pricing shift | 2026 figure | Ownership needed |
|---|---|---|
| Consumption-based pricing | 56% | Monthly usage-versus-outcome review |
| Usage controls | 41% | Authority to throttle or switch off |
| System overhaul | 24% | Named project owner and end date |
| Cutting technology spend | 9% | Decommissioning plan |
| Fully AI-optimised stack | 9% | Documented target state |
What to fund before the next licence
Three things, in order. Restore some of the training line at 3.8% of spend, because the top barrier is a 35.7% capability gap. Name an owner for each of the five main use cases, from content at 73.9% down to targeting at 45.2%. Then fix the measurement seat, since demonstrating technology ROI self-rates 4.2.
None of those three is a purchase. All three are why martech at 19.4% of budget can fall while 62% still intend to invest more: the constraint has moved from tools to the people and rhythms around them, the same lesson visible in how teams manage search programmes.
External teams absorbed the tooling first
RSW/US's 2026 New Year Outlook reports that roughly 61% of external agencies used generative AI in 2025 against 17% of in-house agencies, while 60% of client-side firms now have some in-house agency capability, up from 40% a year earlier and 66% keep at least 26% of the work inside.
Internal capability is growing fast, but the new tooling landed outside first. For a team plan that means the quickest route to a capability you do not have is usually to rent it for a quarter, document how it works, and then bring the documented version in-house - rather than buying licences and hoping adoption follows.
| Adoption signal | External | In-house | Sequencing implication |
|---|---|---|---|
| Generative AI use in 2025 | About 61% | 17% | Rent the capability, then internalise |
| In-house agency capability | - | 60% of firms | Internal build-out is already funded |
| Work kept inside | - | 66% keep 26%+ | The core stays internal |
| Digital activity delivered outside | 33.6% | 66.4% | Tooling must serve both sides |
A twelve-month adoption sequence
Quarter one: inventory the stack, name one owner per system, and record what each is meant to move - unglamorous work that addresses architecture at 19.1%. Quarter two: fund training against the 35.7% capability gap and pick two use cases to standardise. Quarter three: instrument the outcomes, since 33% name measurement as a top challenge. Quarter four: decide what to decommission before renewal, given 41% adding usage controls.
Sequenced that way, adoption stops being a purchasing cycle and becomes a capability plan. If you want a second pair of eyes on the stack and who owns what, send us the current inventory - or read how we think about budgeting variable channel spend, which has the same discipline problem.
Related reading
- Marketing Team Structure Statistics: Hiring vs Outsourcing
- Marketing Audit Statistics: Adoption and Tooling
- Marketing Team Structure Statistics: Cost and Pricing
- Marketing Strategy Consulting services at Web Tonic
Frequently Asked Questions
How much of a marketing budget goes to tools in 2026?
Less than it used to. Gartner's 2026 CMO Spend Survey, reported by Chief Marketer, puts martech at 19.4% of marketing budget - a five-year low, down from 26.6% in 2021 - even though 62% of leaders plan to invest more. The reconciliation is pricing: 56% are moving to consumption-based pricing against 9% cutting spend, 41% are adding usage controls and 24% are overhauling their systems.
How quickly is AI being adopted inside marketing teams?
Faster than the training budget. The CMO Survey 2026 reports AI's share of marketing activities rising from 13.1% to 24.2% and generative AI from 7.0% to 22.4%, a 220% increase in a year, with 55.9% projected within three years and 41.5% already working on generative engine optimisation. Over the same period training fell to 3.8% of marketing spend from 5.8%.
Where is AI actually used in marketing work?
Concentrated in production and personalisation. The CMO Survey ranks applications as content creation 73.9%, personalisation 65.4%, automation 48.9%, analysis 46.3% and targeting 45.2%. HubSpot's State of Marketing reports 80% of marketers using AI for content and 75% for media production, with 61% calling this marketing's biggest disruption in 20 years.
What blocks tool adoption in a marketing team?
Capability, not licences. The CMO Survey ranks barriers as AI capability gaps 35.7%, resourcing 22.3%, data and system architecture 19.1%, bandwidth 14.1% and talent 13.1%. On its 1-to-7 self-rating scale, selecting vendors scores 4.9 while demonstrating technology ROI scores 4.2 and training 3.9, and no capability scores above 5. Teams are better at buying tools than at proving they paid off.
Who should own a marketing tool?
One named person per system, with the reporting owner separate from the buyer. That structure is what the data argues for: architecture blocks 19.1% of teams, demonstrating technology ROI self-rates 4.2 of 7, and the Content Marketing Institute reports only 52% of top-performing organisations describing their governance as mature while 33% name measurement as a top challenge. Unowned tools become unmeasured tools.
Sources
Chief Marketer - Gartner 2026 CMO Spend Survey coverage
The CMO Survey - Highlights and Insights Report 2026
HubSpot - State of Marketing
RSW/US - 2026 New Year Outlook Report
Content Marketing Institute - B2B Content Marketing Trends 2026


