Table of contents

Structure advice is measurable, but not on the timeline most people use. Judge it in five layers, each of which moves at a different speed, and refuse to read the slowest layer at day 30.
Key Takeaways
- Five layers, in order of how fast they move: clarity, capacity, throughput, quality of hire, and revenue efficiency. Only the first two are readable inside 90 days.
- Capacity is the earliest hard number. Healthy in-house utilisation is benchmarked at 65–80%; a shift from 50% to 70% productive time is worth roughly a third of a headcount per person.
- Quality of hire cannot be graded before ramp completes: median time to full productivity is 4.7 months, and 6.8 months for senior demand-gen and product-marketing roles.
- Revenue efficiency is the last layer to move. B2B leaders anchor ROI on pipeline contribution (62%), lifetime value (49%) and efficiency (41%) rather than activity.
- Size the denominator honestly. Fully loaded cost per marketer benchmarks at $180K–$420K, median $294K, so revenue per marketing employee is the cleanest structural ratio.
- Keep the scorecard small: 3–5 strategic metrics reviewed monthly or quarterly, with 8–15 operational metrics per channel underneath for the owners.
- Four reporting errors flatter a bad structure: measuring activity, re-baselining silently, crediting seasonality, and grading a hire before ramp ends.
Why a single number cannot grade a structure decision
Structure work changes who owns what, how decisions get made and how many productive hours exist. Those changes reach revenue eventually, but through several intermediate steps — and each step has its own lag. If you grade the engagement on pipeline at day 45, you are grading last quarter's campaigns with a new org chart attached.
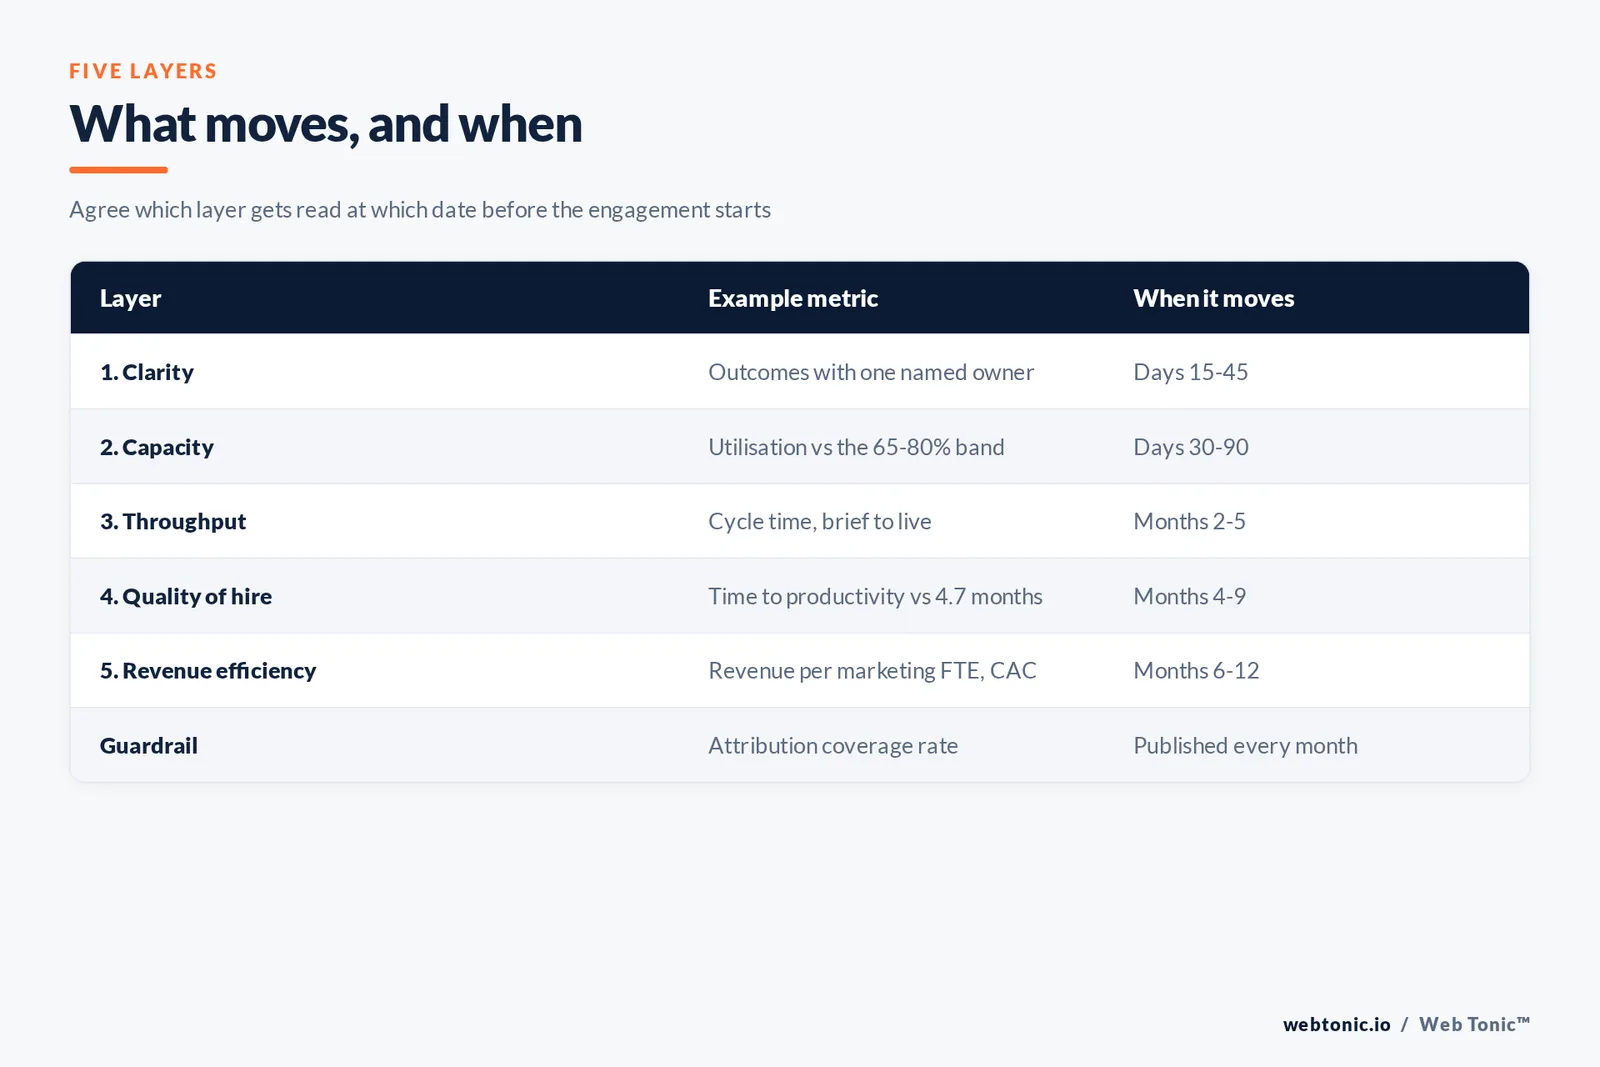
The layered approach also protects against the opposite error: declaring victory on clarity. A tidy org chart with named owners is a real deliverable, but it is the input to performance, not the proof of it. The measurement job is to hold both facts at once, which means agreeing before the engagement starts which layer will be read at which date.
| Layer | What it measures | Example metric | When it moves |
|---|---|---|---|
| 1. Clarity | Ownership and decision rights | % of outcomes with one named owner | Days 15–45 |
| 2. Capacity | Productive hours recovered | Utilisation vs the 65–80% band | Days 30–90 |
| 3. Throughput | Work shipped per cycle | Campaigns or assets live per month, cycle time | Months 2–5 |
| 4. Quality of hire | Whether the sequenced seats worked | Time to productivity vs 4.7-month median | Months 4–9 |
| 5. Revenue efficiency | Output per unit of cost | Revenue per marketing FTE, CAC, pipeline coverage | Months 6–12 |
Layer 1 and 2: clarity and capacity, the fast reads
Clarity is measurable without new tooling. Count the outcomes on the plan, count how many have exactly one accountable owner, and count how many decisions still route through the founder or CEO because nobody else may make them. A structure engagement that ends with two owners for one number has not finished.
Capacity is the first hard number, and it is the one most teams have never measured. A 2026 utilisation and velocity model puts the healthy target for enterprise in-house marketing teams at 70–80%: below that, capacity leaks into non-productive activity; above it, there is no slack for an urgent request or a sick day. Capacity forecasting guidance puts the healthy band for most in-house roles at 65–75%. The reason this matters commercially: moving a five-person team from 50% to 70% productive time recovers roughly one full person of capacity without a hire — and at a benchmarked $294K fully loaded cost per marketer, that is the size of the prize.
Layer 3: throughput, measured as cycle time not volume
Throughput is where structure work becomes visible to the rest of the business, and where the wrong metric does the most damage. Volume metrics — assets published, emails sent, campaigns launched — rise whenever a team is anxious. Cycle time is harder to fake: how long from brief to live, how many approval hops, how much rework.
Keep the set small. A 2026 KPI reference is explicit about the layering: 3–5 strategic KPIs for board and CMO level reviewed monthly or quarterly, with 8–15 operational KPIs per channel reviewed weekly by the owners. A structure engagement should produce exactly that shape — if the new reporting pack has 40 numbers on page one, the structure has not resolved accountability, it has documented it.
Throughput readings also need a stable baseline. Revenue marketing benchmark guidance suggests starting a transformation with four measures only: marketing-sourced pipeline, MQL-to-SAL conversion, attribution coverage rate, and alignment meeting attendance. Attribution coverage is the underrated one — it tells you how much of the result you can even see before you start crediting the reorganisation for it.
Layer 4: quality of hire, the layer people grade too early
If the engagement produced a hiring sequence, that sequence is a testable prediction. But the test cannot run early. B2B org benchmarks put median time to full productivity at 4.7 months for a marketing specialist and 6.8 months for senior demand generation and product marketing roles, on top of a hiring cycle that typically runs 60–120 days. A seat approved in month three is therefore not gradeable until month eight or nine.
What is gradeable earlier is the mandate quality. Scorecard guidance for VP-level marketing roles sets a usable cadence: marketing-sourced pipeline and CAC or channel ROI monthly, MQL-to-opportunity conversion and funnel trends quarterly. If a newly designed seat cannot be described with three to five measures on that cadence, the design is incomplete regardless of who fills it.
| Reporting error | How it shows up | Correction |
|---|---|---|
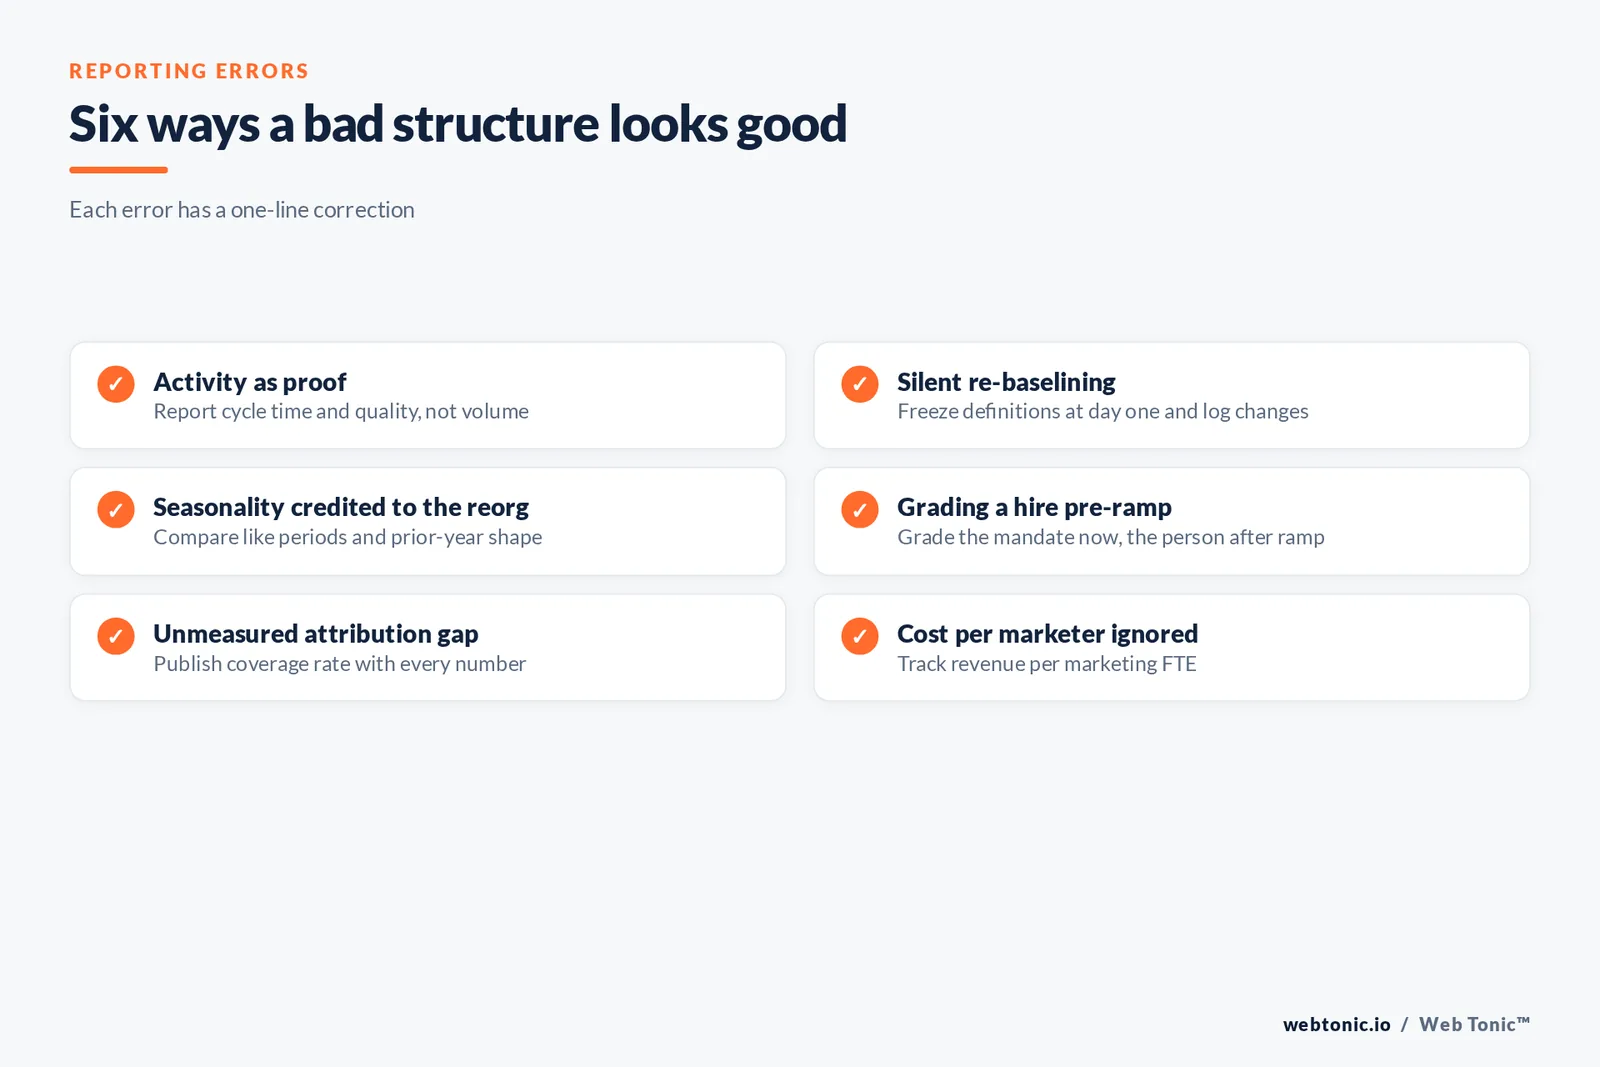
| Activity as proof | Assets and campaign counts rise, pipeline flat | Report cycle time and output quality alongside volume |
| Silent re-baselining | Definitions of MQL or "sourced" change mid-engagement | Freeze definitions at day 1 and log any change |
| Seasonality credited to the reorg | Q4 lift read as a structure win | Compare like periods and prior-year shape |
| Grading a hire pre-ramp | Month-3 verdict on a 4.7-month ramp | Grade the mandate now, the person after ramp |
| Unmeasured attribution gap | Only tracked channels appear to work | Publish attribution coverage rate with every number |
| Cost per marketer ignored | Output up, efficiency down after two hires | Track revenue per marketing FTE, not output alone |
Layer 5: revenue efficiency, the layer the board cares about
The final layer asks whether the same money now produces more. The cleanest structural ratio is revenue per marketing employee, which CMO efficiency benchmarking guidance recommends as a starting point for sizing a team, with the caveat that industry, company size and channel mix all shift it. Pair it with a cost denominator you can defend: 2026 headcount benchmarks put fully loaded cost per marketer at $180K–$420K with a $294K median, and median headcount at 3 marketers for $1–10M revenue rising to 62 above $250M.
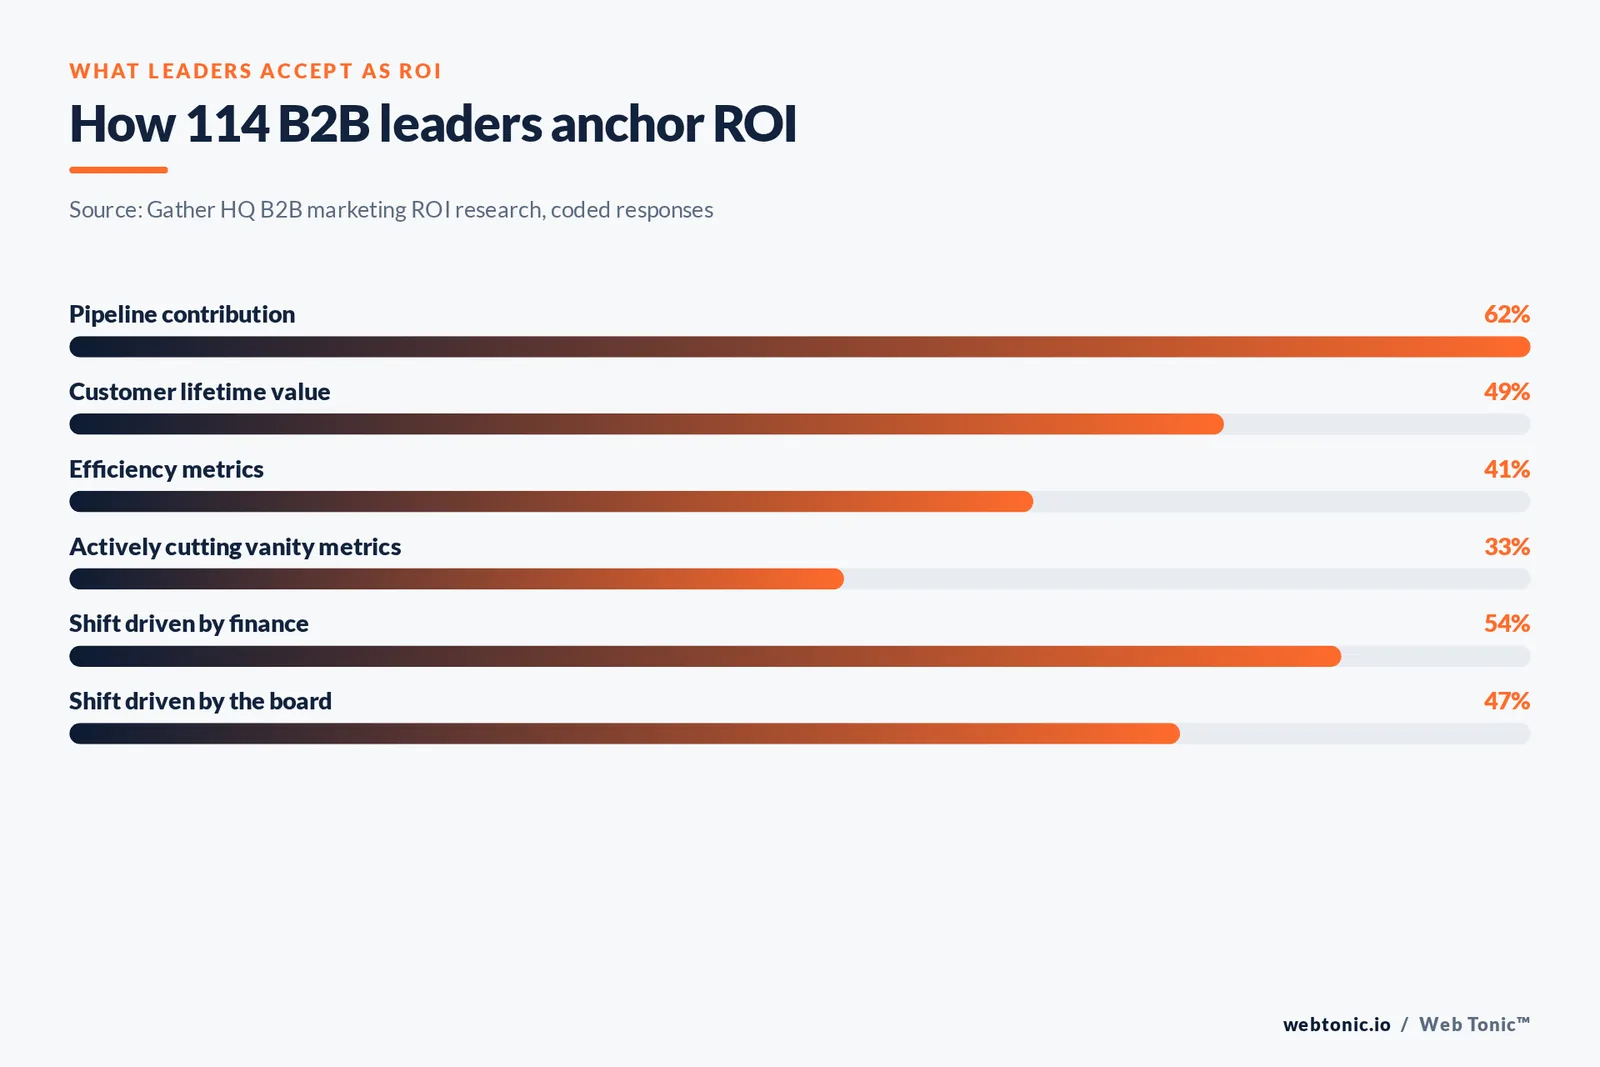
What executives actually accept as evidence is narrower than most reporting packs assume. Research coding how 114 B2B marketing leaders define ROI found pipeline contribution named by 62%, lifetime value by 49% and efficiency metrics by 41%, with 33% actively cutting vanity metrics; the finance and board audiences drove that shift in 54% and 47% of cases respectively. 2026 measurement guidance pushes the same direction with incremental ROAS from experiments and blended CAC by segment, reported with confidence levels, replacing the old channel-ROAS table.
Structural indices exist too, and they are sobering. The 2026 Revenue Marketing Index reports a composite falling from 47 to 45, with capability scored at 42 — useful context when a single quarter's improvement looks too good against peers.
What each review should actually contain
Measurement fails as often through packaging as through metric choice. The monthly review should fit on one page: the layer being read this month, its number, the comparison period, the definition, and the decision it supports. Anything that does not support a decision belongs in an appendix nobody has to read aloud.
Three practical rules keep the pack honest. First, every number carries its coverage: if the 2026 attribution data is right that the dark-funnel gap averages 38% of B2B pipeline, a report that implies full visibility is misleading before the first metric. Second, every comparison names its base period explicitly, because month-over-month in marketing is mostly seasonality. Third, every metric names its owner — the same person who holds it on the new org chart, which is how the measurement layer tests the structure layer rather than replacing it.
Cadence matters as much as content. 2026 reporting research on how teams optimise performance found priorities have shifted decisively toward quality, revenue impact and efficiency measures rather than reach and volume — which only works if the review rhythm is frequent enough to act on and slow enough to be real. Weekly for operational owners, monthly for leadership, quarterly for the structural ratios is the pattern that survives contact with a real calendar.
Using external benchmarks without fooling yourself
Benchmarks are useful for sizing questions and dangerous for grading. Two teams with identical headcount and identical revenue per marketer can be structured completely differently, and published medians hide the arrangement that produced them. Structure guidance for 2026 makes the sequencing point that matters here: a wrong second or third hire creates problems that take years to unwind, and no benchmark table will surface that, because the headcount looks correct on paper.
Use external numbers for three jobs only: sanity-checking whether a proposed team size is unusual for your revenue band, pricing the cost of a seat before approving it, and setting expectations on lag — a 4.7-month median ramp is a planning input, not a target to beat. For everything else, your own frozen baseline is the better comparison, because it shares your market, your product and your sales motion. The single most valuable measurement asset a structure engagement can leave behind is a baseline nobody argues about.
How Web Tonic reports it
We fix the measurement contract before the work starts: which five layers, which metric per layer, which date each one gets read, and which definitions are frozen. Capacity gets measured, not asserted. Attribution coverage is published next to every performance number so the reader knows how much of the picture is visible. Hires get graded after ramp, and the mandate gets graded immediately. Where a layer is not yet readable, we say so in the report rather than substituting a proxy — that discipline is why our scorecard advisory work and our data intelligence practice share the same definitions, and why a client can hand the same pack to a CFO without a translation layer.

Frequently Asked Questions
What can honestly be measured at day 90?
Clarity and capacity. You can show every outcome with one named owner, a measured utilisation figure against the 65–80% healthy band, and a shortened decision path. Throughput often shows early signs; revenue efficiency does not, and claiming it does is the most common reporting error.
Is revenue per marketing employee a fair metric?
It is the cleanest single structural ratio, but only as a trend against your own baseline. Benchmarking guidance treats it as a sizing starting point, since industry, company size and channel mix all move it. Use it alongside CAC and pipeline contribution rather than alone.
How many metrics should the new scorecard carry?
Three to five strategic measures reviewed monthly or quarterly, plus 8–15 operational metrics per channel held by the owners. If leadership reviews 30 numbers, ownership is still unresolved.
How do we stop the reorg getting credit for seasonality?
Freeze definitions at day one, compare like periods rather than consecutive months, and check the prior-year shape of the same window. If the lift matches last year's seasonal curve, the structure has not been tested yet.
What if attribution is too weak to measure anything?
Then measurement is the first project, not the fifth. Report attribution coverage rate explicitly, use the four starter measures — sourced pipeline, MQL-to-SAL conversion, coverage rate and alignment cadence — and rebuild the tracking layer before grading the structure on revenue.
Sources
Pedowitz utilisation and velocity model · Pedowitz capacity forecasting · Pedowitz revenue marketing benchmarks · Revenue Marketing Index 2026 · Digital Applied 2026 KPI reference · Digital Applied headcount benchmarks · Starr Conspiracy B2B org benchmarks · JRG Partners VP marketing scorecards · CMO guide to benchmarking marketing efficiency · Gather HQ B2B marketing ROI research · GA Connector measurement frameworks · HubSpot 2026 performance metrics research · Improvado marketing team structure guide · Digital Applied attribution statistics 2026. More on our approach: Web Tonic blog.