



Table of contents

Marketers rate their ability to demonstrate technology ROI at 4.2 out of 7, and data architecture blocks 19.1% of teams. That is the market marketing operations and RevOps consulting sells into. Here are the published 2026 benchmarks that make such an engagement measurable.
Key Takeaways
- Demonstrating technology ROI self-rates 4.2 out of 7; generating it 4.5.
- Systems integration self-rates 4.8 and no capability scores above 5.
- Data and system architecture is a barrier for 19.1% of marketers.
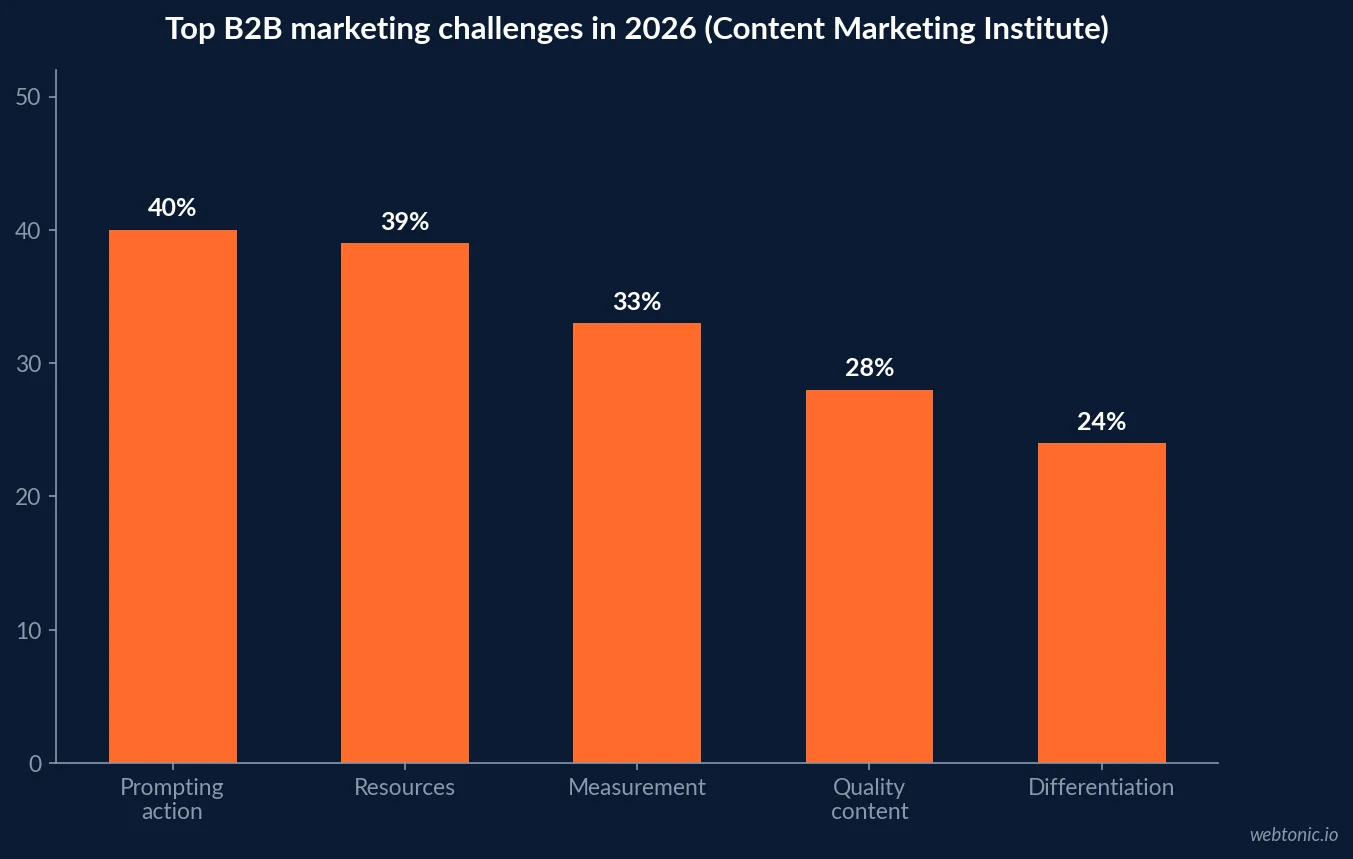
- Measurement is a top content challenge for 33% of B2B organisations.
- Prompting action leads the challenge list at 40%, resources at 39%.
- Only 52% of top-performing organisations call their governance mature.
- Martech is 19.4% of marketing budget, down from 26.6% in 2021.
- 56% are shifting to consumption-based pricing and 41% adding usage controls.
- 24% are overhauling their marketing systems; only 9% call the stack fully AI-optimised.
- Median CAC payback is 16 months, improved from 18.
- The strong quartile recovers CAC in 10 months, the weak quartile in 24.
- Fastest-growing companies recover CAC in 10 months against 18 for the rest.
- 33.6% of digital marketing activity is delivered externally.
- Global management consulting is USD 1,111.35 billion in 2026.
The problem the function exists to solve
The CMO Survey 2026 asks marketers to rate their own capabilities on a 1-to-7 scale. They rate vendor selection 4.9, tactical use of data 4.8, systems integration 4.8, generating technology ROI 4.5 and demonstrating that ROI 4.2. No capability scores above 5, and the ratings are flat against 2024.
Read the ranking rather than the scores. Buying is the strongest capability and proving is the weakest, which is exactly the condition in which a stack grows and confidence in its numbers does not. Marketing operations work is the correction to that asymmetry.
| Capability | Self-rating out of 7 | What a RevOps engagement changes |
|---|---|---|
| Selecting vendors | 4.9 | Nothing - this is not the gap |
| Using data tactically | 4.8 | Shortens time from report to decision |
| Integrating systems | 4.8 | Removes manual reconciliation |
| Generating technology ROI | 4.5 | Ties each tool to one outcome |
| Demonstrating that ROI | 4.2 | The primary deliverable |
| Training people | 3.9 | Documentation and enablement |
Architecture is a top-three barrier
The same survey ranks reported barriers as AI capability gaps 35.7%, resourcing 22.3%, data and system architecture 19.1%, bandwidth 14.1% and talent 13.1%. Architecture outranks both bandwidth and talent, which is the quantitative case for treating operations as a discipline rather than an overhead.
It also explains why adding marketers rarely fixes reporting. If the pipes are wrong, more hands produce more versions of the same disputed number - the failure mode our data intelligence practice is built around.
| Barrier | Share of marketers | Operations response |
|---|---|---|
| AI capability gaps | 35.7% | Standardise a few use cases, then train |
| Resourcing | 22.3% | Automate the reconciliation work |
| Data and system architecture | 19.1% | The core scope of the engagement |
| Bandwidth | 14.1% | Remove manual reporting cycles |
| Talent | 13.1% | Document processes so they survive turnover |
Measurement is where content strategy stalls
The Content Marketing Institute's 2026 B2B research reports 97% of organisations having a content strategy, with challenges ranked prompting action 40%, resources 39%, measurement 33%, quality content 28%, differentiation 24%, the buyer journey 23%, collaboration 21%, audience needs 20% and the plan itself 16%. Only 52% of top performers describe their governance as mature.
Three of the top four - prompting action, resources and measurement - are operational rather than creative. That is the practical argument for sequencing an operations fix before a content or channel investment: without it, the same content produces the same unprovable result.
| Challenge | Share of organisations | Operational or creative |
|---|---|---|
| Prompting action | 40% | Operational - offers and routing |
| Lack of resources | 39% | Operational - process and automation |
| Measurement | 33% | Operational - definitions and tracking |
| Quality content | 28% | Creative |
| Differentiation | 24% | Creative and positioning |
| Buyer journey | 23% | Operational - lifecycle mapping |
| Collaboration | 21% | Operational - ownership and cadence |
The stack is being rebuilt under new economics
Gartner's 2026 CMO Spend Survey, via Chief Marketer, puts martech at 19.4% of marketing budget, a five-year low against 26.6% in 2021, with 62% planning to invest more, 56% shifting to consumption-based pricing against 9% cutting spend, 41% adding usage controls, 24% overhauling systems and only 9% describing the stack as fully AI-optimised.
Consumption pricing turns tool cost into a variable that behaves like media spend, so it needs the same monthly review. That single change is why operations ownership has moved from a back-office concern to a budget-defining one.
| Stack economics | 2026 figure | KPI to attach |
|---|---|---|
| Martech share of budget | 19.4% | Cost per tracked outcome |
| Investing more in technology | 62% | Payback per new system |
| Consumption-based pricing | 56% | Consumption against outcome, monthly |
| Usage controls | 41% | Percentage of spend under a cap |
| System overhaul | 24% | Milestones delivered on date |
| Fully AI-optimised stack | 9% | Documented target state coverage |
The efficiency anchor: CAC payback
Benchmarkit's CY-2025 benchmarks report a median CAC payback of 16 months, improved from 18 - an 11% gain - with the strong quartile at 10 months, the weak quartile at 24 and top performers at six months or less. The fastest-growing companies recover CAC in 10 months against 18 for everyone else.
This is the number a marketing operations engagement should ultimately move, because payback is where tracking quality, routing, lifecycle and spend allocation all show up together. It is also uncomfortable in the right way: it cannot be improved by reporting differently.
Own the function, buy the build
The CMO Survey puts capability emphasis at 59.5% build, 38.5% partner and 1.9% buy, with 33.6% of digital marketing activity delivered externally - agencies 15.5%, consultancies 12.7% and other partners 10.4%. For operations specifically, the split that works follows the shape of the work: cross-system implementation is finite and project-shaped, while stewardship of definitions and reporting is continuous.
So buy the build and own the stewardship. An outsourced build with no internal owner produces a system nobody can defend six months later, which is the most common way operations investment is wasted.
| Operations scope | Own or buy | Published anchor |
|---|---|---|
| Definitions and data governance | Own | 52% of top performers call governance mature |
| System implementation | Buy as a project | 24% are overhauling systems |
| Reporting and attribution build | Buy, then own | Demonstrating ROI rates 4.2 of 7 |
| Automation maintenance | Own | Architecture blocks 19.1% |
| Specialist platform work | Buy | 33.6% of digital delivered externally |
| Consumption monitoring | Own | 56% on consumption pricing |
A KPI set that survives scrutiny
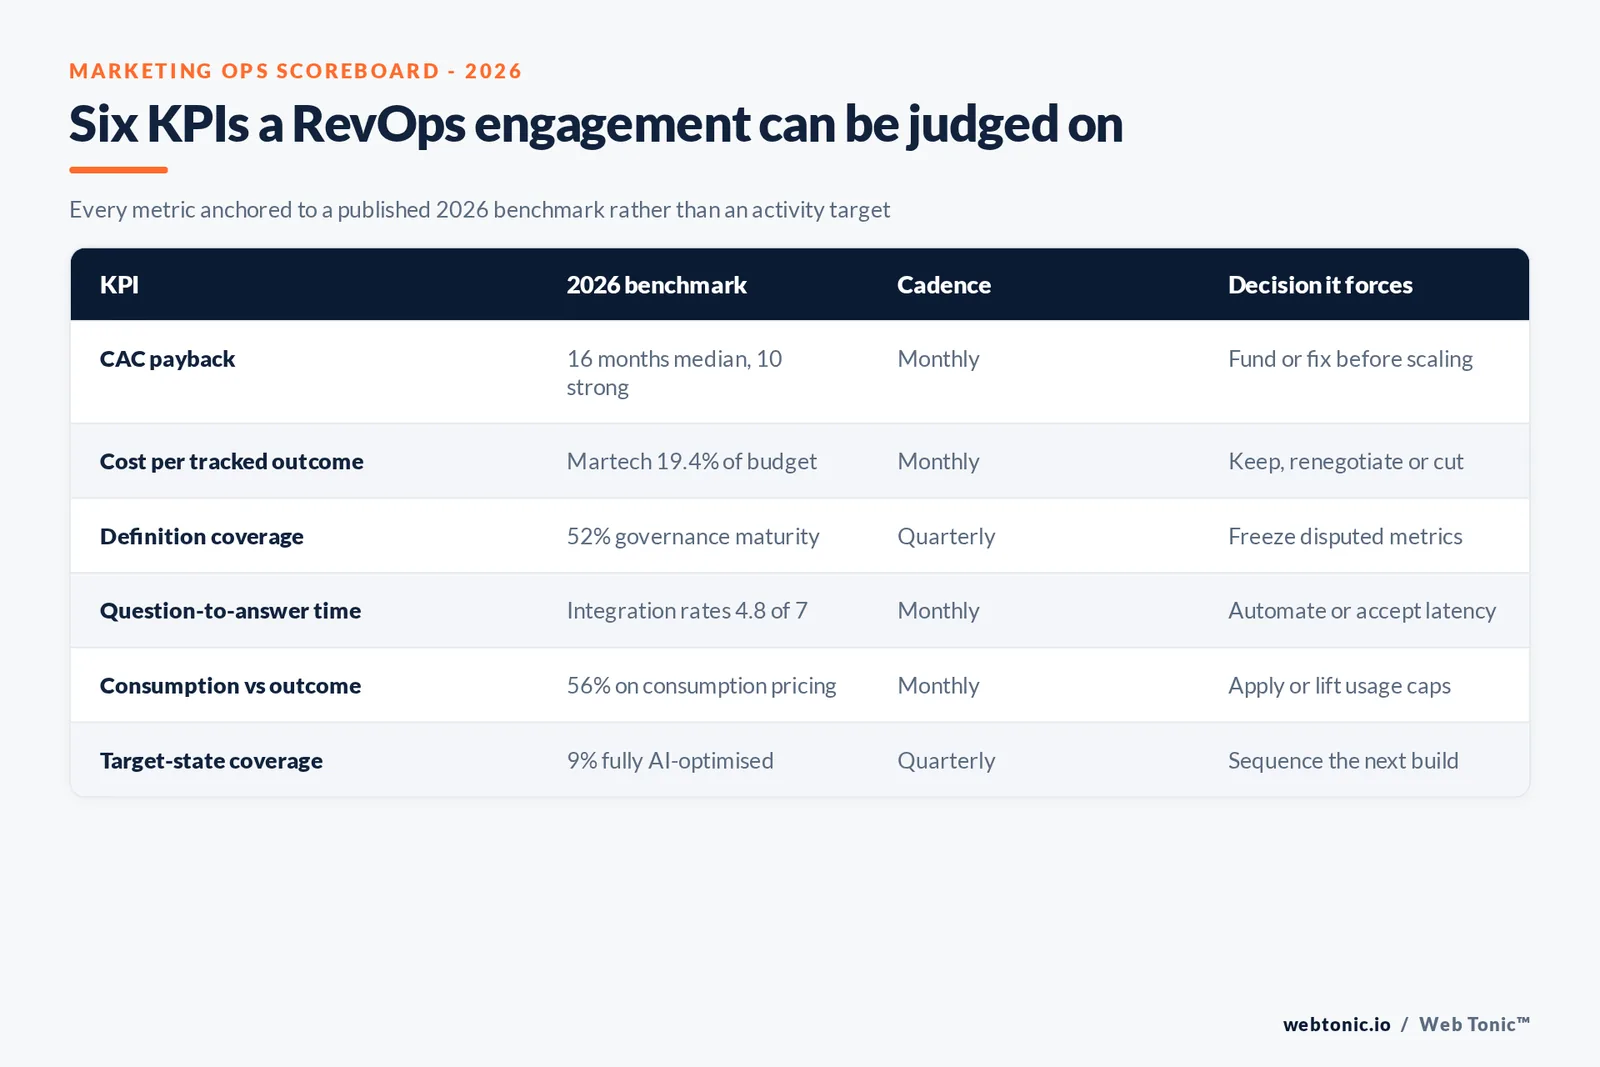
Six metrics cover the function without turning into a dashboard nobody reads: CAC payback against the 16-month median, cost per tracked outcome against martech at 19.4% of budget, the share of reported numbers with an agreed definition, time from question to answer, consumption against outcome for the 56% on usage-based contracts, and coverage of the documented target state where only 9% are fully optimised.
Each has a published comparator, which is the point. Operations KPIs that reference only last quarter's internal figure cannot support a budget argument, whereas benchmarked ones can - the same reasoning behind how we build a measurable search strategy.
| KPI | 2026 benchmark | Cadence | Decision it forces |
|---|---|---|---|
| CAC payback | 16 months median, 10 strong | Monthly | Fund or fix before scaling |
| Cost per tracked outcome | Martech 19.4% of budget | Monthly | Keep, renegotiate or cut a tool |
| Definition coverage | 52% governance maturity | Quarterly | Freeze disputed metrics |
| Time from question to answer | Integration rates 4.8 of 7 | Monthly | Automate or accept latency |
| Consumption against outcome | 56% on consumption pricing | Monthly | Apply or lift usage caps |
| Target-state coverage | 9% fully AI-optimised | Quarterly | Sequence the next build |
What the engagement is worth benchmarking against
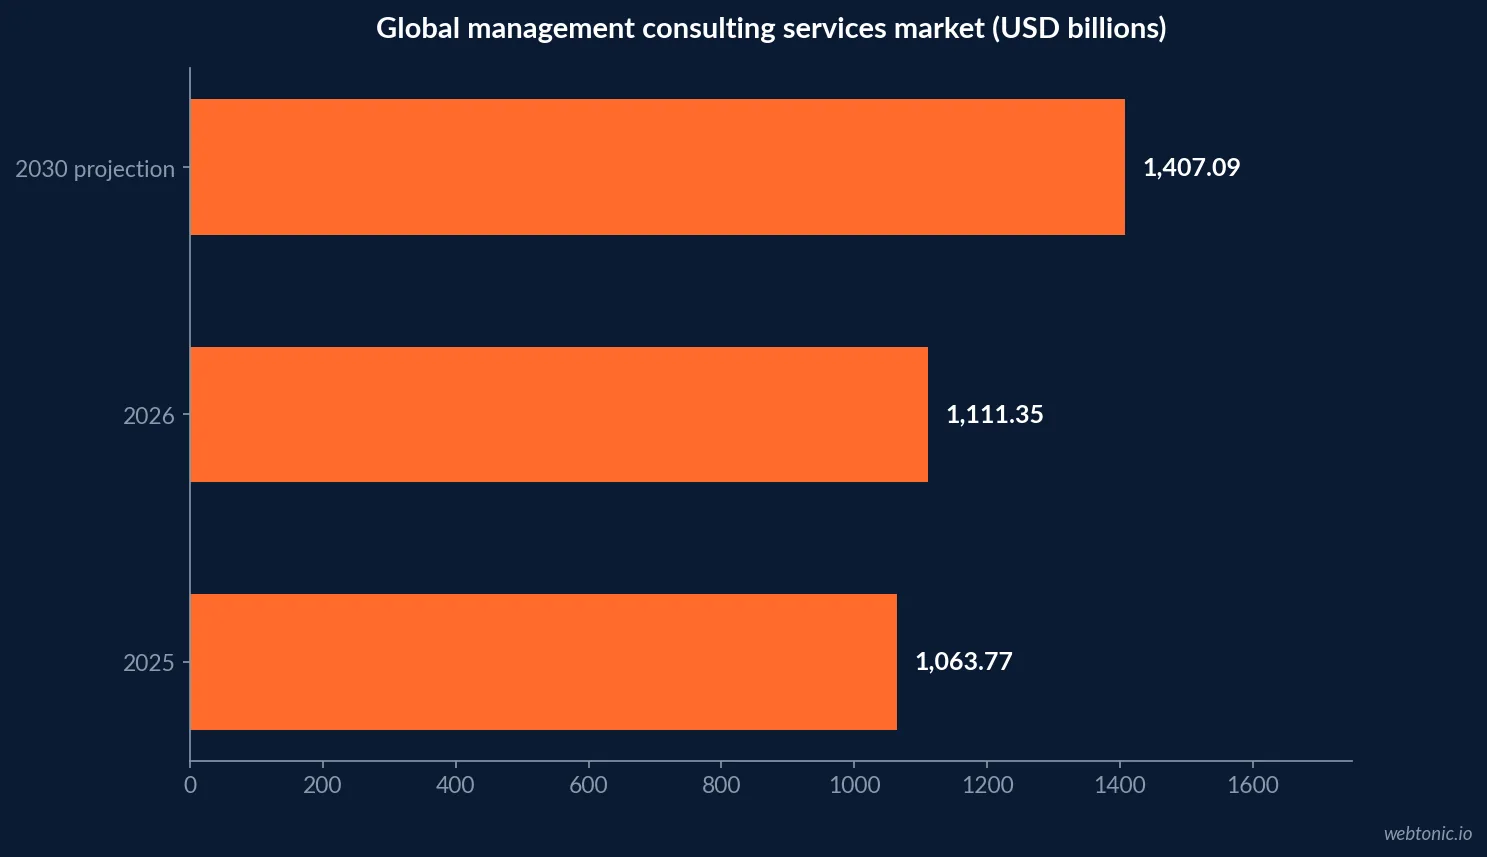
The Business Research Company sizes global management consulting services at USD 1,063.77 billion in 2025, USD 1,111.35 billion in 2026 and USD 1,407.09 billion by 2030. No published study isolates marketing operations or RevOps consulting inside that total, so there is no market rate to quote - a fact worth stating plainly rather than filling with an estimate.
The practical consequence for buyers is simple: benchmark the engagement on the outcome numbers above and on the scope, not on a headline fee. Ask which of the six KPIs the work is expected to move, and by when.
Sequencing a first engagement
Fix the definitions before the dashboards. Agree what a lead, an opportunity and a conversion are, then deduplicate and instrument them - the step that addresses architecture at 19.1% and measurement at 33%. Next, connect spend to outcome so payback can be read against the 16-month median. Only then automate, because automating a disputed process multiplies the dispute.
Staged that way, an operations engagement produces an arguable number within a quarter instead of a platform migration within a year. If you want the sequence applied to your own stack, our growth team can scope it, or send us your current reporting.
Related reading
- Marketing Strategy Consulting Statistics: Benchmarks and KPIs
- Marketing Team Structure Statistics: Benchmarks and KPIs
- Marketing Operations Consulting Statistics: Cost and Pricing
- Marketing Strategy Consulting services at Web Tonic
Frequently Asked Questions
What KPIs should a marketing operations engagement be judged on?
Outcome metrics with published comparators, not ticket counts. Benchmarkit's CY-2025 study gives the efficiency anchor: a median CAC payback of 16 months, improved from 18, with the strong quartile at 10 months and the weak quartile at 24. Pair that with the CMO Survey's self-rated ability to demonstrate technology ROI, at 4.2 out of 7, and with martech at 19.4% of budget per Gartner's 2026 CMO Spend Survey.
How common are broken reporting and attribution?
Common enough to be the norm. The CMO Survey 2026 ranks data and system architecture as a barrier for 19.1% of marketers, with systems integration self-rated 4.8 out of 7 and demonstrating technology ROI 4.2 - no capability scores above 5. The Content Marketing Institute's 2026 B2B research puts measurement among the top challenges at 33%, behind prompting action at 40% and resources at 39%.
How big is the consulting market this work sits in?
The Business Research Company sizes global management consulting services at USD 1,063.77 billion in 2025, rising to USD 1,111.35 billion in 2026 and USD 1,407.09 billion by 2030. Marketing operations and RevOps work is a slice of that, and no published study separates it out - which is why buyers should benchmark engagements on outcomes rather than on a market rate that does not exist.
Should marketing operations be in-house or outsourced?
Own the function, buy the build. The CMO Survey shows capability emphasis at 59.5% build, 38.5% partner and 1.9% buy, with 33.6% of digital marketing activity delivered externally. Cross-system work is project-shaped: Gartner reports 24% of organisations overhauling their systems and 56% shifting to consumption-based pricing, both of which need a permanent internal owner even when the build is external.
What is the first thing a RevOps project should fix?
Whatever makes the numbers disputable. With demonstrating technology ROI self-rated 4.2 of 7, architecture blocking 19.1% of teams and only 9% of stacks described as fully AI-optimised, most engagements find that definitions, deduplication and a single source of reporting are the bottleneck rather than the tooling. Fixing that first is what makes every later optimisation arguable on evidence.
Sources
The CMO Survey - Highlights and Insights Report 2026
Chief Marketer - Gartner 2026 CMO Spend Survey coverage
Content Marketing Institute - B2B Content Marketing Trends 2026
Benchmarkit - CY-2025 B2B SaaS Performance Metrics Benchmarks
The Business Research Company - Management Consulting Services Global Market Report


