



Table of contents

Marketers rate their ability to demonstrate technology ROI at 4.2 out of 7, and measurement is a top challenge for 33% of B2B organisations. A scorecard fixes that only if every line carries a published comparator. Here are the 2026 benchmarks worth putting on one.
Key Takeaways
- Demonstrating technology ROI self-rates 4.2 out of 7; generating it 4.5.
- No marketing capability self-rates above 5 out of 7.
- Measurement is a top content challenge for 33% of B2B organisations.
- Median CAC payback is 16 months, improved from 18.
- The strong quartile recovers CAC in 10 months, the weak quartile in 24.
- Top performers recover CAC in six months or less.
- Median professional services growth is 9.9%, the lowest since 2018.
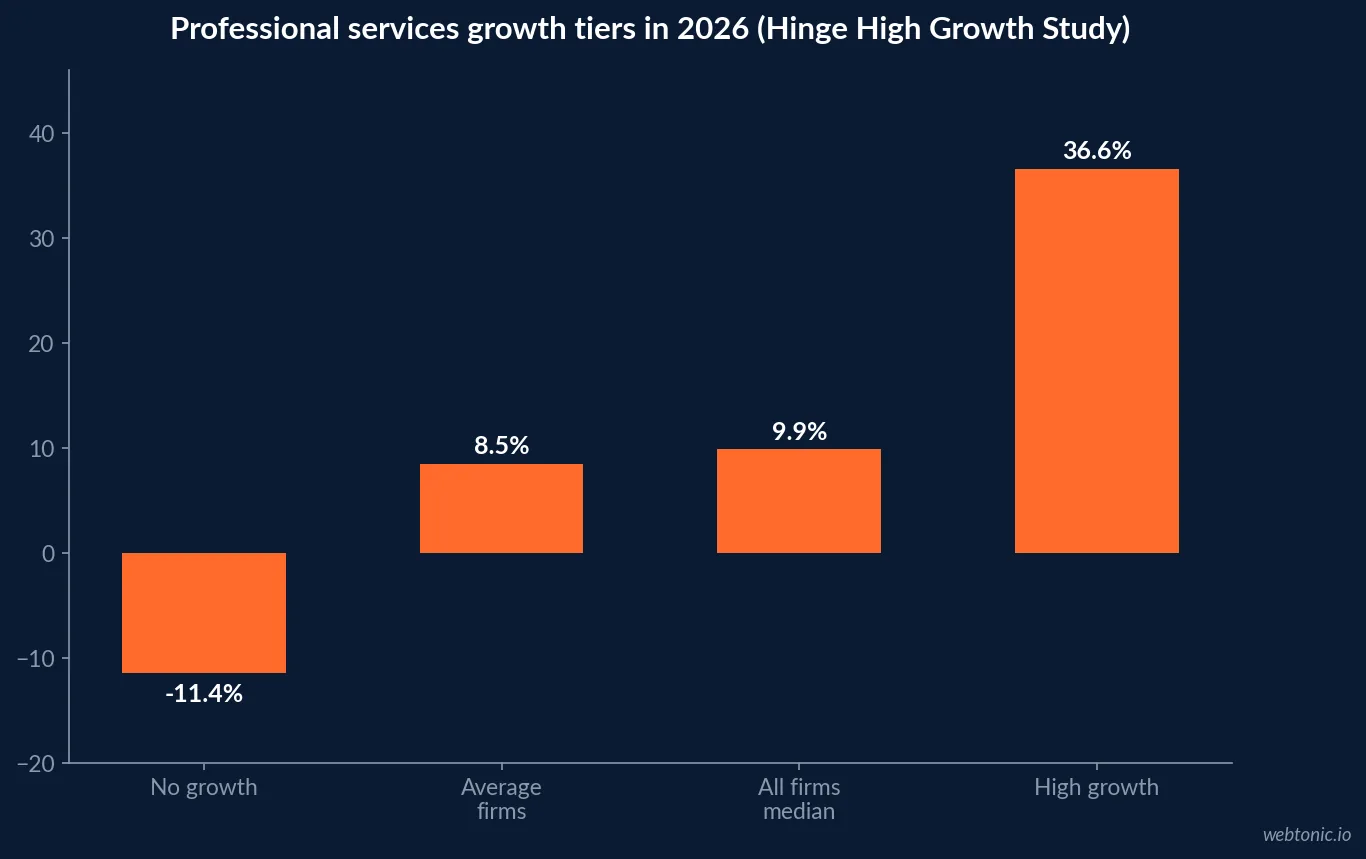
- High-growth firms grow 36.6% against 8.5% average and -11.4% no-growth.
- High-growth firms spend 12.0% of revenue on marketing against 5.0%.
- Referrals supply 39.5% of leads and outreach 23.5%.
- Marketing budgets sit at 9.0% of revenue and 9.6% of firm budgets.
- 71% call agility key while 70.6% report a shift to short-term results.
- Spending splits 68/32 between present and future needs.
- Only 52% of top performers call their governance mature.
- EOS with a professional implementer is associated with 2.8x faster growth.
Why scorecards fail before they are built
The CMO Survey 2026 asks marketers to self-rate on a 1-to-7 scale. They score vendor selection 4.9, tactical use of data 4.8, systems integration 4.8, generating technology ROI 4.5, demonstrating that ROI 4.2, training 3.9 and hiring 3.7. Nothing is above 5, and the scores are flat against 2024.
A scorecard built on top of that gradient inherits it. If the underlying numbers cannot be defended, a weekly meeting reviewing them faster only produces faster disagreement.
| Capability | Self-rating out of 7 | Scorecard consequence |
|---|---|---|
| Selecting vendors | 4.9 | Not the constraint |
| Using data tactically | 4.8 | Numbers exist but arrive late |
| Integrating systems | 4.8 | Reconciliation eats the review slot |
| Generating technology ROI | 4.5 | Value claimed, not shown |
| Demonstrating that ROI | 4.2 | The line most often disputed |
| Training people | 3.9 | Owners cannot maintain their own metric |
The efficiency anchor every scorecard needs
Benchmarkit's CY-2025 benchmarks report a median CAC payback of 16 months, improved from 18 - an 11% gain - with the strong quartile at 10 months, the weak quartile at 24 and top performers at six months or less. The fastest-growing companies recover CAC in 10 months against 18 for the rest.
Payback belongs on the monthly half of the scorecard, not the weekly one. It moves slowly, it cannot be improved by reporting differently, and it is the number that makes every weekly leading indicator worth collecting.
Growth tiers beat a single average
Hinge's 2026 High Growth Study reports median growth of 9.9%, the lowest since 2018, split into high growth 36.6%, average 8.5% and no growth -11.4%, with profitability at 39.5%, 29.6% and 20.3% respectively. High-growth firms spend 12.0% of revenue on marketing against 5.0%.
Comparing a scorecard against the overall median hides which tier you are in. Comparing against all three tiers turns the same table into a decision about which behaviour to copy.
| Tier | Median growth | Profitability | Marketing spend of revenue |
|---|---|---|---|
| High growth | 36.6% | 39.5% | 12.0% |
| Average growth | 8.5% | 29.6% | Not separately reported |
| No growth | -11.4% | 20.3% | 5.0% |
| All firms | 9.9% median | Mixed | Between the two extremes |
Where the pipeline actually comes from
Hinge also reports referrals supplying 39.5% of leads and outreach 23.5%, with 80% of firms running research - competitive research 46.1%, client research 45.2% - and 20% running none. Keyword and SEO research fell from 33.5% to 27.0%, and 16.8% of firms pursued M&A.
If two fifths of leads are referrals, a scorecard dominated by paid-channel metrics is measuring the minority of the pipeline. Source mix belongs on the board before channel detail does.
| Scorecard line | 2026 comparator | Cadence | Decision it forces |
|---|---|---|---|
| CAC payback | 16 months median, 10 strong | Monthly | Fund or fix before scaling |
| Pipeline by source | Referrals 39.5%, outreach 23.5% | Weekly | Rebalance effort by source |
| Marketing spend of revenue | 12.0% high growth vs 5.0% | Quarterly | Raise, hold or reallocate |
| Definition coverage | 52% governance maturity | Quarterly | Freeze disputed metrics |
| Growth rate against tier | 36.6% / 8.5% / -11.4% | Quarterly | Choose which tier to copy |
| Proof of technology ROI | 4.2 of 7 self-rated | Monthly | Keep, renegotiate or cut a tool |
Leading and lagging, split by cadence
A weekly board that carries lagging numbers trains a team to argue about noise. Split them: activity and pipeline movement weekly, efficiency and growth monthly or quarterly. Payback at a 16-month median cannot move in a week, and pretending otherwise is how a review becomes theatre.
The same logic applies to research. Hinge finds 80% of firms running research - though keyword and SEO research fell from 33.5% to 27.0% - and research findings belong on a quarterly rhythm, not a weekly one.
| Cadence | What belongs there | 2026 comparator |
|---|---|---|
| Weekly | Pipeline added by source | Referrals supply 39.5% of leads |
| Weekly | Owner-flagged issues | Governance mature for only 52% |
| Monthly | CAC payback trend | 16-month median, 10 strong |
| Monthly | Proof of technology ROI | Self-rated 4.2 out of 7 |
| Quarterly | Growth against tier | 36.6% / 8.5% / -11.4% |
| Quarterly | Spend as share of revenue | 12.0% high growth vs 5.0% |
Three lines worth retiring
Impressions without a downstream number, engagement rate carried alone when 80% of teams already report it against 63% for business impact, and any metric whose definition is contested while only 52% of top performers call governance mature. None of the three changes a decision, and each one costs review time every week.
Retiring them is not a cosmetic exercise. With measurement a top challenge for 33% of organisations and spend growth at 1.7%, the scarce resource in a review meeting is attention, and shorter boards spend it on the numbers that move money.
| Line to retire | Why it fails the test | Replace it with |
|---|---|---|
| Impressions | No decision attached | Pipeline added by source |
| Engagement rate alone | Reported by 80%, impact by 63% | Engagement paired with an outcome |
| Disputed conversion counts | Only 52% call governance mature | One agreed definition per object |
| Channel-level vanity totals | Hides the 39.5% referral share | Source mix, then channel detail |
Owners, not audiences
Every line needs one person who can explain the movement without opening a second system. That is harder than it sounds when integration self-rates 4.8 of 7 and training was cut to 3.8% of marketing spend, but it is the difference between a scorecard and a slide.
Where a line has no owner, the honest options are to assign one or to remove it. Carrying an unowned metric is how a board ends up with engagement at 80% reporting coverage and business impact at 63% - the measurable gap the channel strategy we publish is designed to close.
The short-termism the scorecard has to resist
The CMO Survey puts spending at a 68/32 split between present and future needs, with 70.6% reporting a shift toward short-term results, 71% calling agility key and 47.1% describing their approach as established. Budgets sit at 9.0% of revenue and 9.6% of firm budgets, with spend growth of 1.7%.
A weekly cadence amplifies whatever it measures. If every line is a short-horizon number, the meeting will keep choosing short-horizon actions, which is how a company arrives at the 68/32 split without ever deciding on it.
Governance decides whether the numbers are believed
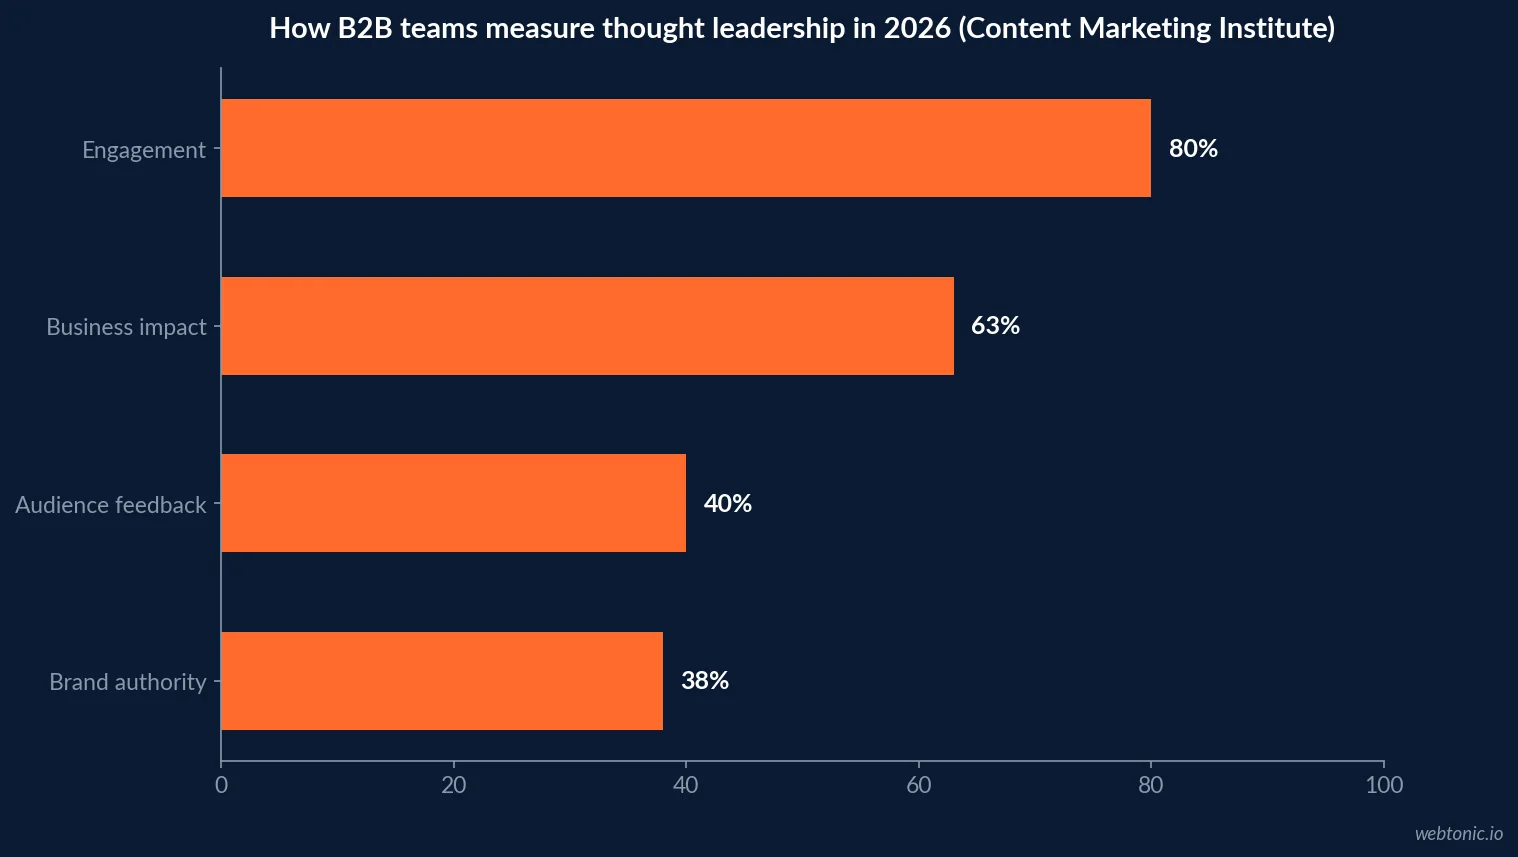
The Content Marketing Institute's 2026 B2B research reports 97% of organisations with a content strategy but only 52% of top performers calling their governance mature, with challenges ranked prompting action 40%, resources 39%, measurement 33%, quality 28% and differentiation 24%. Thought-leadership measurement runs engagement 80%, business impact 63%, feedback 40% and brand authority 38%.
Engagement at 80% against business impact at 63% is the vanity-metric gap in one line. A scorecard is the cheapest place to close it, by refusing to carry an engagement number that is not paired with an outcome - the discipline behind our data intelligence work.

What the operating-system evidence actually says
EOS Worldwide cites TrueSpace and Gallup-validated analysis of 305 companies finding that firms running EOS with a professional implementer grew 2.8 times faster. This is vendor research and should be labelled as such: it supports the value of disciplined cadence, it does not prove one framework beats another.
The defensible claim is narrower and still useful. A fixed weekly meeting, a small number of owned metrics and an explicit issues list are cheap, and the measurement weaknesses in the survey data above are exactly what that structure addresses.
A scorecard that survives a budget challenge
Six lines, each with an owner, a comparator and a decision: pipeline by source against 39.5% referrals, CAC payback against the 16-month median, marketing spend of revenue against 12.0% and 5.0%, definition coverage against 52% governance maturity, growth against the 36.6 / 8.5 / -11.4 tiers, and one proof-of-value line against a self-rating of 4.2 of 7.
Anything that fails the owner-comparator-decision test comes off. If you want that board built against your own numbers, our growth team can assemble it, or send us your current reporting pack.
Related reading
- Fractional CMO Statistics: Benchmarks and KPIs
- Marketing Audit Statistics: Benchmarks and KPIs
- Fractional Head of Growth Statistics: Benchmarks and KPIs
- Marketing Strategy Consulting services at Web Tonic
Frequently Asked Questions
What should a weekly marketing scorecard measure?
A small set of leading numbers with published comparators, reviewed weekly, plus a few lagging ones reviewed monthly. The useful 2026 anchors are median CAC payback of 16 months from Benchmarkit's CY-2025 study, marketing budgets at 9.0% of revenue from The CMO Survey 2026, and marketing spend at 12.0% of revenue among high-growth professional services firms against 5.0% among no-growth firms per Hinge's 2026 High Growth Study.
How many metrics belong on a scorecard?
Few enough that each has an owner and a decision attached. The evidence for restraint is indirect but consistent: The CMO Survey 2026 puts self-rated ability to demonstrate technology ROI at 4.2 out of 7 with no capability above 5, and the Content Marketing Institute's 2026 B2B research shows measurement is a top challenge for 33% of organisations. Adding lines to a dashboard does not fix either.
What growth rate counts as good in 2026?
Hinge's 2026 High Growth Study reports a median growth rate of 9.9%, the lowest since 2018, with high-growth firms at 36.6%, average firms at 8.5% and no-growth firms at -11.4%. Profitability follows the same order at 39.5%, 29.6% and 20.3%. Those three tiers are a fairer scorecard comparator than a single market average.
Does running a formal operating system change results?
The available evidence is vendor research and should be read as such. EOS Worldwide cites TrueSpace and Gallup validated analysis of 305 companies finding that businesses running EOS with a professional implementer grew 2.8 times faster. It is directional support for disciplined cadence, not an independent trial.
How do you stop a scorecard drifting into vanity metrics?
Attach a decision to every line and a comparator to every number. The CMO Survey 2026 finds 71% of marketers calling agility key while 70.6% report a shift toward short-term results and a 68/32 split between present and future spending - conditions in which reporting expands and decisions do not. A line that has not changed a decision in two quarters should be retired.
Sources
The CMO Survey - Highlights and Insights Report 2026
Benchmarkit - CY-2025 B2B SaaS Performance Metrics Benchmarks
Hinge Research Institute - 2026 High Growth Study
Content Marketing Institute - B2B Content Marketing Trends 2026
EOS Worldwide - EOS with a professional implementer grew 2.8x faster


