



Table of contents
A defensible market-share number costs three separate things: a person, a tool tier, and syndicated data. Most budget conversations only price the first two. This page sets out published 2026 rates for all three, plus what actually predicts whether the number gets used once someone has paid for it.
Key Takeaways
- Median market research analyst salary is USD 76,950 a year (BLS, May 2024).
- The middle 50% of analysts earn USD 58,350 to USD 108,310.
- Self-service tool tiers run USD 125 to USD 649 a month per seat.
- Syndicated retail data has no public list price at all.
- Published Nielsen costs run tens of thousands to seven figures a year.
- The global insights industry is expected to reach USD 164.7 billion in 2025 turnover.
- The core market research sector alone is worth USD 60 billion.
- Brand-side teams with budgets over USD 15 million grew from 27% to 40% in a year.
- Teams under USD 1 million in budget fell from 34% to 15% over the same period.
- Competitive-intelligence KPI adoption rose from 30% to 60.5% of programs since 2022.
- Teams that track KPIs report a win rate of 66% versus 24% for those that don't.
- Only 56.7% of programs have an executive sponsor.
- A sponsored program is 2.5 times more likely to hit USD 1 million in revenue impact.
- Weekly-or-faster reporting teams hit revenue impact at 79% versus 41% for monthly-plus.
- Top 50 insights companies hold roughly 50% of global market share.
Why market share is the hardest number to buy honestly
Unlike most marketing metrics, market share cannot be calculated from your own systems. It requires either a third-party panel, point-of-sale data licensed from a retailer network, or a syndicated research provider — and none of those three publish a price list. That opacity is structural, not evasive: Vendr's 2026 Nielsen pricing breakdown notes that costs depend on product suite, geographic coverage, sample size, data granularity, reporting frequency and number of users, with contracts running from tens of thousands of dollars for a basic category report to seven figures for a comprehensive multi-market measurement program.
The budget conversation usually starts and stops at headcount, because headcount is the only line item with a public number attached to it.
| What a market-share number needs | Public price list? | Typical 2026 range |
|---|---|---|
| A person to run and read it | Yes (BLS) | USD 42,070-155,480 a year |
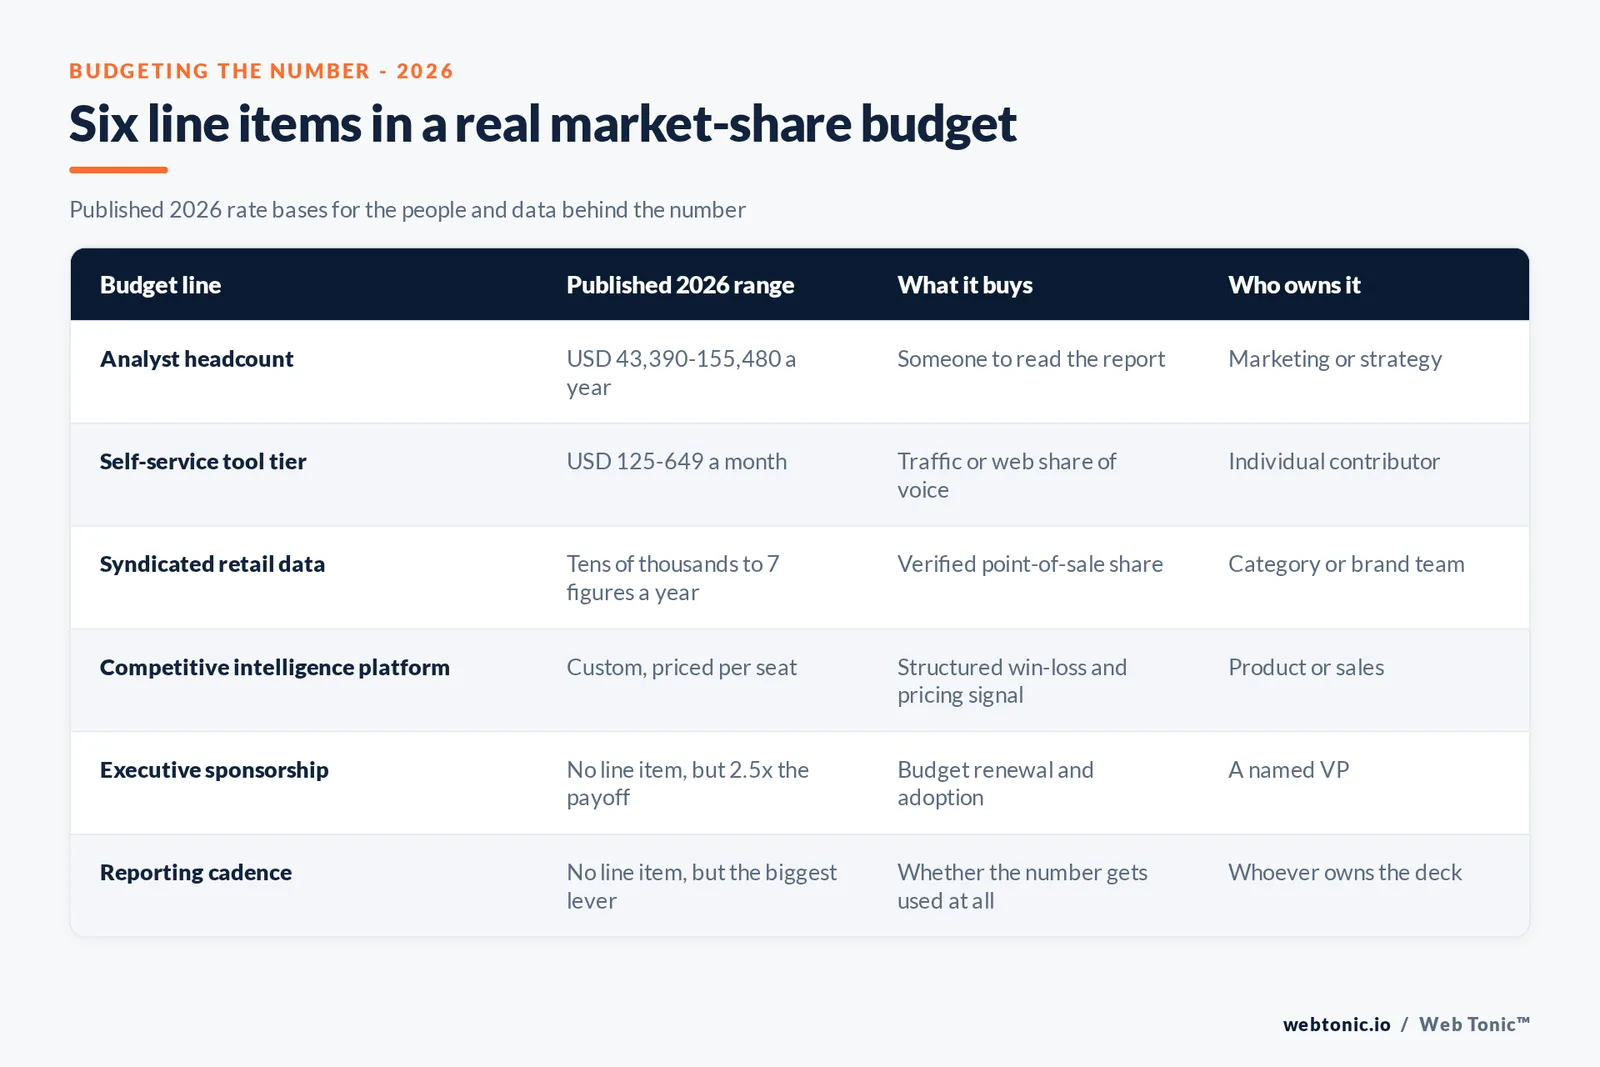
| A self-service digital tool | Yes (vendor sites) | USD 125-649 a month, per seat |
| Syndicated point-of-sale / panel data | No | Tens of thousands to 7 figures a year |
| A competitive intelligence platform | No | Custom, priced per seat and module |
What the analyst behind the number costs
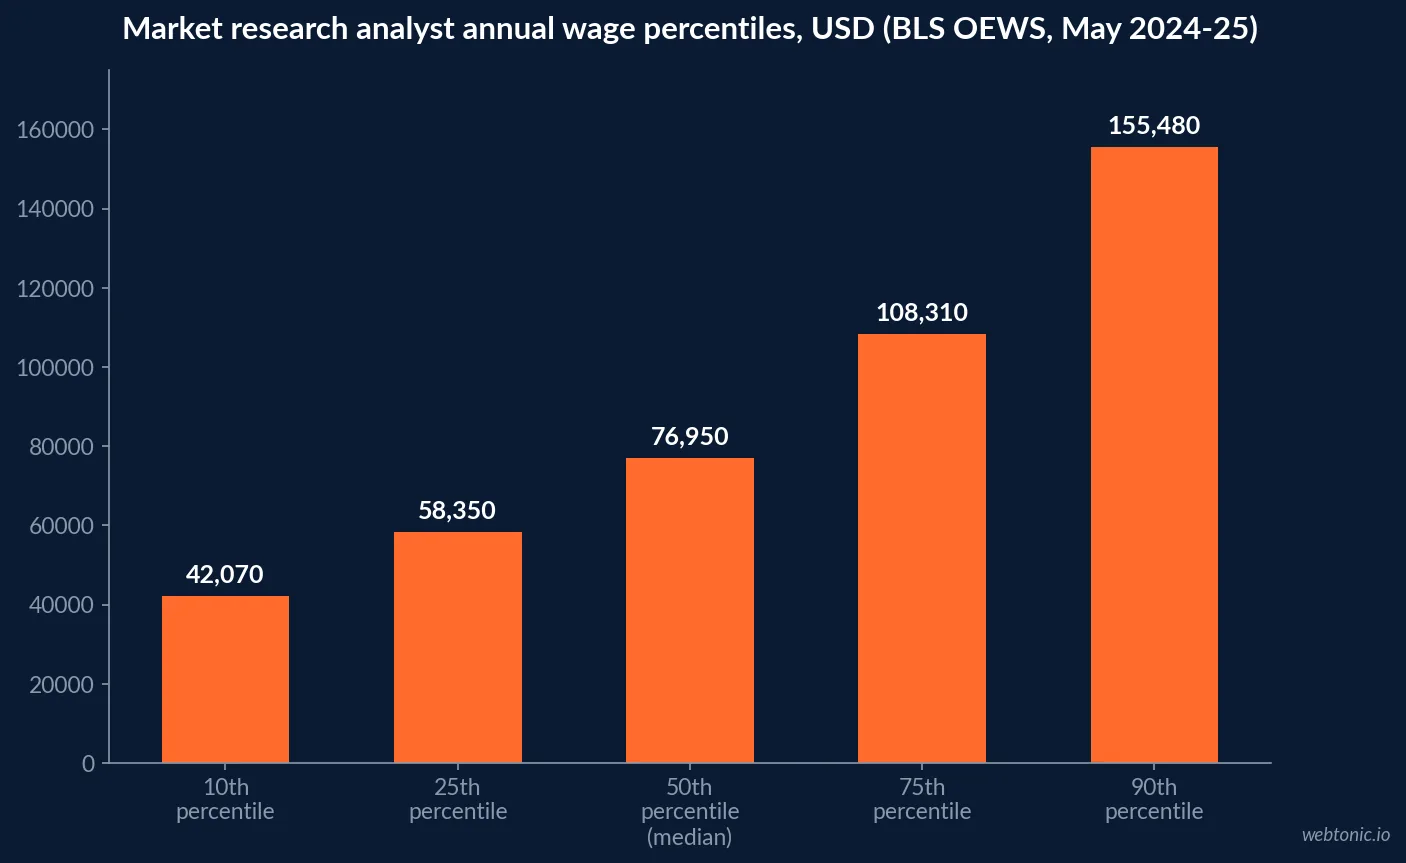
The US Bureau of Labor Statistics reports a median annual wage of USD 76,950 for market research analysts as of May 2024, with the lowest 10% earning under USD 42,070 and the highest 10% earning over USD 144,610. National employment sits at 941,700, with 7% projected growth — much faster than average — and roughly 63,000 openings a year. That is the one number in this budget with no ambiguity attached to it.
| Market research analyst pay (BLS, May 2024) | Annual wage, USD |
|---|---|
| 10th percentile | 42,070 |
| 25th percentile | 58,350 |
| Median (50th percentile) | 76,950 |
| 75th percentile | 108,310 |
| 90th percentile | 155,480 |
What the self-service data itself costs
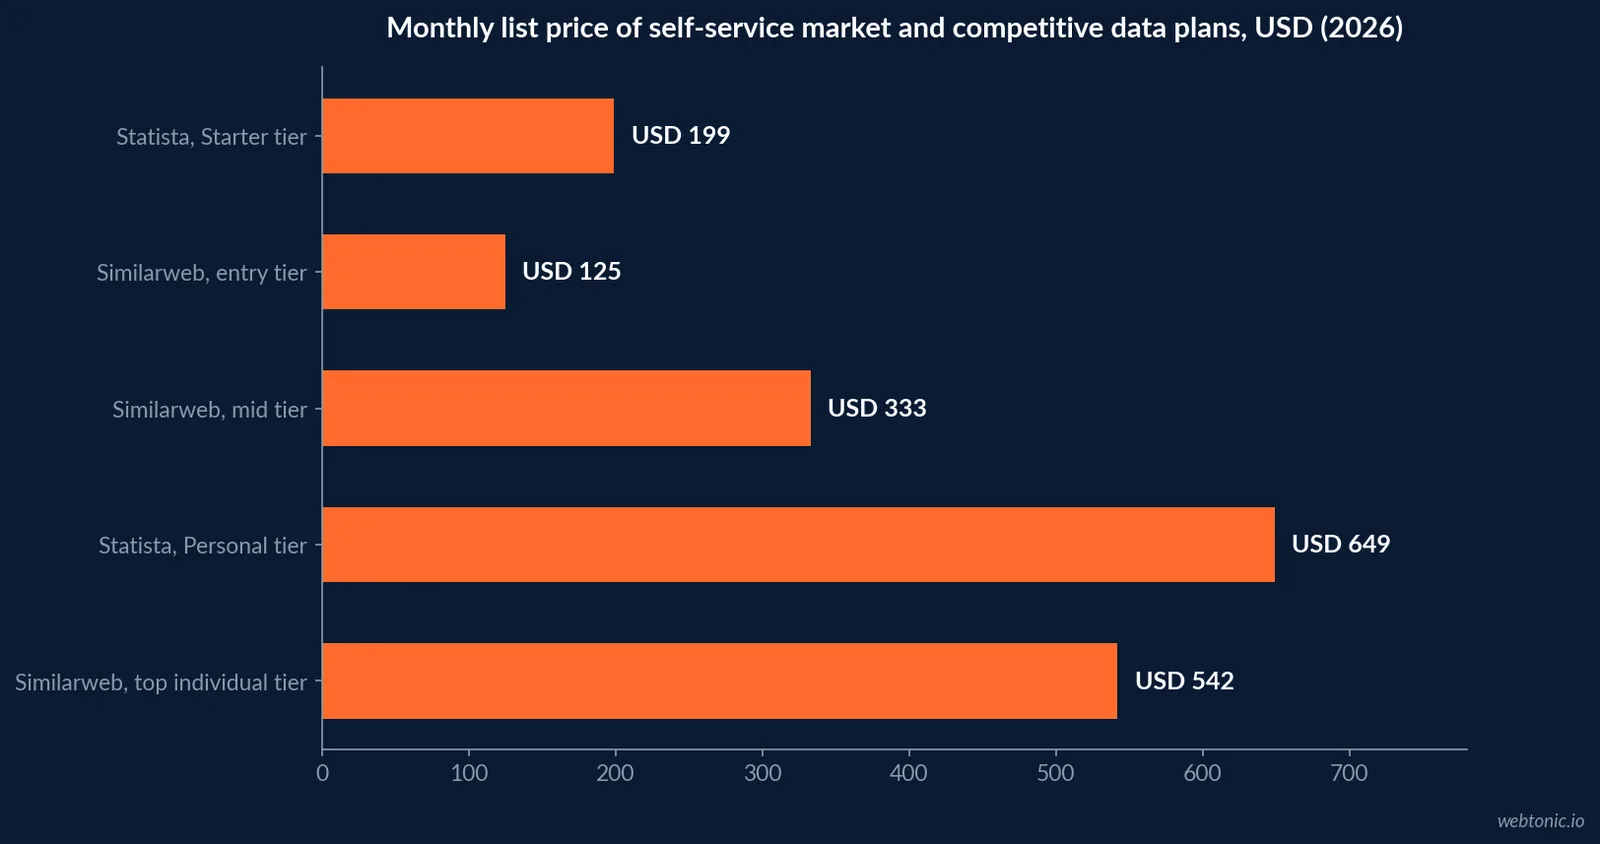
Similarweb's 2026 Web Intelligence individual plans list at USD 125 a month for the Competitive Intel & SEO & AEO tier, USD 333 a month for the mid tier, and USD 542 a month for the top individual tier, all billed annually. Statista's 2026 individual plans run USD 199 a month for the Starter tier and USD 649 a month for the Personal tier, which adds company, consumer and market-insight reports. Both vendors reserve multi-seat and enterprise pricing for a sales conversation.
| Self-service tier (2026, billed annually) | Monthly price, USD | Provider |
|---|---|---|
| Web Intelligence, entry tier | 125 | Similarweb |
| Starter | 199 | Statista |
| Competitive Intel, SEO & AEO & Ads | 333 | Similarweb |
| Top individual tier | 542 | Similarweb |
| Personal | 649 | Statista |
Enterprise syndicated data: the range that has no floor
ESOMAR's 2026 preliminary calculations put the market research sector alone at USD 60 billion in expected 2025 turnover, inside a total insights-industry figure of USD 164.7 billion. Research World's excerpt of the prior year's edition shows the trajectory: the whole insights industry grew from roughly USD 130 billion in 2022 to over USD 150 billion by 2024. That growth is funded by exactly the enterprise contracts that never appear on a public price list — the same tens-of-thousands-to-seven-figures range Vendr describes for Nielsen applies broadly across the category.
| Global insights industry sizing (2025 est., ESOMAR) | Turnover, USD billions |
|---|---|
| Market research sector | 60 |
| Research software sector | 69 |
| Business services sector | 37 |
| Total insights industry | 164.7 |
The maturity gap that decides whether the number gets used
Money alone does not make a market-share number actionable. Crayon's 2026 State of Competitive Intelligence report found KPI adoption jumped from 30% of programs in 2022 to 60.5% today — the steepest climb of any maturity indicator it tracks — and that teams tracking KPIs see a win rate of 66% versus 24% for teams that don't. Yet only 56.7% of programs have an executive sponsor, even though sponsored teams are 2.5 times more likely to reach USD 1 million or more in measured revenue impact and see win-rate gains climb to 62% versus 33% without one. Reporting cadence matters just as much: teams sharing results weekly or faster hit revenue impact at 79%, against 41% for monthly-or-slower teams.
| Program maturity signal (Crayon 2026) | With the practice | Without it |
|---|---|---|
| KPI tracking in place | 66% win rate | 24% win rate |
| Executive sponsor assigned | 62% win-rate climb, 2.5x revenue-impact odds | 33% win-rate climb |
| Weekly-or-faster reporting | 79% achieve revenue impact | 41% achieve revenue impact |
| KPIs + platform + sponsor together | 3.6x revenue-impact rate | Baseline with none of the three |
Build vs. buy: the trade-off most teams get backwards
The instinct is to hire before buying data, because headcount has a familiar budget line and a recruiting process everyone already understands. Run the arithmetic instead: one analyst at the BLS median of USD 76,950 covers roughly 12 to 15 months of a mid-tier Similarweb or Statista subscription, or a fraction of a single enterprise syndicated-data contract. An analyst without a licensed data source has nothing to analyze; a licensed data source without an analyst produces a report nobody reads. Most teams under-invest in the second half of that pair, not the first — which is exactly why Crayon's maturity data shows KPI tracking and sponsorship, not raw headcount, as the stronger predictor of whether the number gets used.
The practical sequence: license the narrowest data source that answers this quarter's specific question, assign one named owner (analyst or not) to read it on a fixed cadence, and only add a second data source once the first one has a demonstrated reader. Buying breadth before proving read-rate on one source is the single most common way a market-share budget gets cut the following year.
| Build vs. buy comparison, 2026 | Cost to stand up | Time to first usable read |
|---|---|---|
| Hire one analyst, no licensed data | USD 42,070-155,480 a year | Weeks, but nothing to analyze yet |
| License one self-service tool tier | USD 125-649 a month | Days |
| License one syndicated data contract | Tens of thousands minimum | Weeks to months (onboarding) |
| Analyst + one tool tier (recommended start) | Salary + USD 1,500-8,000 a year | 1-2 weeks |
Building the budget line by line
Start from the question the number has to answer, not from the tool a competitor uses. A self-service tier at USD 125 to 649 a month answers digital share-of-traffic questions; it cannot answer a retail point-of-sale question, which still requires a syndicated data contract priced in the tens of thousands at minimum. Pair whichever data source you buy with an executive sponsor and a weekly reporting rhythm — Crayon's data suggests that combination matters more than the size of the data contract itself. Our data and analytics practice builds that reporting layer once the raw data is secured.
If the market-share work is feeding a broader growth plan, see our growth marketing practice or talk to us about scoping the data layer before the tool renewal comes due.
Frequently Asked Questions
What should a company budget for market share tracking in 2026?
Three separate line items, not one. A market research analyst carries a median salary of USD 76,950 a year per the US Bureau of Labor Statistics. A self-service digital tool tier runs USD 125 to 649 a month per seat on Similarweb or Statista's published 2026 pricing. Verified syndicated retail or panel data from a provider like Nielsen has no published list price and runs from tens of thousands of dollars for a basic category report to seven figures for a multi-market program, per Vendr's 2026 Nielsen pricing breakdown. Budget for all three before assuming one covers the others.
Is a market research analyst salary the main cost, or is the data itself more expensive?
For most mid-market teams, the data is the bigger and less predictable line item. BLS puts the median market research analyst salary at USD 76,950, with the middle 50% earning USD 58,350 to 108,310 - a known, budgetable number. Syndicated point-of-sale or panel data from Nielsen is customized per product suite, geographic coverage and category depth, with no public price list, which is exactly why buyers report costs ranging from the tens of thousands into seven figures for the same broad category of service.
What does a self-service market share or competitive intelligence tool cost?
Similarweb's 2026 Web Intelligence individual plans run USD 125 a month (Competitive Intel & SEO & AEO), USD 333 a month, or USD 542 a month for the top individual tier, all billed annually; enterprise pricing is custom. Statista's 2026 individual plans run USD 199 a month (Starter) or USD 649 a month (Personal), with a Professional tier priced on request. Neither vendor publishes list pricing for multi-seat or enterprise access - that is negotiated.
Does having a bigger market-share budget actually mean the number gets used?
Not on its own. Crayon's 2026 State of Competitive Intelligence report found that KPI adoption jumped from 30% of programs in 2022 to 60.5% today, and teams that track KPIs report a rising win rate at 66% versus 24% for teams that do not. But only 56.7% of programs have an executive sponsor, even though sponsored teams are 2.5 times more likely to reach USD 1 million or more in measured revenue impact. Budget without a sponsor and a reporting cadence under-performs budget with both.
How big is the market research and insights industry supplying this data?
Large and still growing. ESOMAR's 2026 preliminary calculations put expected 2025 global insights turnover at USD 164.7 billion, of which the core market research sector accounts for USD 60 billion. The 2026 GRIT Insights Practice Report shows brand-side analytics budgets at their strongest level on record, with the share of teams running budgets above USD 15 million growing from 27% to 40% in a single year.
Sources
US Bureau of Labor Statistics - Market Research Analysts Occupational Outlook
Vendr - Nielsen software pricing and plans 2026
Similarweb - Web Intelligence plans and pricing
Statista - Account plans and pricing
ESOMAR - Global Top Insights 2026 preliminary calculations
Research World / ESOMAR - Inside the insights industry
Crayon - The 2026 State of Competitive Intelligence
GreenBook - The Great Reclassification (2026 GRIT data)


