



Table of contents
A quarter of newly launched products stop selling within a year even after formal testing, according to the only large peer-reviewed measurement of the question. This page sets out what pre-launch panels and concept tests actually cost in 2026, what they catch, and what they consistently miss.
Key Takeaways
- 25% of new CPG SKUs stop selling within a year of launch.
- That failure rate rises to about 40% within two years.
- The measurement covers 83,719 new SKUs across 31 US categories.
- 95% of products that fail to meet a real consumer need fail in market.
- 76% of trialists claim they would repurchase a new product.
- Only 20% to 30% of trialists actually do repurchase within 36 weeks.
- A five-minute consumer survey complete costs USD 5 to 12 in 2026.
- A 60-minute B2B interview complete costs USD 60 to 120.
- Niche or executive audiences cost 3 to 15 times the general-population rate.
- A viable concept test score is loosely benchmarked at 40% to 50% Top-2-Box.
- The global insights industry is expected to reach USD 164.7 billion in 2025 turnover.
- The market research sector alone accounts for USD 60 billion of that.
- Brand-side analytics budgets over USD 15 million grew from 27% to 40% of teams.
- Budgets under USD 1 million fell from 34% to 15% of teams over the same period.
- Median market research analyst pay is USD 76,950 a year in the United States.
- The occupation is projected to add 63,000 openings a year through the decade.
- Only about one-third of new launches reach 1% household penetration in their first year.
Why most pre-launch testing still misses real outcomes
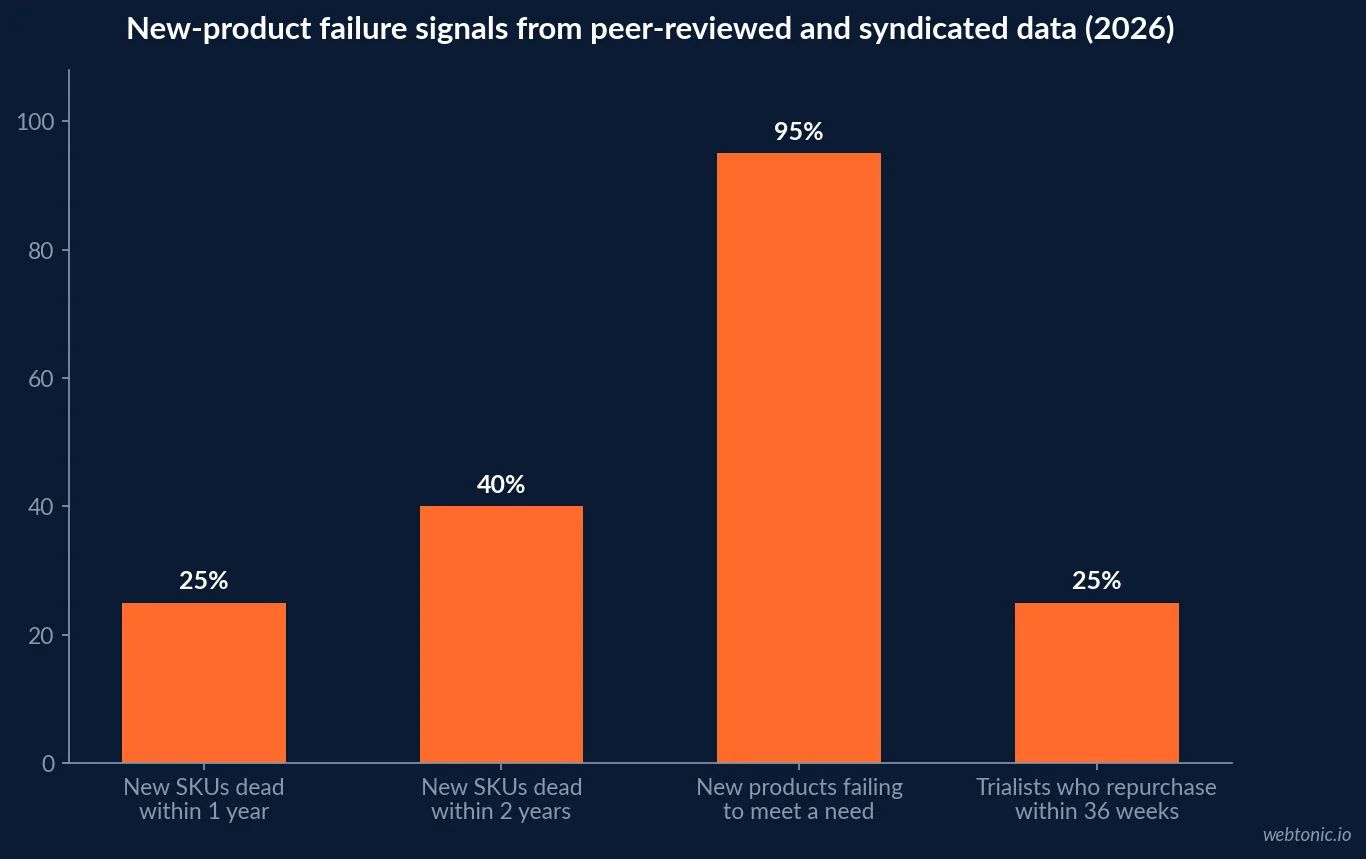
The industry's own most-repeated statistic on new product failure — often quoted at 80% — traces back to vendor surveys rather than measured sales data. The peer-reviewed number is smaller and more precise: researchers at the Ehrenberg-Bass Institute, publishing in Marketing Letters, tracked 83,719 new SKUs across 31 US CPG categories introduced over eight years and measured which ones stopped selling. One in four (25%) new SKUs are no longer bought a year later, a figure that climbs to roughly 40% within two years. Failure was more common for launches into higher-revenue categories and from smaller-share parent brands — exactly the launches that get the most pre-launch testing budget, not the least.
That gap between measured and claimed failure rates is itself a lesson: a concept score that feels reassuring is not the same as a launch that survives contact with real shelves.
| Failure signal (measured, not claimed) | Figure | Source | What it means for testing |
|---|---|---|---|
| New SKUs dead within 1 year | 25% | Marketing Letters (83,719 SKUs) | Testing rarely eliminates the risk |
| New SKUs dead within 2 years | ~40% | Marketing Letters (83,719 SKUs) | Risk compounds after launch |
| Products that fail to meet a need | 95% fail in market | NielsenIQ European Innovation Report | Need-fit matters more than polish |
| Products failing on marketing support | 30% | NielsenIQ European Innovation Report | A good concept can still be under-supported |
| Launches reaching 1% EU5 households, yr 1 | ~1 in 3 | NielsenIQ European Innovation Report | Most launches never reach real scale |
What a concept test actually predicts
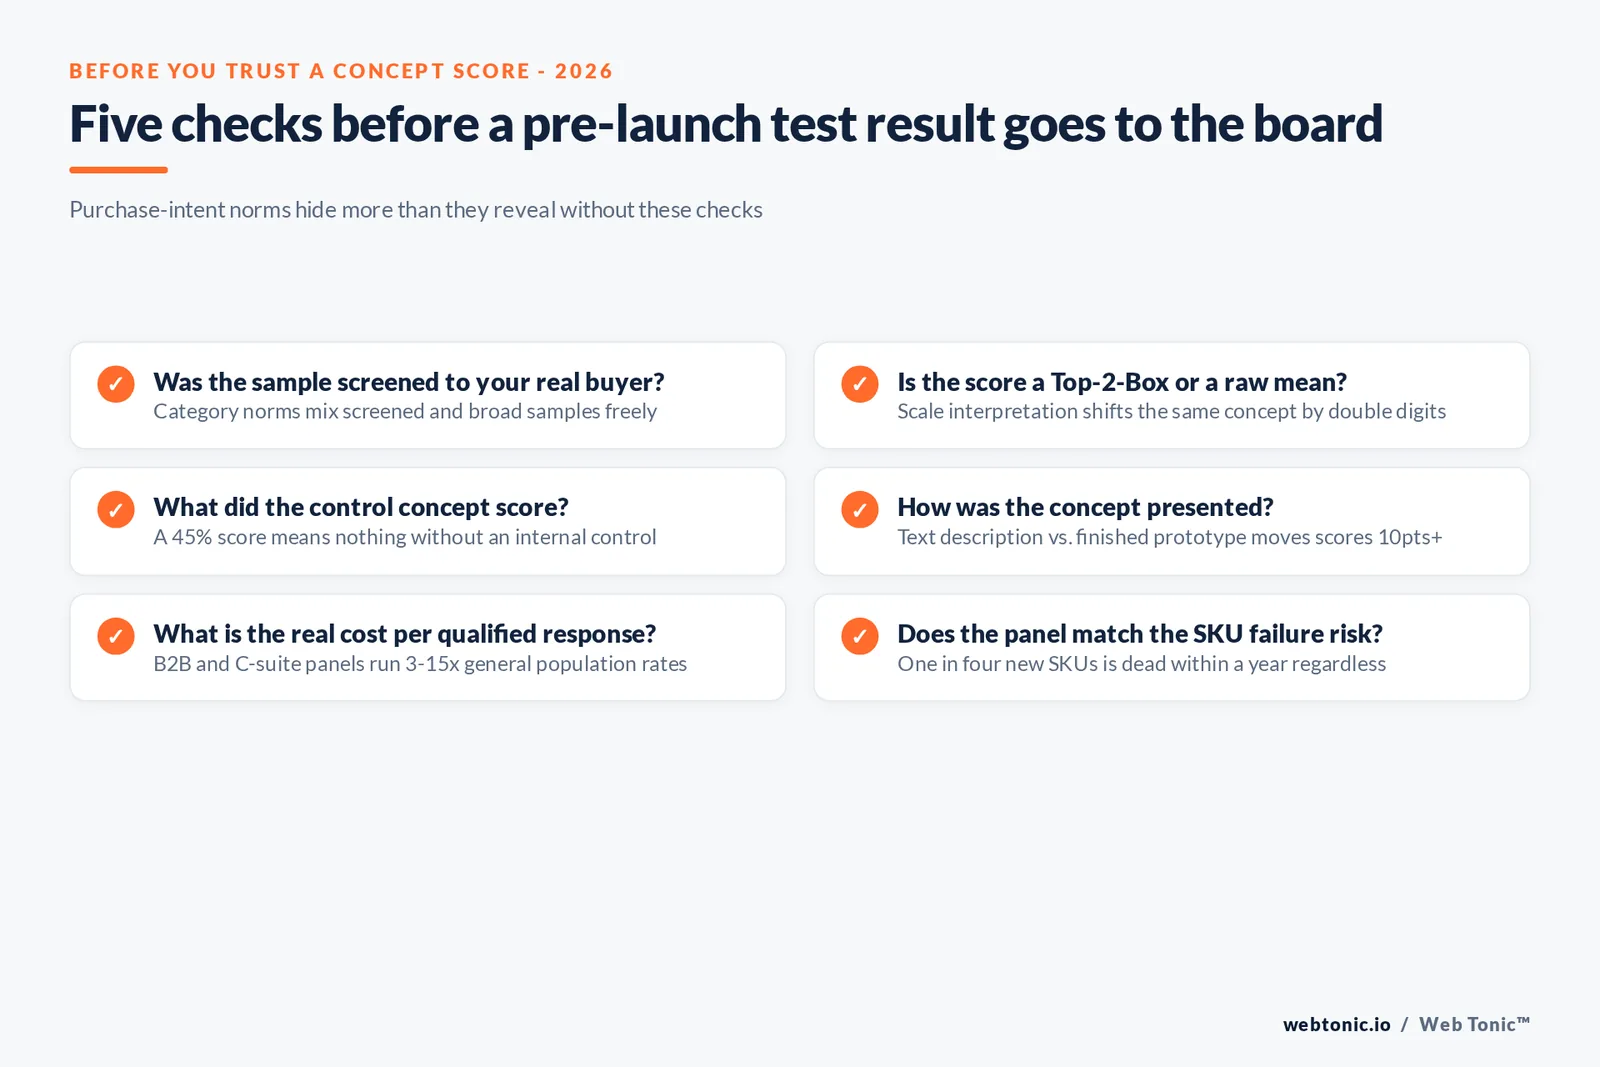
Purchase-intent scoring is the default metric in concept testing, and the standard question — "how likely would you be to buy this?" — is scored as a Top-2-Box (T2B) percentage: "definitely would buy" plus "probably would buy." Quali-Fi's methodology guide places a viable concept loosely above 40% to 50% T2B, though it stresses that thresholds vary sharply by category.
User Intuition's 2026 review of normative databases is more direct about the trap: a 45% T2B score from a tightly screened audience looking at a polished prototype is not comparable to the same 45% from a broad sample reading a text description. Scale interpretation itself varies — some respondents reserve the top box for concepts they find extraordinary, others use it as their default "acceptable" answer — which is why an internal control concept, tested the same way every time, beats an external industry norm.
| Concept-test variable | What changes the number | Practical fix |
|---|---|---|
| Sample screening | Broad vs. category-specific panel | Screen to your actual buyer, every time |
| Scoring method | Top-2-Box vs. raw mean | Report both, never just the flattering one |
| Presentation format | Text description vs. finished prototype | Match the format to launch readiness |
| Benchmark source | Industry norm vs. internal control | Run a known control concept every wave |
| Category context | High- vs. low-consideration purchase | Weight the threshold to category norms |
What one qualified response actually costs in 2026
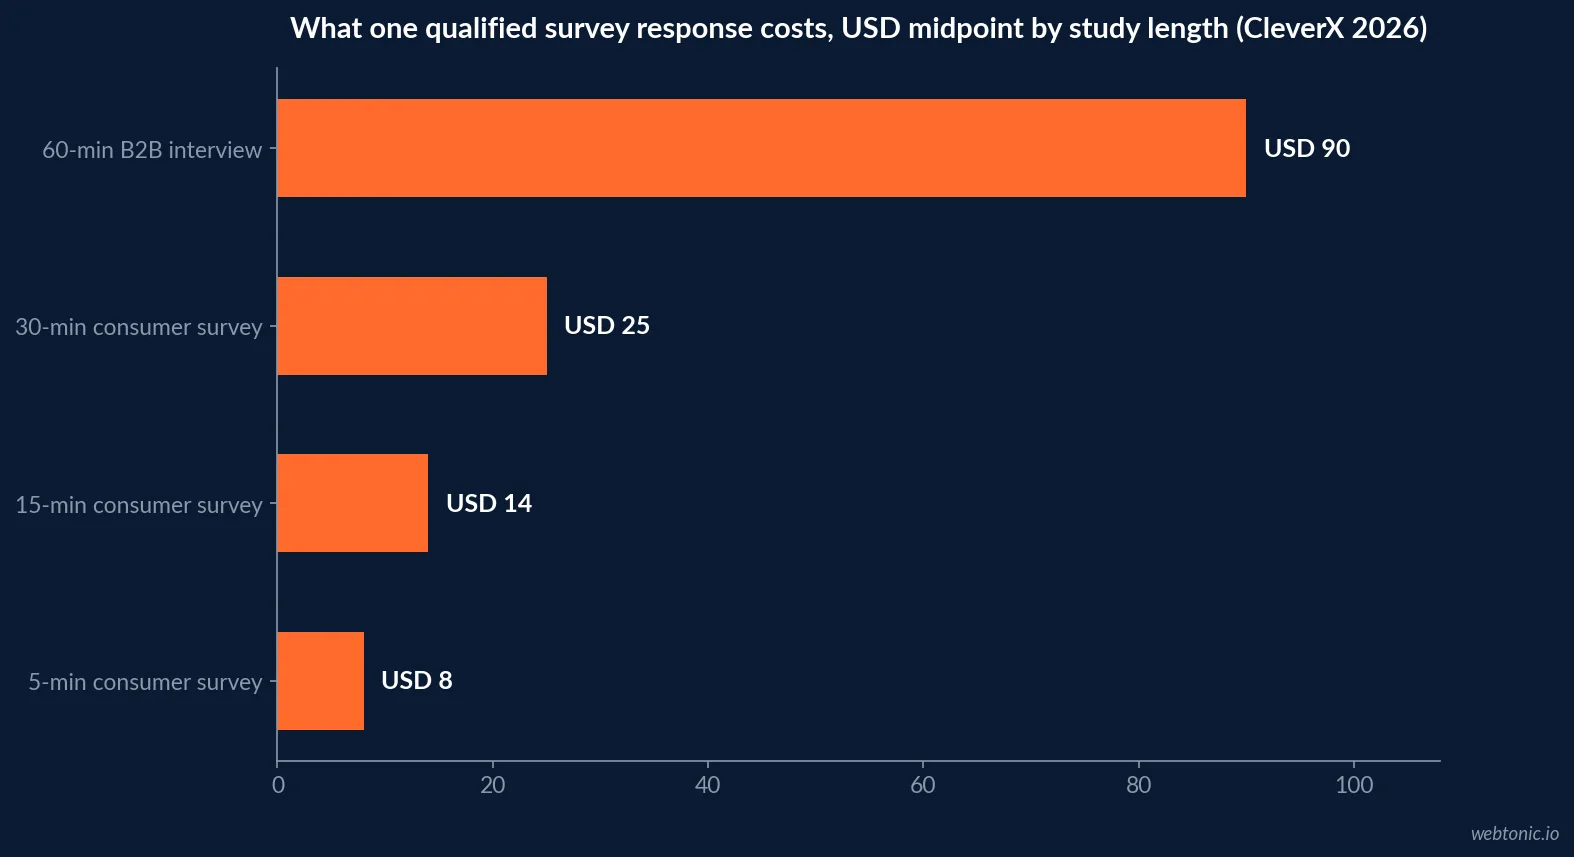
CleverX's 2026 panel pricing benchmarks put a five-minute consumer survey at USD 5 to 12 per complete, a 15-minute survey at USD 8 to 20, a 30-minute survey at USD 15 to 35, and a 60-minute remote interview at USD 60 to 120. Audience type moves the number further: an individual contributor costs USD 30 to 60 for a survey complete, while a VP or C-suite respondent runs USD 80 to 150 for the same survey and USD 180 to 350 for a full interview.
Koji's 2026 incidence-rate breakdown reframes the same math around how rare your buyer is: a general-population study runs USD 2 to 15 a complete, while targeting a population at under 5% incidence — C-suite executives, physicians, owners of a specific device — carries an 8 to 15 times premium on the identical questionnaire.
| Study type | Typical cost per complete (2026) | Source | Best used for |
|---|---|---|---|
| 5-minute consumer survey | USD 5-12 | CleverX 2026 | Broad concept screening |
| 15-minute consumer survey | USD 8-20 | CleverX 2026 | Feature or price sensitivity checks |
| 30-minute consumer survey | USD 15-35 | CleverX 2026 | Full concept and messaging tests |
| 60-minute remote interview | USD 60-120 | CleverX 2026 | Qualitative depth behind the score |
| Niche B2B / executive panel | 3-15x the general population rate | Koji 2026 | Enterprise and specialist buyers |
Who runs this research, and what they cost to hire
The US Bureau of Labor Statistics reports a median annual wage of USD 76,950 for market research analysts (May 2024), with the lowest 10% earning under USD 42,070 and the highest 10% earning over USD 144,610. Employment sits at 941,700 nationally, projected to grow 7% — much faster than average — with about 63,000 openings a year from growth and replacement combined.
A trained internal analyst is the cheaper route for ongoing, repeatable panels. A one-off pre-launch wave at unusual scale is usually still bought project-by-project from a fielding partner, because that is exactly what the per-response pricing above is priced to deliver.
| Market research analyst pay (BLS, May 2024) | Annual wage, USD |
|---|---|
| 10th percentile | 42,070 |
| 25th percentile | 58,350 |
| Median (50th percentile) | 76,950 |
| 75th percentile | 108,310 |
| 90th percentile | 144,610 |
The size of the industry writing these checks
ESOMAR's 2026 preliminary calculations put expected 2025 global insights-industry turnover at USD 164.7 billion, split into a USD 60 billion market research sector, a USD 69 billion research software sector, and a USD 37 billion business services sector. The top 50 insights companies hold roughly 50% market share and a combined turnover of USD 82.7 billion — a figure that has stayed remarkably stable since 2023 even as a long tail of smaller firms keeps gaining ground below them.
The 2026 GRIT Insights Practice Report shows where growth is concentrating inside that number: brand-side analytics teams report research-project budgets at their strongest level since tracking began, with technology spending and staffing both at new highs.
| Insights industry sizing (2025 est., ESOMAR) | Turnover, USD billions | Share of total |
|---|---|---|
| Market research sector | 60 | 36% |
| Research software sector | 69 | 41% |
| Business services sector | 37 | 23% |
| Top 50 insights companies (all sectors) | 82.7 | ~50% |
Where the budget is actually moving
The GRIT report's clearest signal is a split within brand-side teams. Analytics professionals are expanding on every dimension tracked at once: 53% report budget increases against 10% decreases, the share of teams with research-project budgets above USD 15 million grew from 27% to 40%, and the share below USD 1 million fell from 34% to 15%. Brand-side researchers, by contrast, show budgets close to flat and the first negative staffing reading in the tracked period. The money is not leaving market research — it is consolidating into fewer, larger, more analytics-led programs.
| Brand-side research budget (GRIT 2026) | Analytics teams | Research teams |
|---|---|---|
| Budgets above USD 15 million | 40% (up from 27%) | Roughly flat |
| Budgets below USD 1 million | 15% (down from 34%) | Roughly flat |
| Reporting budget increases | 53% | Not the strongest signal |
| Staffing direction | Increases outpace decreases ~4:1 | First negative reading tracked |
The trial-to-repeat funnel testing is supposed to protect
NielsenIQ's 2026 European Innovation Report tracks what happens after the concept score, once a product is actually on shelf. 76% of trialists claim they would buy again, but only 20% to 30% actually repurchase within 36 weeks — a gap that varies by country and category and that stated purchase intent consistently overstates. Overall liking, not "newness" or differentiation, is the strongest predictor of that repeat behaviour, and only about a third of new launches reach 1% household penetration across EU5 markets in their first year.
That funnel is the real argument for testing before launch: not that it eliminates failure, but that it catches the concepts unlikely to convert stated intent into repeat purchase before the marketing budget is spent finding that out at retail.
Building a test plan that earns its budget
Screen to the real buyer and price the panel accordingly rather than defaulting to general-population rates. Run an internal control concept every wave so scores are comparable over time. Treat purchase intent as directional, not predictive, and weight liking and category fit at least as heavily as novelty. Budget separately for the concept test and for the marketing support the NielsenIQ data shows most failures are actually missing. Our data and analytics practice builds that scorecard before a client commits launch spend.
If the plan is heading toward paid channels once the concept clears testing, our breakdown of what paid search costs and our growth marketing practice are the next two stops, or talk to us about the launch plan directly.
Frequently Asked Questions
How much does pre-launch market research actually cost?
It scales with who you need to reach, not just how many people. CleverX's 2026 panel pricing benchmarks put a five-minute consumer survey at USD 5 to 12 a complete and a 30-minute survey at USD 15 to 35, while a 60-minute remote interview runs USD 60 to 120. Niche audiences change the math entirely: enterprise IT buyers or C-suite respondents cost 3 to 15 times the general-population rate, per Koji's 2026 incidence-rate pricing breakdown. A 250-response study with real screening criteria commonly lands at USD 40 to 80 per interview rather than the USD 2 to 15 quoted for broad samples.
Does pre-launch testing actually predict which products fail?
It predicts less than most teams assume. Peer-reviewed research published in Marketing Letters tracked 83,719 new CPG SKUs across 31 US categories over eight years and found that one in four (25%) stopped selling within a year, rising to about 40% within two years, despite the fact that concept and consumer testing is now standard practice ahead of launch. NielsenIQ's 2026 European Innovation Report adds the mechanism: 95% of new products that fail to meet a real consumer need or desire fail in market, and 76% of trialists say they would repurchase while only 20 to 30% actually do.
What counts as a good purchase-intent score in a concept test?
There is no universal number, and treating one as gospel is the most common mistake. Quali-Fi's concept-testing methodology guide puts a Top-2-Box purchase intent score above 40 to 50% as a rough marker of a viable concept, but User Intuition's 2026 benchmarking review is blunt that a 45% score from a tightly screened audience viewing a finished prototype is not comparable to the same number from a broad sample reading a text description. The reliable benchmark is your own testing history under a consistent methodology, run against an internal control concept.
Who is actually buying all this research, and how big is the industry?
ESOMAR's 2026 preliminary Global Top 50 Insights calculations put total 2025 insights-industry turnover at an expected USD 164.7 billion, with the market research sector itself accounting for USD 60 billion, up from USD 142 billion industry-wide as recently as 2023. The 2026 GRIT Insights Practice Report shows where that spend is concentrating: brand-side analytics teams report research-project budgets at the strongest level since tracking began, with the share running budgets above USD 15 million growing from 27% to 40% while budgets under USD 1 million fell from 34% to 15%.
Is it cheaper to hire a market research analyst or buy the research externally?
It depends on volume, not on which line item looks smaller on a slide. The US Bureau of Labor Statistics puts the median annual wage for market research analysts at USD 76,950 (May 2024), with the middle 50% earning between USD 58,350 and USD 108,310 and 63,000 openings projected per year through the decade. A single analyst can run ongoing internal panels cheaply once trained, but a one-off pre-launch wave at scale is usually still bought project-by-project from a fielding partner, because that is what the per-response pricing above is built for.
Sources
Marketing Letters (Springer) - How common is new product failure and when does it vary?
NielsenIQ - European Innovation Report 2026, Consumer Sentiment chapter
ESOMAR - Global Top Insights 2026 preliminary calculations
GRIT - 2026 Insights Practice Report
US Bureau of Labor Statistics - Market Research Analysts Occupational Outlook
CleverX - Research panel pricing benchmarks 2026
Koji - Survey sample cost, CPI and incidence rate 2026
Quali-Fi - Concept testing: complete methodology guide
User Intuition - Concept testing benchmarks: what counts as a good score


