



Table of contents

Industrial buyers make first contact 61% of the way through a journey averaging 10 months, and a median 38% of B2B pipeline arrives with no attributable touchpoint. Manufacturing attribution rarely breaks loudly — it just reports the wrong winner. Here is the 2026 data.
Key Takeaways
- The median dark-funnel gap is 38% of B2B pipeline; ecosystem-led motions hit 44%.
- Multi-touch attribution adoption reached 47% in 2026, up from 31% in 2023.
- Marketing mix modeling tripled from 9% to 26%, and 31% among mid-market and enterprise teams.
- 43% of MMM adopters cite signal loss as the trigger; 38% credit open-source tooling for affordability.
- AI Markov-chain attribution lifts holdout fidelity 22 points over deterministic last-touch.
- Attribution-capable teams spend 23% more on martech and report 1.6× larger marketing-sourced pipeline.
- 64% of manufacturing marketers struggle to attribute ROI and track customer journeys.
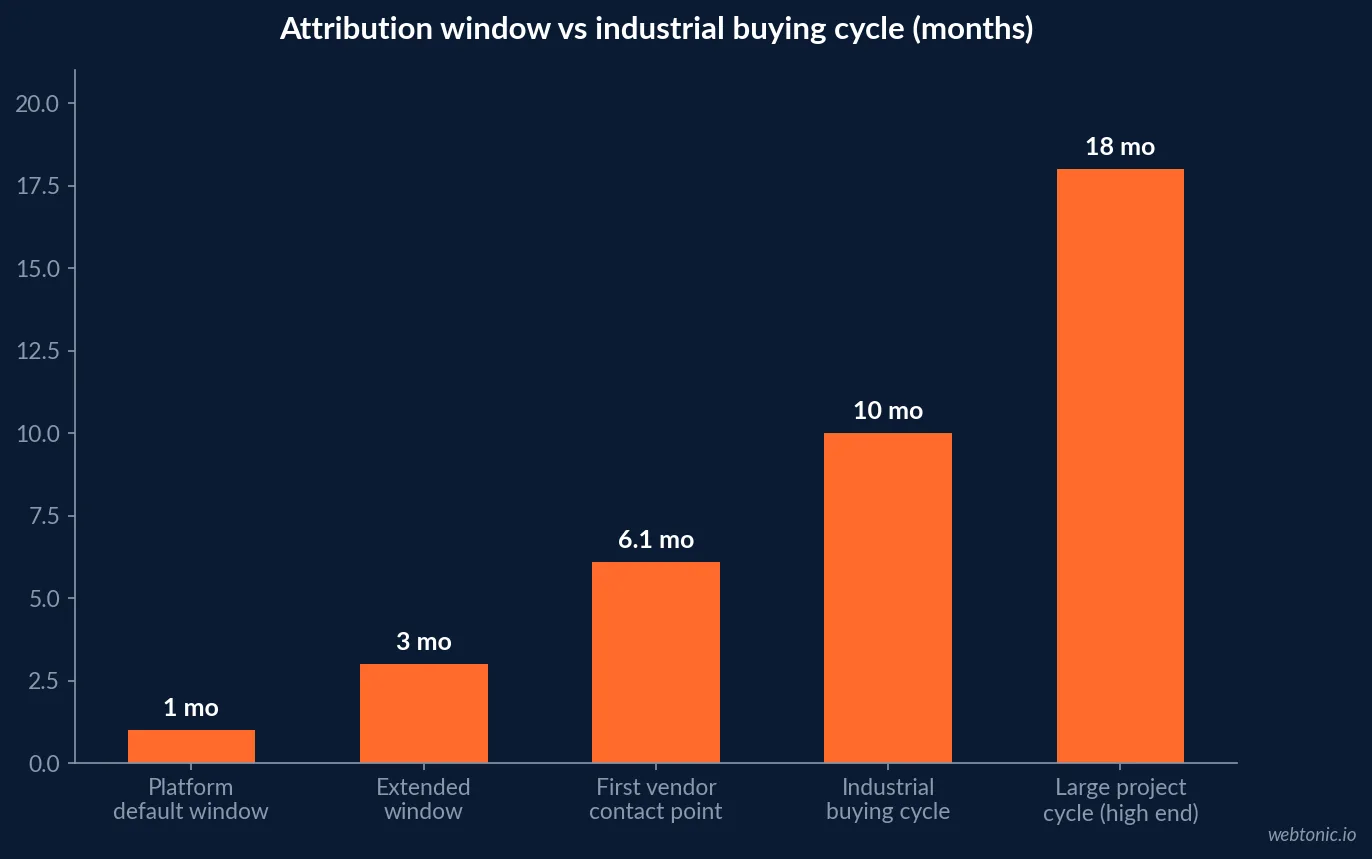
- Industrial cycles average 10 months (manufacturing deals 136 days median, 6–18 months for large projects).
- Typical industrial decisions involve 13 internal stakeholders and 9 external influencers.
- 95% of purchases come from the day-one shortlist; 73% review the supplier website before an RFI.
- Default 30– and 90-day lookback windows are incompatible with 6–18 month cycles.
- Improved attribution correlates with +33% marketing ROI and −29% CAC.
- Closing the CRM loop delivered 34.1% higher marketing-sourced pipeline in two quarters.
- Self-reported attribution response rates reach 78% on a single open-text form field.
- One blended-model programme cut CAC 18% and raised win rate 22%.
- 60% of senior decision-makers trust incrementality testing most — 20 points ahead of MMM.
The Structural Problem: A 10-Month Cycle Measured in 30-Day Windows
Manufacturing attribution is not usually broken by bad tags. It is broken by arithmetic. Industrial buyer research puts first vendor contact at 61% of the journey (down from 69% the prior year) with cycles averaging about 10 months, while manufacturing sales benchmarks report a 136-day median and 6–18 months for large multi-site deals. Ad platforms default to 30- or 90-day lookback windows. Whatever falls outside becomes "direct" or "organic".
Then multiply by the committee. Forrester’s 2026 business-buying research puts a typical industrial decision at 13 internal stakeholders and 9 external influencers, with procurement acting as a decision-maker in 53% of cycles. Each of those people generates their own touchpoint trail, most of it anonymous. Unsurprisingly, CMI’s manufacturing research finds 64% of manufacturing marketers report difficulty attributing ROI and tracking customer journeys — their single largest measurement complaint.
| Structural factor | 2026 figure | Attribution consequence |
|---|---|---|
| Industrial buying cycle | ~10 months (136-day median deal) | Exceeds every default lookback window |
| First vendor contact | 61% through the journey | Early touches are never linked to the deal |
| Buying committee | 13 internal + 9 external | One tracked contact per 20+ influencers |
| Day-one shortlist | 95% of purchases | Awareness spend looks like waste in-platform |
| Website review before RFI | 73% of industrial buyers | Credit lands on branded search, not the source |
The Dark Funnel Is 38% of Pipeline — and Deeper in Industrial
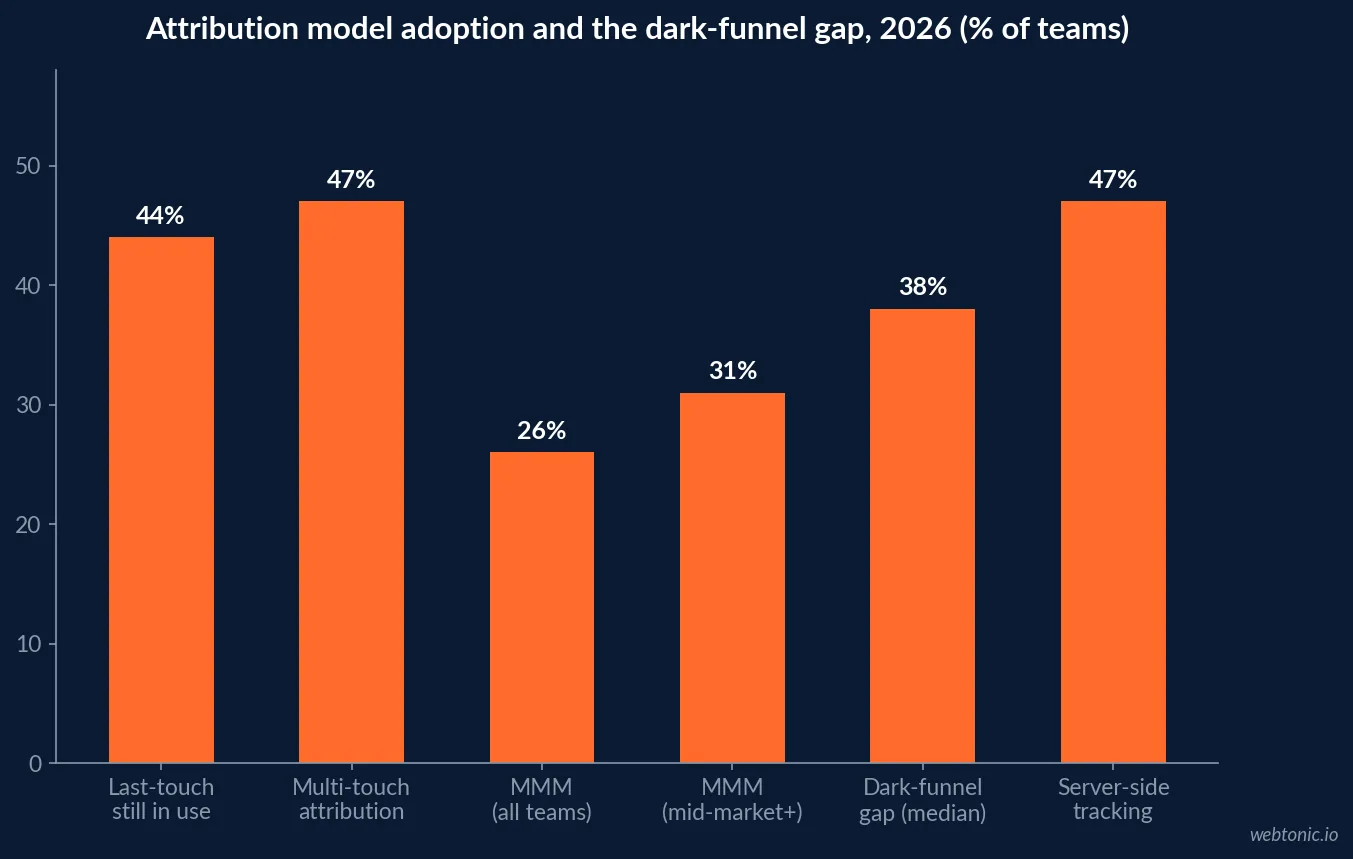
A survey of 1,200+ B2B marketing teams puts the median dark-funnel gap at 38% of pipeline — revenue that arrives with no attributable touchpoint. The decomposition matters more than the headline: word-of-mouth and referrals 17%, dark social 12%, podcasts 6%, communities and forums 5%, and internal buying-committee chatter 4%. By motion, product-led hits 51%, ecosystem/partner-led 44%, blended 41%, and enterprise sales-led is lowest at 28%.
Manufacturing sits closer to the ecosystem end than most marketers assume, because distributors, reps, trade associations and plant-floor peer networks all originate demand that no pixel records. Prospectory’s analysis of 6,000+ self-reported attribution responses ranks dark-funnel influence as peer-to-peer conversation 38%, audio and video 24%, community and social 22% and content sharing 16%. Their blunt summary: if 70% of touchpoints are invisible, a multi-touch model is a model built on 30% of the data.
What Manufacturing Teams Actually Run in 2026: Two Models, Not One
The single-model debate is over. Multi-touch attribution adoption reached 47% in 2026 (from 31% in 2023) and MMM tripled from 9% to 26%, reaching 31% among mid-market and enterprise teams while sub-$10M cohorts trail at 14%. Adoption percentages exceed 100% in aggregate because most teams now run both — MTA for tactical channel calls, MMM for budget allocation.
Two forces drove the MMM revival: 43% of adopters cite signal loss from cookie deprecation and privacy law, and 38% say open-source tooling collapsed entry cost from $200K–$500K consulting engagements to a few weeks of in-house work. 29% of MMM adopters were previously MTA-only. Meanwhile AI has become the reconciliation layer: Markov-chain attribution adds 22 points of holdout fidelity over last-touch, deep-learning approaches 18 points, and position-decay 11 points.
| Model | Adoption 2026 | Change since 2023 | Role in a manufacturing stack |
|---|---|---|---|
| Multi-touch attribution | 47% | +16 pts | Tactical channel and campaign decisions |
| Marketing mix modeling | 26% (31% mid-market+) | ×~3 | Annual and quarterly budget allocation |
| Last-touch only | ~44% still rely on it | Declining | Adequate only for sub-30-day cycles |
| AI / algorithmic layer | Emerging | +22 pts fidelity | Reconciles MTA with MMM output |
| Self-reported attribution | Growing | n/a | The only lens on the 38% gap |
Incrementality: The Measurement Marketers Trust Most
When asked which measurement they believe, senior marketers do not name their dashboard. EMARKETER’s January survey found 60% of US senior decision-makers trust independent incrementality testing most — 20 points ahead of media mix modeling (40%) and nearly double in-platform reporting (37%). IAB’s 2026 State of Data report puts 67–76% of US buy-side decision-makers using at least one advanced approach: incrementality tests, attribution analysis or MMM.
For manufacturers, geo holdouts are the practical version: pause paid activity in matched regions for a quarter and compare RFQ volume. It is imperfect, it is slow, and it is still the cleanest causal read available on a 10-month cycle.
The CRM Is the System of Record — Not GA4, Not the Ad Platform
In industrial B2B, the only place closed-won value, deal size, cycle length and committee context coexist is the CRM. That makes the closed loop the highest-return attribution project available: capture click IDs at lead creation, and push opportunity-stage and closed-won events back to the ad platforms. Accounts that closed that loop reported 34.1% higher marketing-sourced pipeline within two quarters versus accounts that left it open.
Data hygiene decides whether any of it reconciles. Duplicate contacts, inconsistent lead-source fields and deals created without a source are the standard failure modes, and they are worse in manufacturing because quotes often arrive by phone, email or through a distributor. Attribution survey data is direct about the resulting overconfidence: most teams overestimate their attribution precision by 20–30%, only about a third of marketing leaders call their attribution mostly accurate, and 47% now use server-side tracking to limit browser-side loss.
Self-Reported Attribution: The Cheapest Industrial Fix
One open-text field on the quote form — "how did you first hear about us?" — produced a 78% response rate in Prospectory’s documented programme, and immediately surfaced podcast and referral influence that the dashboard had filed under organic search and direct traffic. In one measured example, 23% of respondents named a podcast in month one, against zero podcast-sourced deals in the attribution tool.
The operating model that follows is a blend, not a replacement: weight channel allocation 50% on multi-touch data and 50% on self-reported data. Over four quarters that programme moved about 25% of budget from paid search and display into community, audio and advocacy, and reported CAC down 18% with win rate up 22%. For manufacturers, the same field usually reveals distributor and trade-show influence — the two channels most often mis-credited in industrial marketing reporting.
| Fix | Effort | Documented effect |
|---|---|---|
| Self-reported attribution field | Low — one form field | 78% response rate; surfaces the 38% gap |
| CRM closed-loop imports | Medium — CRM + platform work | +34.1% marketing-sourced pipeline |
| Extended lookback windows | Low — settings change | Aligns reporting with 10-month cycles |
| Server-side tracking | Medium | Used by 47% of B2B marketers to cut signal loss |
| Geo incrementality tests | High — quarterly cadence | Most-trusted method for 60% of leaders |
| MMM on open-source tooling | High | Entry cost down from $200K–$500K |
The Business Case: Attribution Spend Pays for Itself
Attribution-capable teams — those running MTA, MMM or a hybrid with measured holdout fidelity — spend 23% more on martech and report 1.6× larger marketing-sourced pipeline than last-touch-only peers. Teams that improved accuracy report +33% marketing ROI and −29% CAC, primarily by moving budget from over-credited to under-credited channels. For a manufacturer with a $50,000 to $5 million average contract, correcting one mis-credited channel pays for the entire measurement build.
The sequence we recommend for lean industrial teams: fix lead-source hygiene, add the self-reported field, extend lookback windows, then close the CRM loop. Model sophistication comes last, because a Markov model on dirty data is just a confident wrong answer. Our data intelligence practice builds exactly that stack, and growth marketing uses it to reallocate spend.
What to Track on a Long Industrial Cycle
- Pipeline, not leads — marketing-sourced and marketing-influenced opportunity value by channel.
- Self-reported vs tracked source delta — your measurable dark-funnel gap against the 38% median.
- Stage conversion — lead→MQL, MQL→SQL, SQL→opportunity, with cycle time at each step.
- Cycle length by source — referral and distributor deals close materially faster than cold paid.
- Account coverage — how many of the 13 stakeholders you have touched, not how many forms were filled.
- Holdout fidelity — whether your model predicts withheld revenue, the only honest accuracy test.
Attribution in manufacturing will never be complete. Planning against a permanent 38% gap — rather than pretending to close it — is what separates a 2026 measurement stack from a 2021 one. The related read: how industrial search demand behaves across the same long cycle.
Frequently Asked Questions
Why does marketing attribution break in manufacturing?
Because the measurement window is shorter than the buying cycle. Industrial buying journeys average about 10 months and first vendor contact happens 61% of the way through, while ad platforms default to 30- or 90-day lookback windows. Add a median 38% of B2B pipeline that arrives with no attributable touchpoint, 13 internal stakeholders per decision, and 64% of manufacturing marketers reporting difficulty attributing ROI, and the result is a model that is technically working and strategically blind.
What is the dark funnel worth in industrial pipeline?
Survey data across 1,200+ B2B teams puts the median dark-funnel gap at 38% of pipeline, decomposed as word-of-mouth and referrals 17%, dark social 12%, podcasts 6%, communities 5% and internal buying-committee chat 4%. Ecosystem-led motions reach 44% and product-led 51%; enterprise sales-led motions are lowest at 28%. In manufacturing the driver is committees of 8-12 stakeholders researching silently before procurement ever makes contact.
Which attribution model should a manufacturer use?
Two in parallel. Multi-touch attribution now sits at 47% adoption for tactical channel decisions, and marketing mix modeling has tripled from 9% to 26% (31% among mid-market and enterprise) for budget allocation. Single-model shops are the minority in 2026. For manufacturers the non-negotiable layer under both is CRM-based reporting, because closed-won data, deal value and cycle length live there — not in the ad platforms.
Does better attribution actually change results?
Measurably. Teams that improved attribution accuracy report a 33% average increase in marketing ROI and a 29% average reduction in customer acquisition cost, mostly from shifting budget out of over-credited channels. Accounts that closed the loop between ad platforms and CRM saw 34.1% higher marketing-sourced pipeline within two quarters. One documented programme that blended self-reported attribution 50/50 with multi-touch data cut CAC 18% and lifted win rate 22%.
What is self-reported attribution and does it work for industrial companies?
It is a single open-text question on the quote or contact form — 'how did you first hear about us?' Documented response rates reach 78%, and the answers routinely surface channels the dashboard credits to organic search or direct traffic. For manufacturers with long cycles and trade-show, distributor and referral influence, it is the cheapest way to see the 38% of pipeline no pixel records. Reconcile it against tracked source; the delta is your attribution gap.
Sources
Digital Applied — Marketing Attribution Statistics 2026
Prospectory — Dark Funnel Attribution in B2B
Manufacturing Lead Generation — Industrial Buyer Behavior
AMW — Marketing Attribution Statistics
EMARKETER — Incrementality Testing Trust Survey
Visionary Marketing — B2B Attribution Data 2026
Content Marketing Institute — Manufacturing Research
Optifai — Manufacturing Sales Benchmarks


