



Table of contents
Key Takeaways
- The global industrial analytics market is valued at $44.57 billion in 2026 and is projected to reach $97.38 billion by 2031, representing a rapid doubling driven by IoT, AI, and predictive maintenance adoption (Mordor Intelligence).
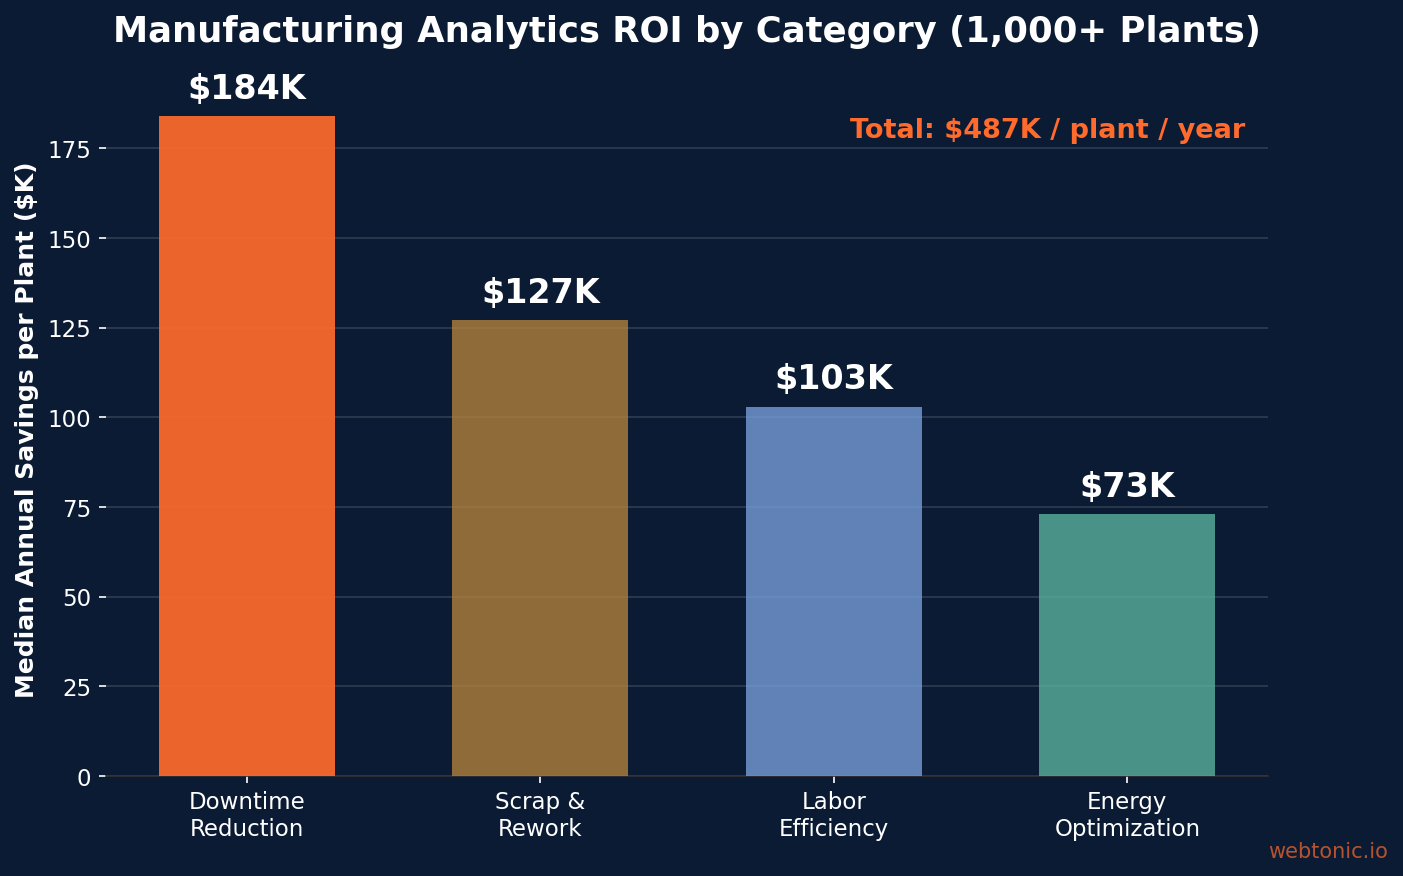
- Manufacturing analytics deployments deliver a median $487,000 in annual savings per plant across downtime reduction, scrap elimination, energy optimization, and labor efficiency — with a 14-month median payback period (iFactory, 1,000+ plants).
- Manufacturing's data monetization score (53.7%) ranks second globally across all industries, trailing only retail at 54.7%, yet AI monetization stalls at just 17% — revealing an enormous untapped opportunity (InnovationVista 2026).
- 80% of manufacturers using marketing automation report gains in lead generation, and 77% see improved conversion rates, making analytics-driven marketing a direct revenue contributor (MarketScale 2026).
- Unplanned downtime reduction accounts for $184,000 in median annual savings per plant, the single largest analytics ROI category, followed by scrap/rework ($127K), labor efficiency ($103K), and energy optimization ($73K) (iFactory).
- Only 38%–67% of manufacturers have achieved monetized BI practices (predictive analytics and automated responses in workflows), depending on company size — indicating most firms still use dashboards for reporting rather than decision-making (InnovationVista 2026).
- Manufacturers using marketing analytics improve campaign performance by 29% and those implementing CRM systems improve customer retention by 24% (Marketing LTB 2026).
Industrial Analytics Market Overview
The industrial analytics sector is experiencing rapid expansion as manufacturers invest in data infrastructure to optimize operations, reduce costs, and gain competitive advantage. Here is a snapshot of the key market and adoption metrics defining manufacturing analytics in 2026.
| Metric | Value | Source |
|---|---|---|
| Global industrial analytics market (2026) | $44.57 billion | Mordor Intelligence |
| Projected market size (2031) | $97.38 billion | Mordor Intelligence |
| Median annual savings per plant | $487,000 | iFactory (1,000+ plants) |
| Median payback period | 14 months | iFactory |
| Unplanned downtime reduction (within 12 mo) | 22% average | iFactory |
| Data monetization score (manufacturing) | 53.7% (2nd globally) | InnovationVista 2026 |
| AI monetization rate (manufacturing) | 17% | InnovationVista 2026 |
| Manufacturers using generative AI for marketing | 76% | Content Marketing Institute |
Sources: iFactory, InnovationVista 2026, ManufacturingLeadGeneration.
Analytics ROI: Real Numbers from 1,000+ Manufacturing Plants
The most comprehensive dataset on manufacturing analytics ROI comes from iFactory's aggregation of over 1,000 discrete manufacturing plants. These are not projections or vendor benchmarks — they represent statistically aggregated, measured outcomes from facilities ranging from 50 to 5,000 employees.
The four categories below account for over 80% of measurable savings from analytics deployments:
| Savings Category | Median Annual Savings (per Plant) | How It Delivers |
|---|---|---|
| Downtime Reduction | $184,000 | Real-time visibility into downtime patterns, faster changeovers, root cause analysis |
| Scrap & Rework | $127,000 | Real-time quality monitoring, immediate defect detection at point of production |
| Labor Efficiency | $103,000 | Automated data collection, reduced reporting time, operator performance feedback |
| Energy Optimization | $73,000 | Idle-time detection, peak-demand management, equipment scheduling |
Combined, these four categories deliver a median $487,000 in annual savings per plant with a 14-month payback. Twenty-five percent of plants achieve payback in under eight months, making analytics one of the fastest-returning capital investments in modern manufacturing.
Data and BI Maturity Across Manufacturing
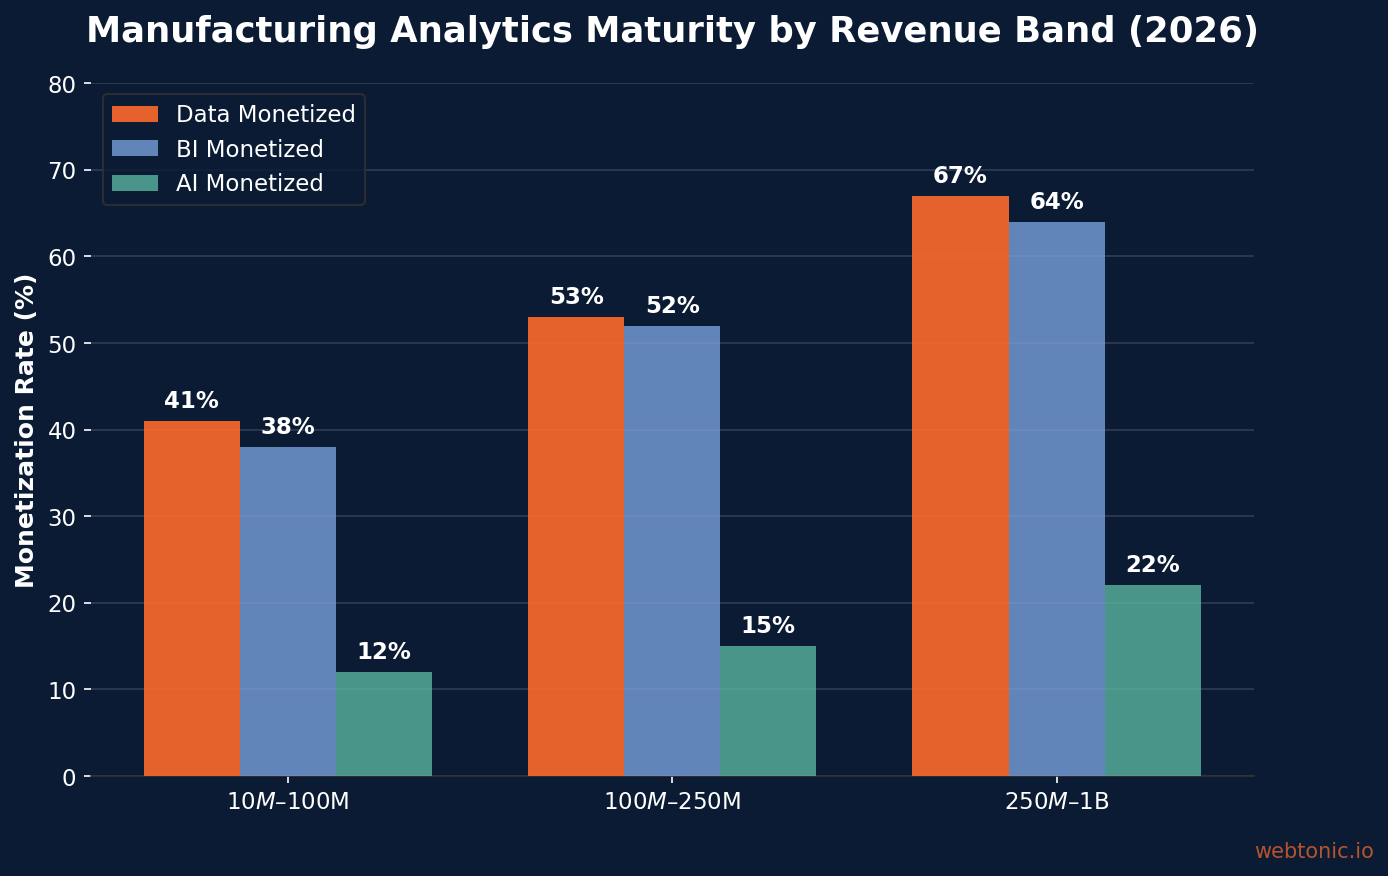
Not all manufacturers are at the same stage of analytics adoption. The InnovationVista 2026 Mid-Market Analytics Maturity Benchmark surveyed manufacturers across three revenue bands and three maturity levels — Stabilized, Optimized, and Monetized — across Data, BI, and AI dimensions.
The results reveal a pattern: manufacturers have built the data foundation but struggle to monetize it beyond dashboards.
| Revenue Band | Data Stabilized | Data Optimized | Data Monetized | BI Monetized | AI Monetized |
|---|---|---|---|---|---|
| $10M–$100M | 92% | 71% | 41% | 38% | ~12% |
| $100M–$250M | 96% | 84% | 53% | 52% | ~15% |
| $250M–$1B | 98% | 92% | 67% | 64% | ~22% |
Key insight: 92%–98% of manufacturers have stabilized their data warehouse infrastructure (scheduled ETL, central warehouse), driven by ERP consolidation and IoT monitoring requirements. But only 38%–64% have achieved monetized BI practices — meaning predictive analytics, scenario planning, and automated decision-making embedded in workflows. AI monetization sits below 22% even for the largest manufacturers, well below the cross-industry midpoint.
This gap represents both a challenge and an opportunity. Companies investing in advanced analytics capabilities today are building a competitive moat that smaller or slower-moving competitors cannot easily replicate. Our data intelligence services help manufacturers bridge this gap between data collection and actionable insight.
Manufacturing Plant Performance Benchmarks
Analytics adoption is only valuable if it moves the operational metrics that drive revenue. Here are the baseline performance ranges across 1,000+ manufacturing plants, providing the context for where analytics delivers the most impact:
| Metric | 25th Percentile | Median | 75th Percentile |
|---|---|---|---|
| OEE Score | 45% | 62% | 78% |
| First-Pass Yield | 81% | 91% | 97% |
| Schedule Attainment | 65% | 82% | 92% |
| Labor Efficiency | 60% | 76% | 88% |
Source: iFactory, 1,000+ plants.
Plants below the 25th percentile have the largest performance gap and therefore the highest potential ROI from analytics investment. A facility running at 45% OEE has far more room for improvement than one already at 78%. The median OEE of 62% means the typical manufacturing plant is operating well below world-class benchmarks (85%+), confirming that most facilities have significant untapped capacity that analytics can unlock.
Marketing Analytics and Automation ROI for Manufacturers
Analytics is not limited to the plant floor. Manufacturing marketing teams using analytics and automation are seeing measurable returns across lead generation, conversion, and customer retention.
- 80% of manufacturers using marketing automation report gains in lead generation, and 77% see improved conversion rates (MarketScale 2026).
- Manufacturers using marketing analytics improve campaign performance by 29% (Marketing LTB 2026).
- CRM-integrated manufacturers improve customer retention by 24% (Marketing LTB 2026).
- 73% of manufacturing marketers use multi-touch attribution models, with 45% using AI-driven attribution tools (ZipDo).
- Manufacturing firms using automation reduce overall marketing costs by 18% while maintaining or increasing output (Marketing LTB 2026).
- Manufacturers with 32% faster lead response times attribute the improvement to marketing automation workflows (Marketing LTB 2026).
- 76% of manufacturers now use generative AI tools for marketing purposes, from content creation to campaign analysis (Content Marketing Institute via ManufacturingLeadGeneration).
The combination of operational analytics (plant-floor IoT, ERP data, predictive maintenance) and marketing analytics (attribution, CRM, automation) creates a unified data ecosystem that connects production capacity to pipeline demand. Forward-thinking manufacturers are using this integration to align their growth marketing investments with real operational capacity.
AI and Predictive Analytics Adoption in Manufacturing
While most manufacturers have adopted basic analytics, artificial intelligence and predictive analytics remain in early stages despite enormous potential. The data paints a picture of an industry on the cusp of an AI-driven transformation.
- AI monetization in manufacturing sits at just 17%, well below the cross-industry midpoint, despite manufacturing's second-highest data monetization score globally (InnovationVista 2026).
- Predictive maintenance reduces unplanned downtime by 22% on average within 12 months of deployment (iFactory).
- Energy consumption optimization through AI delivers $73,000 in median annual savings per plant via idle-time detection, peak-demand management, and scheduling (iFactory).
- Schneider Electric rebuilt its marketing organization around an AI-native model with role-specific AI agents connected to a shared intelligence layer, signaling how enterprise manufacturers are structuring AI adoption (Distribution Strategy Group).
- The BI-to-AI gap: manufacturers at 51.3% BI monetization but only 17% AI monetization shows the frontier challenge — the infrastructure exists, but the talent and deployment models to operationalize AI at scale do not yet match investment levels.
For manufacturers evaluating analytics investments, the message is clear: the foundational data layer is already in place for most firms. The competitive advantage now shifts to those who can move from descriptive dashboards to prescriptive and predictive systems that automate operational decisions.
Industrial Data Platforms and the ERP-to-Analytics Pipeline
The backbone of manufacturing analytics is the ERP system — the transactional layer that captures every production order, purchase, shipment, and quality record. Modern analytics begins where ERP reporting ends. Big data analytics platforms like Snowflake and Databricks have built manufacturing-specific acceleration programs that connect ERP data (SAP, Oracle, Epicor Kinetic) with IoT sensor feeds to enable real-time decision-making.
According to InnovationVista, the primary driver of 92% data stabilization in smaller manufacturers is ERP consolidation. Plants are unifying their enterprise resource planning systems into central data warehouses, creating the foundation for KPI dashboards, predictive models, and automated alerts.
IoT sensor networks generate enormous data volumes on the shop floor — temperature, vibration, pressure, cycle time — and this data feeds directly into analytics platforms for predictive maintenance and quality monitoring. The Industrial Internet of Things (IIoT) is the primary data source for the $184,000 in downtime reduction savings documented across 1,000+ plants.
Product lifecycle management (PLM) analytics extend the picture beyond the factory floor, tracking design iterations, engineering changes, and warranty data to identify systemic quality issues before they scale. Combined with Google Analytics and marketing attribution data, manufacturers are building unified dashboards that connect every KPI from production output to pipeline revenue.
Global adoption patterns vary: Deloitte's manufacturing outlook highlights that European Union manufacturers lead in sustainability analytics (driven by ESG regulation), while Japan leads in predictive maintenance maturity. U.S. manufacturers dominate in marketing analytics adoption, with 76% now using generative AI for marketing content and campaign optimization.
Best Practices for Manufacturing Analytics Implementation
- Start with high-ROI use cases. Downtime reduction ($184K median savings) and scrap/rework ($127K) deliver the fastest payback. Begin analytics deployments where the dollar impact is largest and most measurable.
- Measure baseline before deploying. Plants that establish OEE, first-pass yield, and schedule attainment baselines before analytics implementation can quantify ROI and justify continued investment.
- Connect plant-floor data to marketing analytics. Link production capacity data with demand signals to avoid the common problem of marketing generating leads the plant cannot fulfill — or vice versa.
- Invest in data governance before AI. The InnovationVista survey shows that 92%+ of manufacturers have stabilized data infrastructure, but governance gaps (master data management, data catalogs) prevent monetization. Fix governance before pursuing AI use cases.
- Adopt multi-touch attribution for marketing. With 73% of manufacturing marketers using attribution models, firms without them are flying blind on campaign effectiveness. Partner with a specialized agency for proper attribution setup.
- Automate to reduce reporting burden. Manufacturing firms using automation cut marketing costs by 18%. The time savings from automated reporting and data collection compound quickly across teams.
- Plan for AI readiness. Even at 17% AI monetization, the market is projected to more than double by 2031. Building the data infrastructure now — clean, governed, accessible — positions firms to deploy AI when models and talent mature.
KPI Frameworks and Measurement Standards in Manufacturing Analytics
The effectiveness of any analytics deployment depends on which KPIs manufacturers choose to track. Based on industry benchmarks and the iFactory dataset, the most impactful key performance indicators for manufacturing analytics fall into four tiers:
- Tier 1 (Operational KPIs): OEE, first-pass yield, schedule attainment, and mean time between failures (MTBF). These are the metrics where IoT sensor data delivers the most direct ROI through real-time monitoring and predictive alerts.
- Tier 2 (Financial KPIs): Cost per unit, scrap rate as percentage of revenue, energy cost per unit produced, and labor cost per output. ERP integration is essential here — connecting production data with financial systems to generate accurate unit economics.
- Tier 3 (Supply Chain KPIs): On-time delivery rate, supplier quality index, and inventory turns. Big data analytics platforms like Snowflake enable cross-functional visibility that legacy ERP systems cannot provide, connecting supplier performance to production throughput in real time.
- Tier 4 (Strategic KPIs): New product introduction (NPI) cycle time, warranty cost ratio, and customer satisfaction. PLM analytics feed this tier, connecting engineering decisions to field performance and warranty data.
Deloitte's 2026 manufacturing outlook recommends that manufacturers adopt a balanced KPI scorecard approach, tracking no more than 12–15 KPIs across all four tiers to avoid dashboard overload. The most mature manufacturers integrate these KPIs into automated alerting systems where threshold breaches trigger workflow actions — not just dashboard color changes.
Regional benchmarking also matters: manufacturers exporting to the European Union must now track sustainability KPIs (carbon intensity, energy mix, waste ratios) alongside traditional production metrics. Japan's lean manufacturing heritage emphasizes a narrower set of operational KPIs but with deeper integration into continuous improvement workflows. Google Cloud's manufacturing analytics solutions and competitor platforms have added pre-built KPI dashboards specifically for these regional compliance requirements.
Frequently Asked Questions
What is the ROI of analytics in manufacturing?
Manufacturing analytics deployments deliver a median $487,000 in annual savings per plant with a 14-month median payback period, based on aggregated data from over 1,000 facilities. The four primary ROI categories are downtime reduction ($184K), scrap and rework elimination ($127K), labor efficiency ($103K), and energy optimization ($73K). Twenty-five percent of plants achieve payback in under eight months.
How mature is data analytics adoption in manufacturing?
Manufacturing has built strong data foundations — 92%–98% of manufacturers have stabilized data warehouse infrastructure depending on company size. However, monetized data practices (enterprise-wide MDM, data products) sit at only 41%–67%, and AI monetization stalls at approximately 17%. The gap between data collection and actionable insight remains the industry's primary challenge.
How large is the industrial analytics market?
The global industrial analytics market is valued at $44.57 billion in 2026 and is projected to reach $97.38 billion by 2031, according to Mordor Intelligence. Growth is driven by IoT adoption, predictive maintenance demand, and increasing regulatory compliance requirements across manufacturing sectors.
Does marketing analytics improve manufacturing performance?
Yes. Manufacturers using marketing analytics improve campaign performance by 29%, and those implementing CRM systems improve customer retention by 24%. Additionally, 80% of manufacturers using marketing automation report gains in lead generation, while 77% see improved conversion rates. Marketing automation also reduces overall marketing costs by 18%.
What is a good OEE score for a manufacturing plant?
The median OEE score across 1,000+ manufacturing plants is 62%, with the middle 50% of plants falling between 45% and 78%. World-class OEE is generally considered to be 85%+. Plants below the 25th percentile (45%) have the highest potential ROI from analytics investment. First-pass yield follows a similar pattern, with a median of 91% (range: 81%–97%).
Sources
ifactoryapp.com/analytics-reporting/manufacturing-analytics-roi-real-numbers-1000-plants
innovationvista.com/metrics/manuf-analytics-maturity-survey
marketscale.com — marketing automation for manufacturers
marketingltb.com/blog/statistics/manufacturing-marketing-statistics
manufacturingleadgeneration.com/manufacturing-marketing-statistics
zipdo.co/marketing-in-the-manufacturing-industry-statistics
distributionstrategy.com — Schneider Electric AI marketing


