Table of contents
Most locksmith reporting measures the wrong layer. Ad platforms show clicks; the business runs on answer rate, booked rate and net margin per source. Here is the 2026 data on what a locksmith dashboard should contain — and what building it by hand costs.
Key Takeaways
- Only 19% of data-team time is spent analysing data; 81% goes to finding, preparing and protecting it.
- 67% of marketing teams say data quality issues affect campaign decisions.
- 36.3% name siloed data as their top barrier; 34.4% name inconsistent metric definitions.
- 56% of marketers cannot find time to analyse their data; 32% check reports monthly or less.
- Manual reporting costs 4–12 hours per client per cycle — 30–75 hours a month at 15 clients.
- Automated pipelines cut assembly to under 30 minutes per client and stale-data escalations by 60–80%.
- Automated reporting correlates with 25% higher margins and 78% faster report turnaround.
- 89% of agencies cite poor communication and unclear reporting as a leading churn cause.
- Only 35% of firms fully trust the data they report on; 40% of analytics projects fail on data quality.
- Locksmith median miss rate 34%; no-shows 14% without a deposit vs 2% with one.
- Average tickets: $178 rekey, $215 lockout, $248 transponder key — dashboards must segment by job type.
- Field-service software adoption: 48% basic FSM, 41% GPS, 34% online booking, 22% AI voice.
- A software seat costs about 0.8% of a trade employee’s payroll; 15 recovered minutes a week pays for it.
- One unproductive hour per tech per day equals 260 hours a year — $39,000 at a $150 billable rate.
1. The Seven-Number Locksmith Scorecard
Start from the decisions a locksmith actually makes: whether to extend coverage hours, whether to take another aggregator lead, whether a channel earns more budget. Seven numbers answer all three. Everything else belongs one click deeper.
| KPI | Why it belongs on page one | 2026 reference point |
|---|---|---|
| Leads by source | Budget cannot move without it | $34 average LSA cost per locksmith lead |
| Answer rate / miss rate | The lead fee is sunk either way | 34% median miss rate (was 38% in 2024) |
| Booked rate | Separates call volume from revenue | Locksmiths book 55% of LSA leads |
| Average ticket by job type | Cheap calls are not equal calls | $178 / $215 / $248 rekey, lockout, transponder |
| Cost per booked job by source | The only true efficiency metric | Effective CPL rises to $52 at a 35% miss rate |
| Aggregator share of volume | Referral fees never show in ad tools | 25–35% of ticket; keep share under 30% |
| Review velocity | Compounds local visibility | 76% of homeowners avoid sub-4.5-star firms |
Two of those numbers are unique to this trade. Locksmith platform data shows no-show rates of 14% when no deposit is collected against 2% when one is, and Spanish-first calls reaching 42% of volume in Sun Belt metros — both operational levers that a generic marketing dashboard will never surface.
2. Reporting Is Where Marketing Time Goes to Die
The reporting layer is expensive long before anyone learns anything from it. Agency benchmarking puts manual reporting at 4–12 hours per client per cycle, while a 2026 reporting guide puts a 15-client agency at 30–75 hours a month — 20–25% of billable capacity, or $4,500–$11,250 of foregone time at a $150 hourly rate.
Automation changes the shape of the work rather than the volume of data: assembly drops to under 30 minutes per client per month, escalations about stale numbers fall 60–80%, and the breakeven at a 10-client agency typically lands inside 60 days. Agencies running automated workflows report about 25% higher margins and 78% faster turnaround.
| Portfolio size | Manual reporting hrs/mo | Automated hrs/mo | Hours recovered |
|---|---|---|---|
| 5 clients | 45 | 5 | 40 |
| 12 clients (worked example) | 168 | 18 | 150 |
| 15 clients | 30–75 | ≤8 | 22–67 |
| Single locksmith shop (owner-run) | 2–4 | Under 0.5 | 1.5–3.5 |
The retention argument is stronger than the efficiency one. 89% of agencies report that poor communication and unclear reporting are leading causes of client churn, and digital agency client tenure averages 22 months — so every hour moved from assembly into interpretation is spent on the thing that renews the contract.

3. The Data-Silo Tax
Dashboards fail for boring reasons. IDC-based analysis finds teams spending only 19% of their time analysing data — 20% searching for it, 37% preparing it and 24% protecting it. AppsFlyer’s 2026 survey names siloed data the single most cited barrier at 36.3%, with inconsistent measurement definitions at 34.4% and unclean data at 26.1%.
For a locksmith shop the silos are concrete: Local Services Ads counts charged leads, the call tracker counts answered calls, the job board counts completed tickets, and the aggregator invoice subtracts 25–35% somewhere nobody reads. Three systems, three definitions of "lead", and a dashboard that cannot reconcile to the bank account.
| Data-quality metric | 2026 figure | Consequence for reporting |
|---|---|---|
| Marketing teams reporting data-quality issues | 67% | Decisions made on numbers nobody defends |
| Firms fully trusting their reported data | 35% | Dashboards get overridden by gut feel |
| Analytics projects failing on data quality | 40% | Tooling spend without behaviour change |
| CRM records with a quality issue | 42% | Source attribution breaks at intake |
| Marketers who cannot find time to analyse | 56% | Reports produced, never read |
| Teams checking reports monthly or less | 32% | Weekly operational drift goes unnoticed |
The fix is not a bigger dashboard. It is one written definition per metric, one system of record per number, and a reconciliation column that shows where two sources disagree. Our data intelligence practice builds that layer before any visual work starts.
4. Reporting Cadence That Matches Emergency Demand
Monthly reporting is structurally blind for an emergency trade. If coverage broke in week three, a month-end report reveals it five weeks later — after the ad budget is spent and the callers have booked elsewhere. Cadence should scale with spend and volatility.
| Situation | Cadence | Format | Primary metric watched |
|---|---|---|---|
| Under $5,000/mo spend | Monthly | Live dashboard + PDF | Cost per booked job |
| $5,000–$25,000/mo | Monthly + weekly summary | Dashboard + call | Booked rate by source |
| $25,000+/mo or multi-metro | Weekly + monthly deep dive | Live dashboard + review | Net margin per source |
| New campaign launch | Daily for 2 weeks | Dashboard alert | Answer rate and lead quality |
| Peak after-hours season | Daily miss-rate check | Automated alert | Miss rate vs 34% benchmark |
Alerting matters more than charts here. A miss-rate alert that fires when the day’s answer rate drops below target is worth more than a beautiful monthly deck, because 39% of locksmith calls arrive between 6 PM and midnight and coverage failures are same-day problems.
5. What the Trade Is Actually Instrumented With
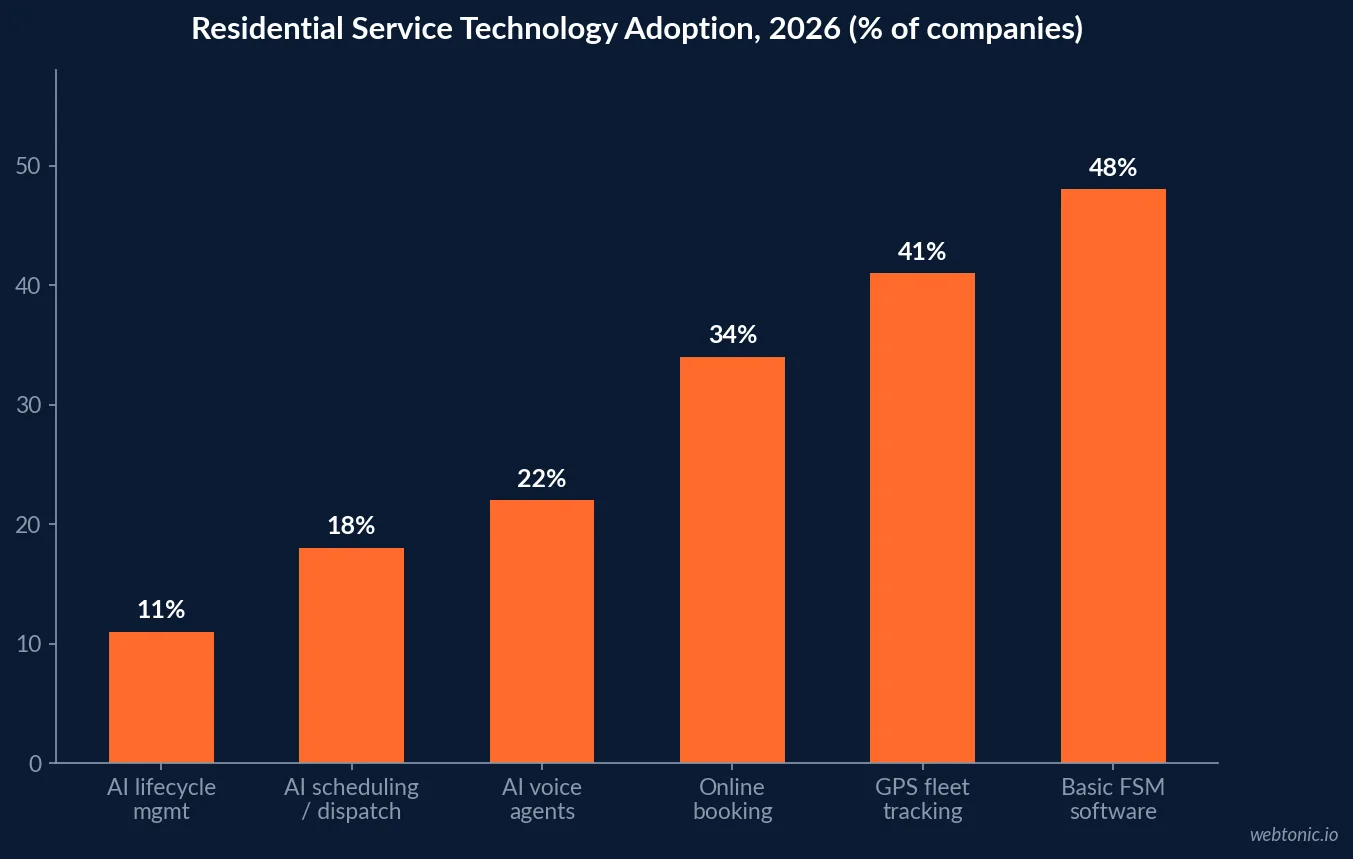
Dashboards depend on upstream systems, and residential-service adoption is still patchy. Data from 800+ residential service companies shows 48% on basic field-service software, 41% with GPS fleet tracking, 34% offering online booking, 22% using AI voice agents and just 11% running AI customer-lifecycle management.
The performance gap between instrumented and uninstrumented operators is now the headline finding of the sector: AI-adopting companies (about 17% of the market) grew revenue 47% year over year against 8% for traditional operators, with margins expanding from 8% to 14%. Measurement is not the cause of that gap, but nothing in it is visible without measurement.
| Capability | Adoption | Reported ROI multiple | Dashboard field it unlocks |
|---|---|---|---|
| Basic FSM software | 48% | 4x | Job status, ticket value |
| GPS fleet tracking | 41% | 6x | Response time, route cost |
| Online booking | 34% | 8x | Self-serve conversion rate |
| AI voice agents | 22% | 21x | Answer rate, after-hours capture |
| AI scheduling / dispatch | 18% | 24x | Technician utilisation |
| AI lifecycle management | 11% | 9x | Retention, repeat-job rate |
Cost is rarely the blocker. Field-service software benchmarking puts a seat at roughly 0.8% of an average trade employee’s payroll, paying for itself if it recovers 15 minutes of billable time per technician per week. The counterfactual is expensive: one unnecessary hour a day per technician is 260 hours a year, or $39,000 at a $150 billable rate.
6. Building the Dashboard: A Practical Stack
A locksmith does not need a warehouse. It needs three connected layers and a discipline about definitions.
- Source layer: Local Services Ads, Google Ads, GA4, call tracking, job management, review platform.
- Join layer: one lead ID carried from call to ticket — the single hardest and most valuable step.
- View layer: one live page with the seven KPIs, plus a second page for job-type economics.
- Alert layer: daily miss-rate and spend-pacing alerts to a phone, not an inbox.
- Definition doc: one line per metric, including what is excluded (spam, wrong-area, aggregator).
Tool economics are forgiving at this scale: per-client reporting platforms run roughly $12–$18 per client per month, Looker Studio is free with paid connectors, and KPI-dashboard products span $47–$399 a month. The expensive part remains the join layer, which is why it should be designed before the first chart. Pair it with the acquisition benchmarks in our locksmith Google Ads statistics and the conversion picture from our locksmith landing page data.
7. Where AI Actually Helps the Reporting Layer
AgencyAnalytics’ 2026 benchmarks report 79% of agencies saving five or more hours a week with AI, with reporting and performance summaries the leading use case at 42%, and agentic workflow automation already running at 38% of agencies. Notably, 58% increased human oversight at the same time.
That caveat matters more than the headline. Analytics survey data shows only 35% of firms fully trust the data behind their reports and 40% of analytics projects failing on data quality. Generated commentary on an unreconciled dataset produces confident, wrong narratives faster than a human could. Use AI for summarisation and anomaly flagging; keep the definitions and the reconciliation human.
8. Locksmith Reporting Versus Other Trades
The trade’s reporting profile is defined by small tickets, high volume variance and after-hours concentration. That pushes dashboards toward operational metrics and short cadences rather than the quarterly pipeline views used in higher-ticket trades.
| Dimension | Locksmith | Higher-ticket trades (roofing, restoration) | Reporting implication |
|---|---|---|---|
| Average ticket | $178–$248 | $8,200 (roofing) | Volume dashboards, not deal dashboards |
| Decision window | Minutes | Days to weeks | Daily alerts beat monthly decks |
| Booked rate | 55% | 22–28% | Booked rate is the honest KPI |
| After-hours share of demand | 39% | Storm-driven spikes | Coverage reporting is mandatory |
| Monthly conversions | 20–50 | 50–200 | Weekly aggregation, not daily models |
| Aggregator exposure | 25–35% of ticket | Shared-lead fees | Net margin per source, not CPL |
For the wider channel context see our locksmith digital marketing statistics, and our growth marketing team if you would rather have the reporting layer built than maintained.
9. Reporting Mistakes That Cost Locksmiths Money
Five failure patterns show up repeatedly in trade dashboards:
- Reporting leads, not booked jobs. At a 34% miss rate, lead counts overstate demand capture by a third.
- Blending job types. A $178 rekey and a $248 transponder job have different margins and different channels.
- Ignoring aggregator fees. A 25–35% referral cut can invert the ranking of your best-looking source.
- Monthly-only cadence. Emergency demand breaks and recovers inside a single week.
- No definition doc. With 34.4% of teams citing inconsistent definitions, undocumented metrics guarantee disputes.
None of these require new software. They require deciding which number is the truth and reporting it every week. If you want a scorecard built around your own job mix, get in touch.
Frequently Asked Questions
What KPIs belong on a locksmith marketing dashboard?
Seven, and only seven at the top level: leads by source, answer rate (or its inverse, miss rate), booked rate, average ticket by job type, cost per booked job by source, aggregator share of volume, and review velocity. Locksmith platform data makes the case for each: the median shop misses 34 percent of calls, no-show rates swing from 14 percent to 2 percent depending on whether a deposit was collected, and tickets range from $178 for a four-door rekey to $248 for a transponder key. A dashboard that reports impressions and clicks above those numbers is reporting the wrong layer of the business.
How often should a locksmith review marketing reporting?
Weekly for operations, monthly for strategy. Emergency demand moves week to week and after-hours coverage decisions cannot wait for a month-end PDF; the widely cited failure mode of monthly reporting is that a campaign which broke in week three is discovered five weeks later, after the budget is gone. Agency practice mirrors this: sub-$5,000 monthly spend gets a monthly report plus a live dashboard, $5,000 to $25,000 gets monthly plus a weekly summary, and campaign launches get daily reads for the first two weeks.
Is a dashboard worth it for a one- or two-truck shop?
Yes, but a small one. The reporting problem at that size is not volume, it is that nobody has time: research on data teams finds only 19 percent of time is spent analysing data while 81 percent goes to finding, preparing and protecting it, and 56 percent of marketers say they cannot find time to analyse what they already collect. A single-page live dashboard covering leads, answer rate, booked rate and cost per booked job takes an afternoon to wire up and removes the monthly spreadsheet ritual entirely.
What does manual reporting actually cost?
Between 4 and 12 hours per client per reporting cycle at agency scale, which is 30 to 75 hours a month for a 15-client shop and roughly one full-time employee doing assembly work. Automated pipelines cut assembly to under 30 minutes per client per month, reduce client escalations about stale numbers by 60 to 80 percent, and correlate with about 25 percent higher margins. For an owner-operator the equivalent cost is the 2 to 4 hours a month spent exporting Local Services Ads, Google Ads and job-management data into one sheet.
Why do locksmith dashboards so often disagree with the accounting?
Because the data sits in silos with different definitions. Surveys put siloed data as the single most cited barrier to using data effectively at 36.3 percent, with inconsistent measurement definitions right behind at 34.4 percent, and 67 percent of marketing teams say data quality issues affect campaign decisions. In a locksmith shop the classic mismatch is a platform counting a charged lead, a call tracker counting an answered call and the job board counting a completed ticket, with aggregator referral fees of 25 to 35 percent never subtracted anywhere.
Sources
TheKeyBot — State of the Locksmith Industry 2026
1ClickReport — Client Reporting for Agencies 2026
US Tech Automations — Stop Manual Reporting 2026
AgencyAnalytics — 2026 Marketing Agency Benchmarks
Digital Applied — Marketing Analytics Statistics 2026
Nvecta — Hidden Costs of Data Silos 2026
PPC Land — AppsFlyer Measurement Survey 2026
Fieldproxy — Residential Service Industry Report 2026
Ample Express — State of Field Service Software 2026
Bella FSM — 2026 Field Service Report
WifiTalents — Business Analytics Statistics 2026