Table of contents

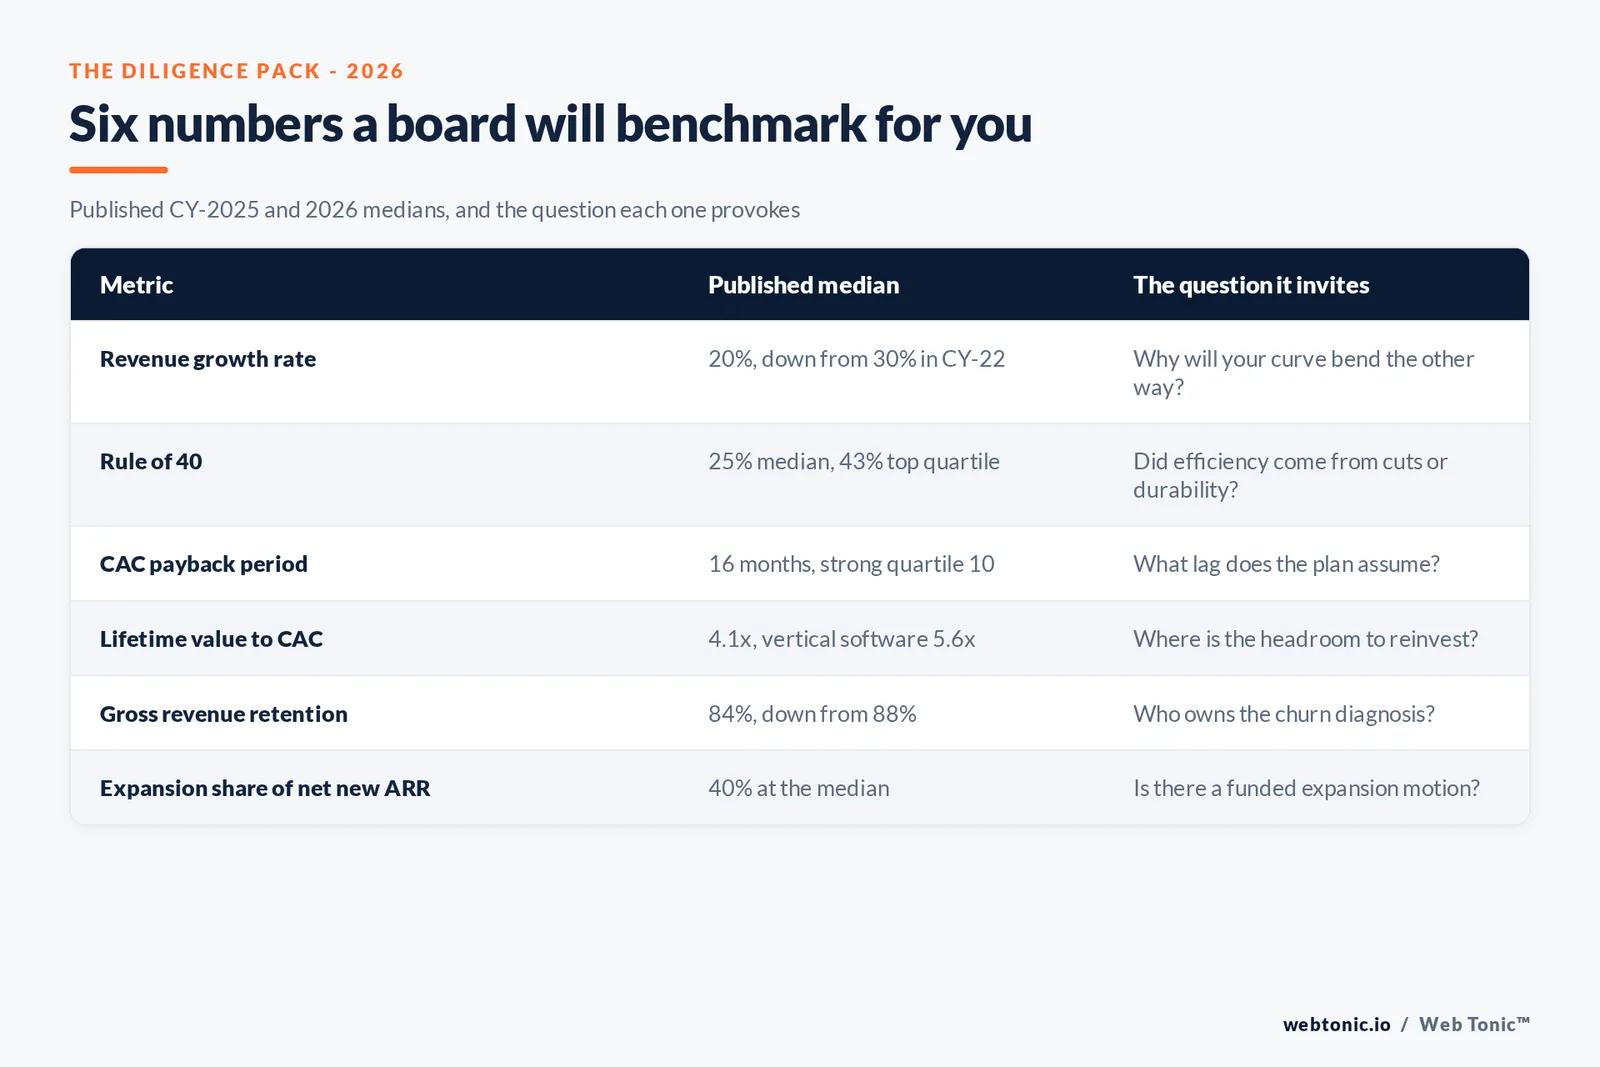
A growth plan becomes investor-ready when every number in it arrives with its benchmark attached. These are the published 2026 medians a board will reach for.
Key Takeaways
- Median B2B SaaS growth fell to 20% in CY-25.
- That is down from 30% in CY-22.
- The 75th percentile fell from 75% to 42%.
- Median Rule of 40 rose from 15% to 25%.
- The top quartile reaches 43% on Rule of 40.
- Median customer acquisition cost payback is 16 months.
- It improved from 18 months a year earlier.
- Median lifetime value to acquisition cost is 4.1 times.
- Vertical software reaches 5.6 times.
- Median blended acquisition cost ratio is USD 1.30.
- Median magic number is 1.37.
- Gross revenue retention fell from 88% to 84%.
- Net revenue retention is 95% for seat-based pricing.
- Usage-based pricing reaches 108%.
- Expansion supplies 40% of net new recurring revenue.
- Median revenue per employee is USD 175,000.
- Software gross margin holds at 80%.
- Marketing budgets sit at 9.0% of revenue.
The growth number has moved, and the plan has to admit it
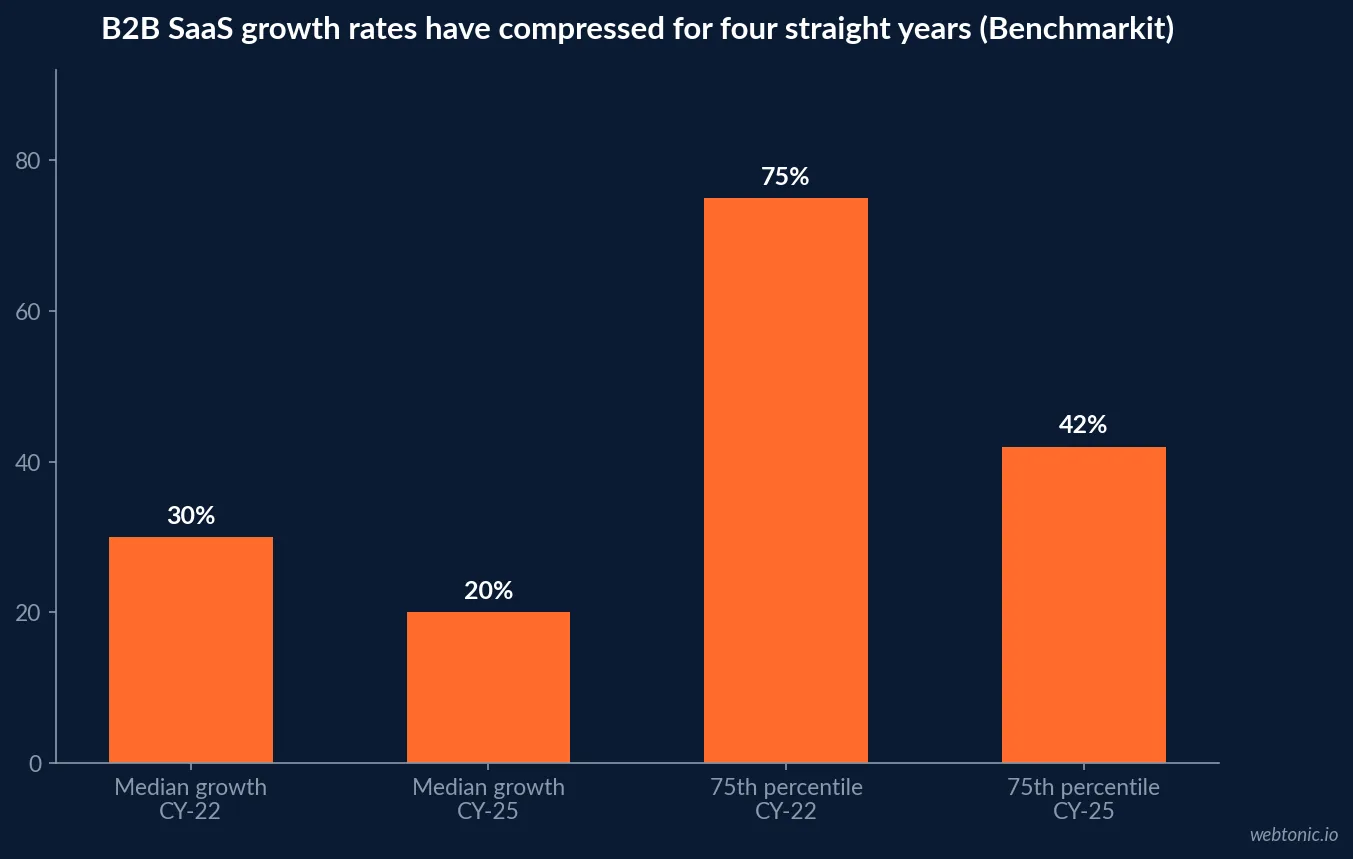
Benchmarkit's CY-2025 B2B SaaS benchmarks report median growth compressing to 20% from 30% in CY-22 - a fourth consecutive year of deceleration - with the 75th percentile falling from 75% to 42%. Hinge's 2026 High Growth Study reports the same direction in professional services: median growth of 9.9%, the lowest since 2018.
Plans still written against 2021 expectations get marked down for judgement, not ambition. Anchoring to the current median and explaining the delta is a stronger position than promising a reversal of a four-year trend.
| Growth measure | Latest reading | Prior reading | What a board infers |
|---|---|---|---|
| Median growth rate | 20% | 30% in CY-22 | Deceleration is structural, not cyclical |
| 75th percentile growth | 42% | 75% in CY-22 | The upside case has thinned |
| Median Rule of 40 | 25% | 15% | Efficiency improved fast |
| Top-quartile Rule of 40 | 43% | Not reported | Above the investor threshold |
| Professional services median growth | 9.9% | Lowest since 2018 | Services face the same squeeze |
Efficiency is read before pipeline
Benchmarkit puts median customer acquisition cost payback at 16 months, improved from 18, with the median lifetime value to acquisition cost ratio at 4.1 times - above the widely cited 3.0 threshold - vertical software at 5.6 times, a median blended acquisition cost ratio of USD 1.30 of sales and marketing spend per new dollar of recurring revenue, and a median magic number of 1.37, comfortably above the 1.0 line.
Those four numbers together tell an investor whether growth can be bought at all. A plan that asks for more spend without showing them is asking the board to take the efficiency case on trust.
| Unit economic | Median | Threshold in common use | Plan implication |
|---|---|---|---|
| CAC payback period | 16 months | Under 18 months | Sets the spend-to-return lag |
| Lifetime value to CAC | 4.1x | 3.0x | Headroom to invest exists |
| Vertical software LTV:CAC | 5.6x | 3.0x | Niche focus prices better |
| Blended CAC ratio | USD 1.30 | Under USD 1.50 | Cost of a new revenue dollar |
| Magic number | 1.37 | Above 1.0 | Sales and marketing spend is returning |
| Revenue per employee | USD 175,000 | Rising 17% year on year | 75th percentile at USD 253,000 |
The durability question hiding behind the efficiency gain
Benchmarkit is explicit that the efficiency improvement came from reduced sales, marketing and research investment rather than from a more durable business: the median company freed roughly 2% of revenue from sales and marketing, 8% from research and 7% from administration in a single year, while losing 6% of growth at the median. Gross revenue retention fell four points, from 88% to 84% - the largest single-year drop in the series.
Expect the board to test that trade directly. A plan that names the retention risk and funds a fix reads as diligence-ready; one that presents the Rule of 40 gain as a win does not.
Retention is where pricing model shows up
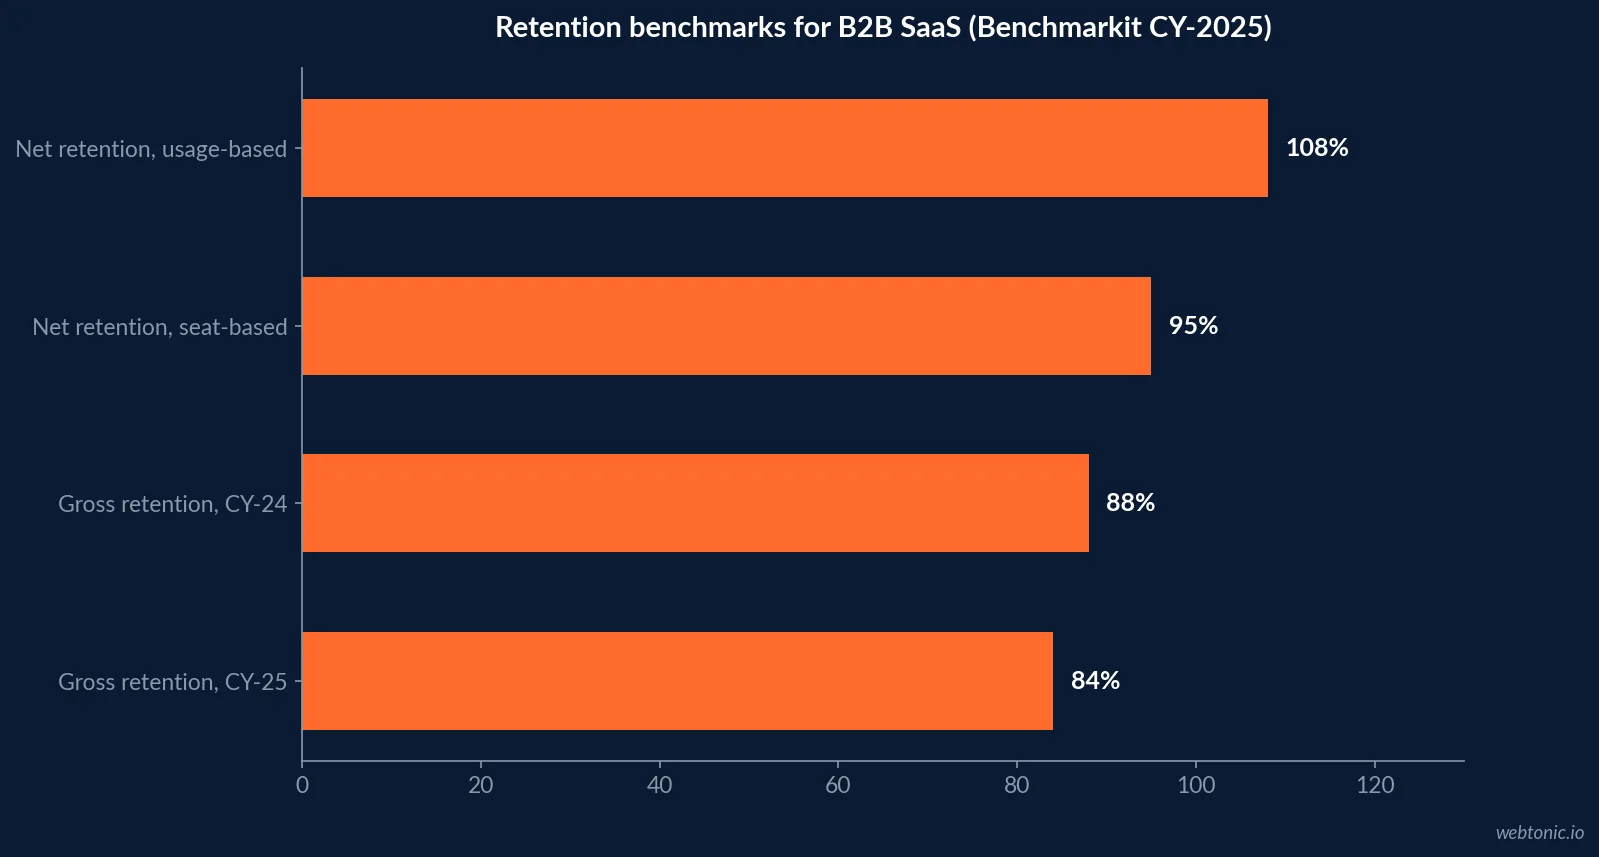
Benchmarkit reports median net revenue retention of 95% for seat-based companies - below the 100% threshold - against 108% for usage-based pricing, with expansion supplying 40% of net new recurring revenue at the median and 44% in the low-growth cohort. Software gross margin holds at 80%, stable across four years.
A growth plan for a seat-based business therefore has to carry an expansion motion or a pricing change. Presenting new-logo acquisition as the only lever, when expansion already carries 40% of net new revenue, is the gap most often found in diligence.
| Retention measure | Benchmark | Direction | What to put in the plan |
|---|---|---|---|
| Net revenue retention, seat-based | 95% | Below the 100% line | A named expansion motion |
| Net revenue retention, usage-based | 108% | Above the line | Guardrails on consumption pricing |
| Gross revenue retention | 84% | Down from 88% | A churn diagnosis with an owner |
| Expansion share of net new ARR | 40% | 44% in low-growth firms | Budget split between new and base |
| Software gross margin | 80% | Stable four years | No room to fund growth from margin |
The marketing spend line has to be benchmarked too
The CMO Survey 2026 reports marketing budgets at 9.0% of revenue and 9.6% of firm budgets, spend growth of 1.7%, headcount growth down 50% year on year and training down to 3.8% of marketing spend. Hinge finds high-growth firms spending 12.0% of revenue on marketing against 5.0% for no-growth firms.
The persuasive version of the marketing ask ties a spend level to a payback period rather than to a percentage. Our data and analytics practice builds that link before the plan goes to a board.
Where the plan is allowed to say growth comes from
The CMO Survey reports growth spend concentrated on market penetration at 56.4%, with product development at 22.9% - up from 19.2% - and new markets at 14.1%, down from 17.0%. It also reports a 68 to 32 present-to-future spend split and 70.6% of leaders shifting towards short-term results.
A plan whose headline is new-market entry is arguing against the distribution and will be asked to prove the exception. Penetration-led plans with an expansion motion are the easier case to defend.
The sales and marketing ratio a board will test
Benchmarkit reports sales and marketing spend rising with growth ambition: the 31% to 50% growth cohort carries the highest median sales and marketing ratio at 44% of revenue, while the median company cut roughly 2% of revenue from that line in a single year. Revenue per employee sits at USD 175,000, up 17% year on year, with the 75th percentile at USD 253,000.
A plan asking to grow faster than the median has to show the ratio moving with it. Asking for top-quartile growth on a median spend ratio is the fastest way to lose the room.
| Investment ratio | Benchmark | How to use it in the plan |
|---|---|---|
| Sales and marketing, high-growth cohort | 44% of revenue | Price the ambition honestly |
| Sales and marketing, median change | Cut about 2% of revenue | Explain the reversal you are proposing |
| Revenue per employee | USD 175,000 median | Show the headcount plan against it |
| Revenue per employee, 75th percentile | USD 253,000 | The efficiency case at scale |
| Magic number | 1.37 median | Evidence that the next dollar returns |
The operating cadence the plan implies
Benchmarkit warns against what it calls median drift: treating a 20% growth median as a stable target when it has declined four years running. That argues for quarterly re-benchmarking rather than an annual refresh.
On cadence, the supporting evidence is vendor research and should be read as such - EOS Worldwide reports firms running its system with a professional implementer growing 2.8 times faster in a TrueSpace and Gallup validated study of 305 companies. Treat the multiple carefully; the discipline of a fixed review rhythm is the transferable part.
| Review | Frequency | What gets re-benchmarked | Board artefact |
|---|---|---|---|
| Operating review | Monthly | Pipeline, CAC, payback trend | One-page scorecard |
| Plan review | Quarterly | Growth rate, Rule of 40, retention | Updated benchmark sheet |
| Investment case | Semi-annual | Spend level against payback | Revised marketing ask |
| Diligence refresh | Annual | Every median in the pack | Full data room update |
What the market backdrop adds
Gartner's 2026 CMO Spend Survey puts martech at 19.4% of budget, a five-year low against 26.6% in 2021, with 56% of that spend on consumption pricing and 41% of leaders adding usage controls. The Business Research Company sizes management consulting at USD 1,111.35 billion in 2026, heading for USD 1,407.09 billion by 2030.
Boards see those trends too. A plan that assumes rising tooling budgets or unlimited advisory support is arguing against both numbers.
The pack, in one page
Show growth against 20%, Rule of 40 against 25%, payback against 16 months, lifetime value to acquisition cost against 4.1 times, gross retention against 84%, expansion against 40% of net new revenue and revenue per employee against USD 175,000. Then state which of the seven your plan is deliberately trading away, and why.
That single sentence is what makes a plan investor-ready. If you want the marketing half of it built and instrumented, talk to us, see how our performance creative team ties spend to outcome, or start with our paid search practice.
Frequently Asked Questions
What KPIs belong in an investor-ready growth plan?
Seven, each shown against its published median: revenue growth rate (20% median in CY-25 B2B SaaS), Rule of 40 (25% median), customer acquisition cost payback (16 months), lifetime value to acquisition cost (4.1 times), blended acquisition cost ratio (USD 1.30), net and gross revenue retention (95% seat-based, 108% usage-based, 84% gross) and revenue per employee (USD 175,000). A plan that shows its numbers without the benchmark beside them invites the board to supply its own.
What growth rate should a plan assume?
Benchmarkit reports median B2B SaaS growth compressing to 20% in CY-25 from 30% in CY-22, with the 75th percentile falling from 75% to 42%. Hinge's 2026 High Growth Study puts median professional services growth at 9.9%, the lowest since 2018. Planning to a number the median is drifting away from is the most common reason a growth plan fails its first quarterly review.
What does an investor read before the marketing section?
Efficiency. Benchmarkit's CY-2025 data shows the median Rule of 40 rising from 15% to 25% and the median magic number at 1.37 - but also notes the improvement came from cutting sales, marketing, research and administrative spend, while gross retention fell four points from 88% to 84%. Expect questions about durability before questions about pipeline.
How should marketing spend be justified in the plan?
By benchmark and by outcome. The CMO Survey 2026 puts marketing budgets at 9.0% of revenue with spend growth of just 1.7%, while Hinge finds high-growth professional services firms spending 12.0% of revenue against 5.0% for no-growth firms. The defensible framing is a spend level tied to a payback period, not a percentage defended on its own.
How often should the plan be re-benchmarked?
Quarterly, because the medians move. Growth has decelerated for four consecutive years in Benchmarkit's series and gross retention posted its largest single-year drop in the latest reading. A plan benchmarked once at fundraise and never revisited will be compared against numbers the board has already updated.
Sources
Benchmarkit - CY-2025 B2B SaaS performance metrics benchmarks
Hinge Marketing - 2026 High Growth Study
The CMO Survey - Highlights and Insights Report 2026
Gartner 2026 CMO Spend Survey via Chief Marketer
EOS Worldwide - Companies with an implementer grew 2.8x faster
The Business Research Company - Management consulting services market report