



Table of contents
Lead-generation quizzes convert 40.1% of starters into leads, a figure that has barely moved in over a decade across 80 million-plus leads captured. Calculators convert fewer people but at higher intent. This page prices interactive marketing by funnel stage so the budget follows the format that actually fits the job, not the format that demos best.
Key Takeaways
- Lead quizzes convert 40.1% start-to-lead, stable since 2013.
- Quiz start-to-finish completion runs 65%.
- Service-provider quizzes convert near 50% start-to-lead.
- Calculators convert 10-30%, industry-dependent.
- Calculator leads run higher intent, closer to a purchase decision.
- Interactive content overall completes at 72.7% across 3.8 billion views analyzed.
- Average active engagement runs 112 seconds per interaction.
- Over 80 million leads have been generated through quiz-based lead magnets to date.
- 33% of B2B marketers are increasing experiential marketing investment in 2026.
- 32% are increasing owned-media investment, the budget line interactive assets sit under.
- 45% of B2B marketers are prioritizing AI-powered marketing tools for 2026, ahead of every other category.
- Course and coaching brands see the strongest quiz conversion, near 45% start-to-lead.
- Product-recommendation quizzes convert 37.6% start-to-lead.
- 1 billion-plus interactions came from active engagement, not passive views, in the Riddle dataset.
Budget the format to the funnel stage, not the demo
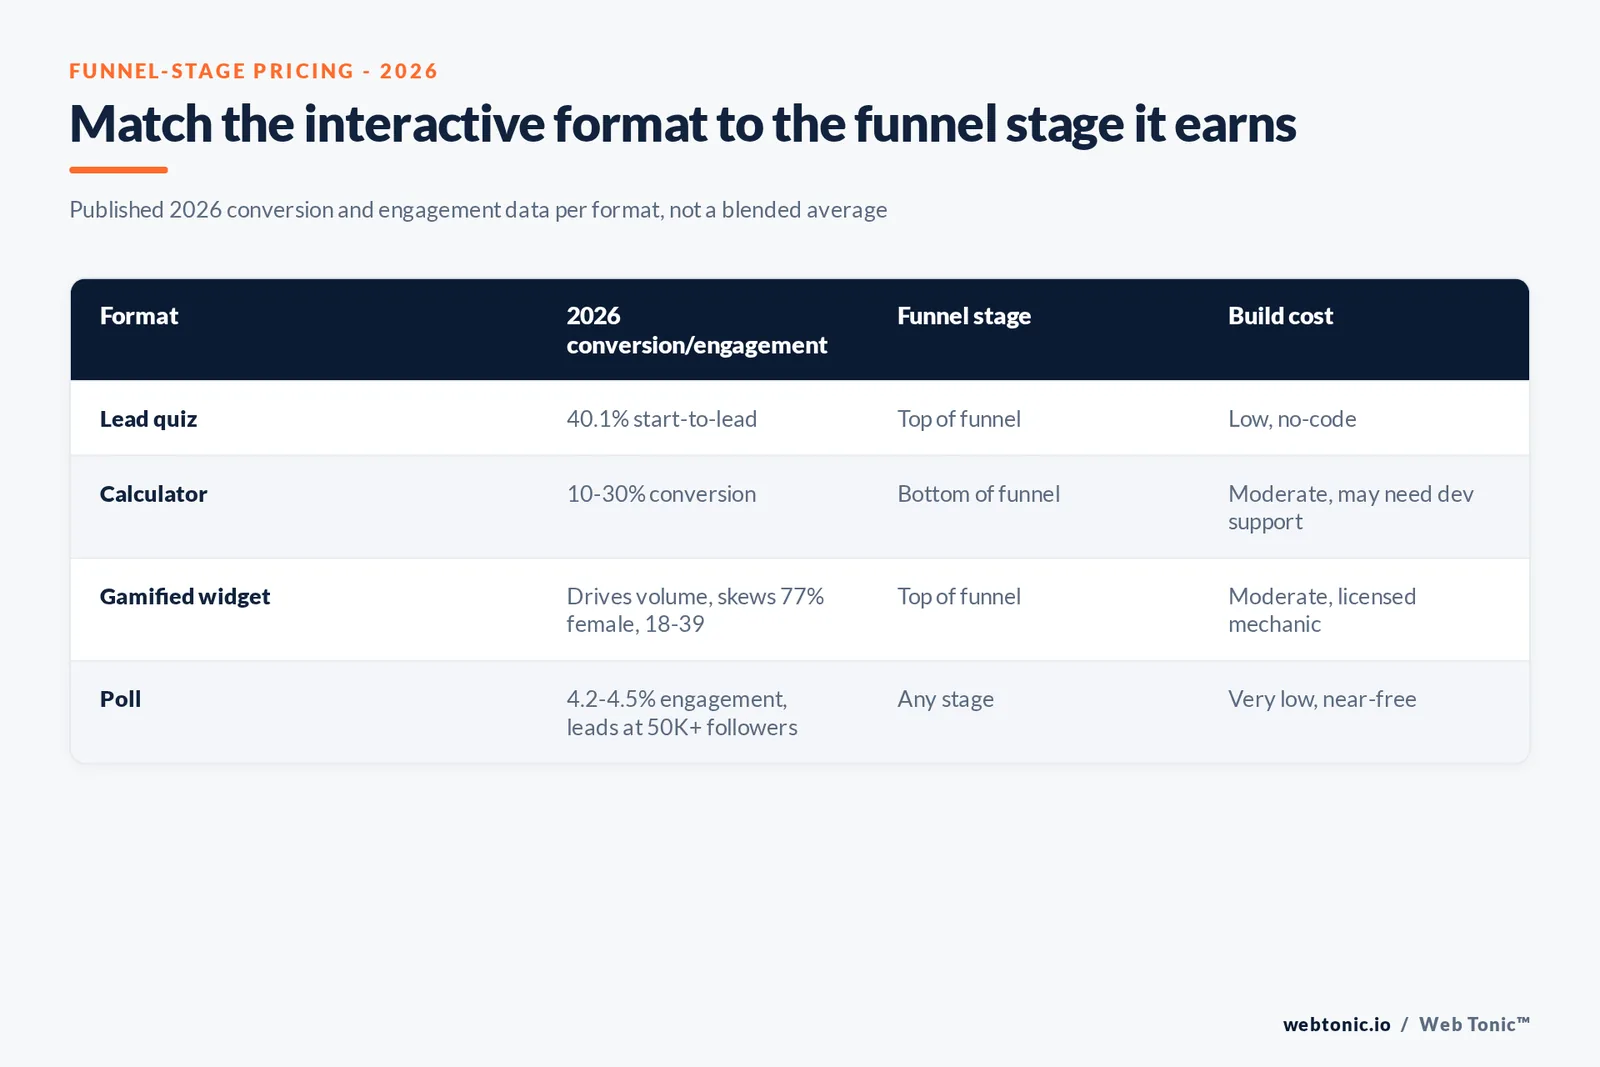
Interactive marketing covers tools with very different jobs: quizzes for top-of-funnel curiosity and list growth, calculators for bottom-funnel qualification, and polls or AR filters for pure engagement and reach. Treating "interactive content" as one budget line hides which format actually earns its build cost. Price them separately.
| Interactive format | Published 2026 conversion metric | Funnel stage | Source |
|---|---|---|---|
| Lead-generation quiz | 40.1% start-to-lead | Top of funnel | Interact, 80M+ leads analyzed |
| Quiz, course/coaching vertical | ~44.9% start-to-lead | Top of funnel | Interact 2026 report |
| Quiz, product-recommendation | 37.6% start-to-lead | Top/mid funnel | Interact 2026 report |
| Quiz, service-provider vertical | ~50% start-to-lead | Mid funnel | Interact 2026 report |
| Calculator | 10-30% | Bottom of funnel | Outgrow/MarketingProfs industry data |
| Interactive content overall completion | 72.7% | All stages | Riddle, 3.8B views analyzed |
Why quizzes and calculators are not interchangeable
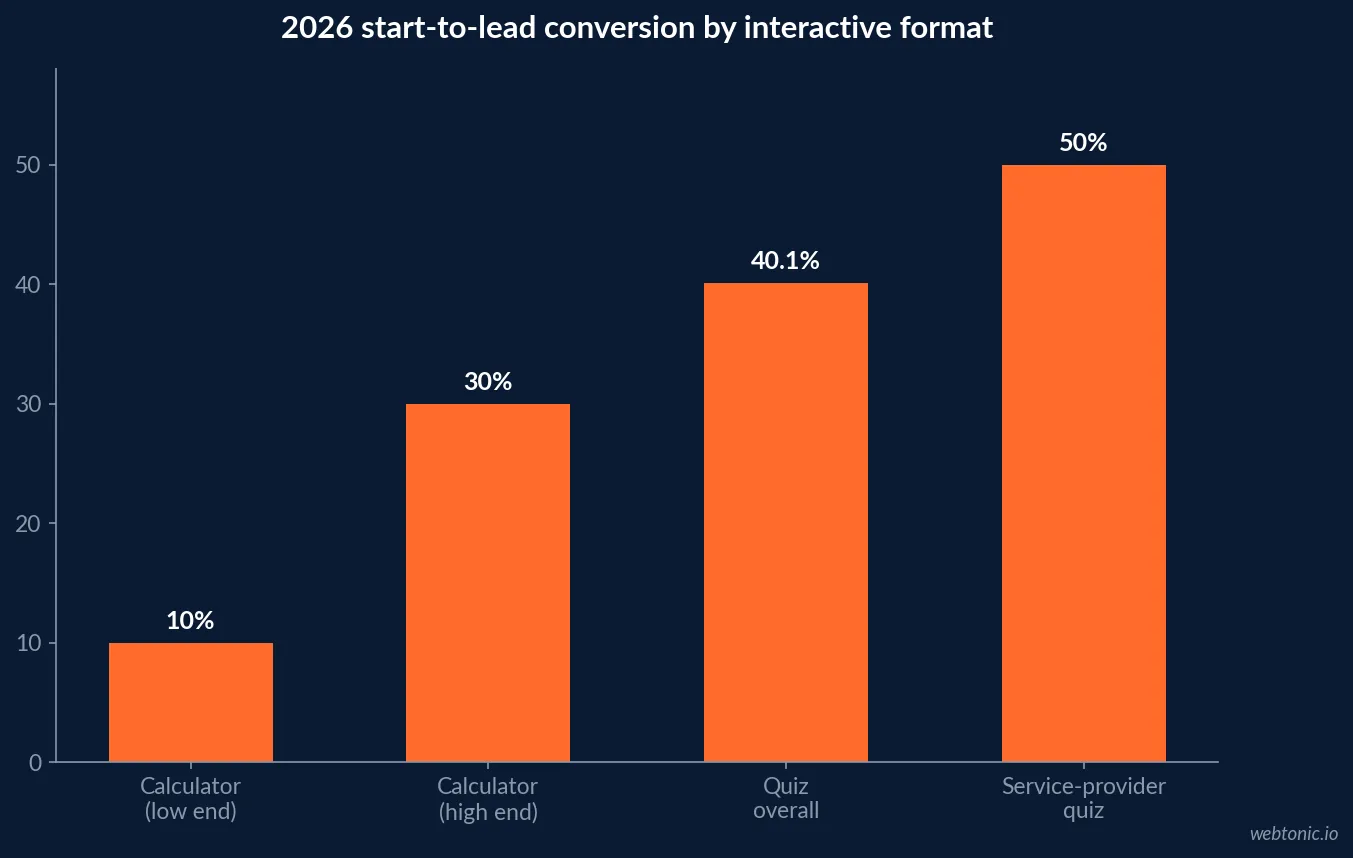
Interact's 2026 quiz conversion report, built on more than 80 million leads generated since the platform launched in 2013, found the overall start-to-lead rate has stayed at 40.1% for over a decade - remarkably stable for a tactic often pitched as novel. Start-to-finish completion runs at 65%, meaning the real drop-off happens at the final contact-information step, not mid-quiz.
Comparative analysis of quizzes against calculators puts calculator conversion at 10-30%, lower than a quiz, but the leads are typically decision-stage: someone using a cost or ROI calculator has already committed to comparing numbers, which is a stronger buying signal than curiosity alone.
| Metric | Lead quiz | Calculator | What it means for budget |
|---|---|---|---|
| Average conversion rate | 40.1% | 10-30% | Quizzes generate more raw leads per visitor |
| Lead quality | Medium to high | High | Calculator leads are closer to purchase |
| Build complexity | Low, no-code | Moderate, may need dev support | Calculators cost more to build |
| Best funnel placement | Top of funnel, awareness content | Bottom of funnel, pricing/product pages | Different budget lines, different KPIs |
How much engagement interactive content actually earns
Riddle's State of Interactive Content 2026 report, aggregated from more than 3.8 billion content views over the trailing 12 months, found over 1 billion of those views turned into active engagements, an overall completion rate of 72.7% and an average of 112 seconds of active engagement per interaction. That dwell time is the number to defend a build budget against, since it is far above what a static blog page or landing section typically earns.
| Engagement metric (Riddle, 2026) | Figure |
|---|---|
| Content views analyzed | 3.8 billion, trailing 12 months |
| Views converted to active engagement | 1 billion+ |
| Overall completion rate | 72.7% |
| Average active engagement time | 112 seconds per interaction |
What gamified formats add beyond quizzes and calculators
Gamification - instant-win mechanics, score-based challenges, spin-to-win widgets - is the third interactive category worth a separate line. Adictiz's analysis of 3,516 gamified campaigns and nearly 60 million sessions found participation skews heavily female (77.4% of the studied sample) and concentrates in the 18-39 age bracket, with smartphone as the dominant access device - reaching 100% mobile usage in fashion and beauty verticals specifically. The study splits mechanics into two families: chance-based instant wins, which carry a low entry barrier and drive mass participation volume (peaking around the December holiday period), and score-based games, which demand more cognitive investment but generate deeper engagement and repeat play.
The budget implication: a chance-based mechanic is the cheaper build for pure reach and email capture, while a score-based mechanic costs more to design but earns the replay behavior that a static quiz or calculator does not.
| Gamification metric (Adictiz, 2026) | Figure |
|---|---|
| Campaigns analyzed | 3,516 activation campaigns |
| Sessions analyzed | ~60 million |
| Female participation share | 77.4% of sample |
| Core age bracket | 18-39 |
| Mobile usage in fashion/beauty verticals | 100% |
| Peak participation period | Advent/December for chance-based mechanics |
Where the budget line actually sits
Interactive assets rarely get their own budget category - they are usually funded from owned media or experiential lines. The Content Marketing Institute's 2026 B2B research found 33% of B2B marketers increasing investment in events and experiential marketing and 32% increasing owned-media investment for 2026, the two categories quizzes, calculators and interactive tools are typically built and hosted under. AI tooling tops the list of 2026 investment priorities at 45%, ahead of both.
Budget the interactive asset as a build cost against an owned-media or experiential line, and budget its distribution separately against paid or organic social - a quiz with no traffic plan converts at 40.1% of nobody.
| 2026 B2B budget priority (CMI) | Share increasing investment |
|---|---|
| AI-powered marketing tools | 45% |
| Events and experiential marketing | 33% |
| Owned media (content, website, blog, email) | 32% |
| Paid media | 25% |
| Content personalization | 24% |
Where polls fit - a small budget line with a scale threshold
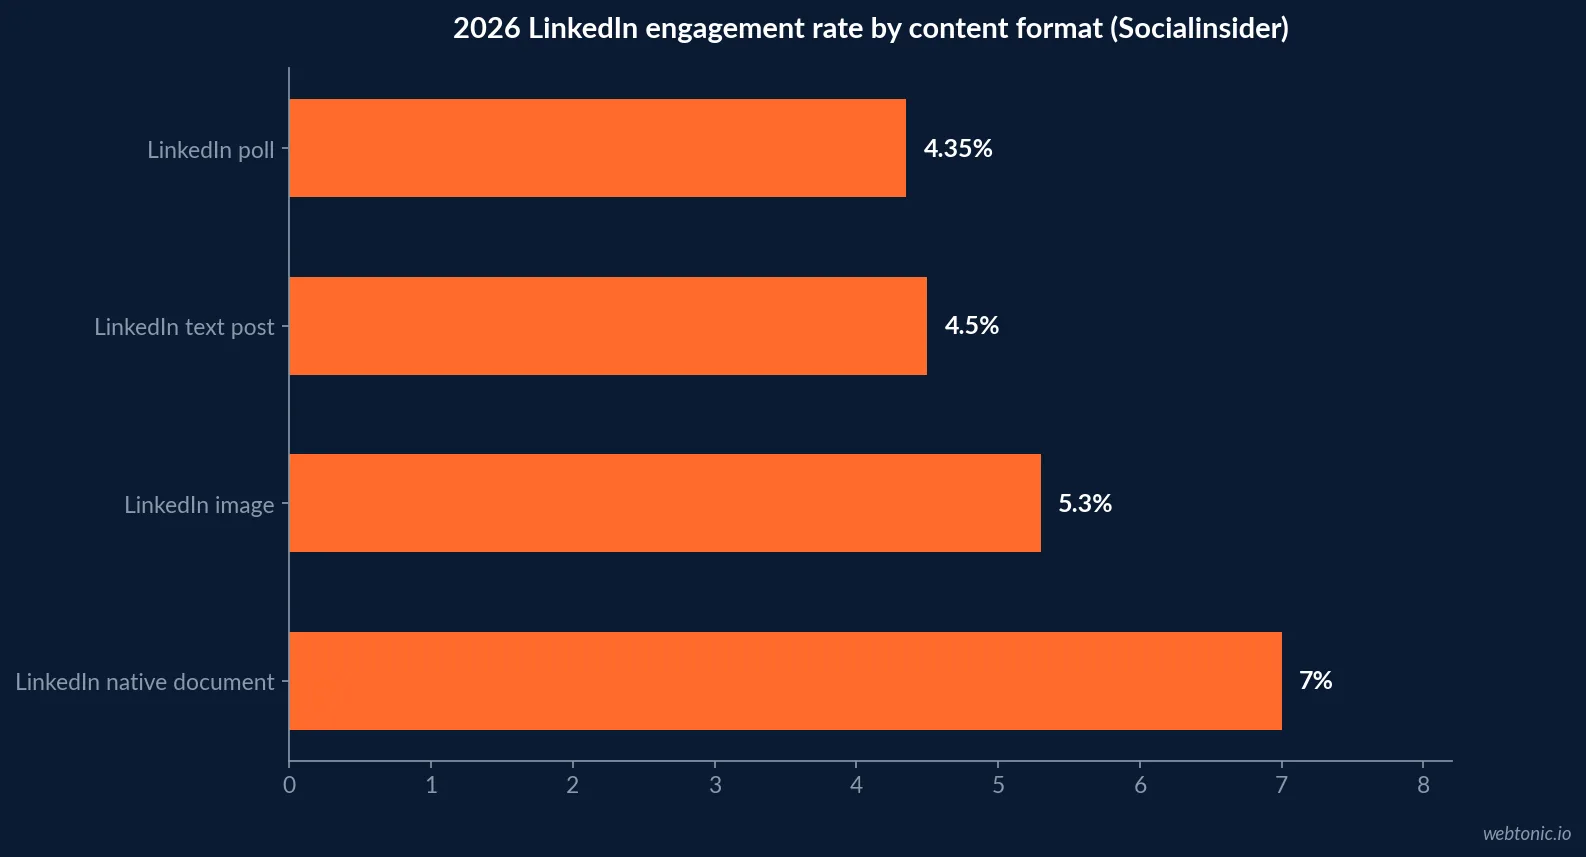
Polls are the cheapest interactive format to ship and the easiest to underrate. On LinkedIn, Socialinsider's 2026 organic benchmarks put poll engagement at 4.20-4.50%, trailing native document posts at 7.00% - but that changes at scale. Once a LinkedIn page crosses 50,000 followers, polls become the top-performing format for generating impressions, ahead of every other post type in the same benchmark set. Below that follower threshold, a poll is a low-cost engagement tactic; above it, a deliberate reach play. Below that scale threshold, treat a poll as a near-free addition to an existing content calendar rather than a line item that needs its own justification.
| Poll benchmark (2026) | Figure | Source |
|---|---|---|
| LinkedIn poll engagement rate | 4.20-4.50% | Socialinsider 2026 LinkedIn benchmarks |
| LinkedIn native document engagement rate (for comparison) | 7.00% | Socialinsider 2026 LinkedIn benchmarks |
| LinkedIn follower threshold where polls lead on impressions | 50,000+ followers | Socialinsider 2026 LinkedIn benchmarks |
Setting the budget without overbuilding
Start with the cheapest format that fits the funnel stage: a no-code quiz for top-of-funnel list growth, escalating to a calculator only once a page has enough bottom-funnel traffic to justify the dev time. Measure start-to-lead and start-to-finish separately - a low start-to-finish number points to a question flow that is too long, while a healthy finish rate with a weak lead-capture rate points to the final form, not the quiz content.
Our growth marketing practice briefs interactive assets alongside the paid and organic distribution plan that gets traffic to them, since the conversion data above only measures people who already arrived. For the broader content-strategy context, see our guide to building a paid search strategy that can route qualified traffic to a bottom-funnel calculator, or talk to us about briefing the format to your funnel stage.
Stacking formats instead of picking one
The formats above are not mutually exclusive budget lines - the highest-performing interactive programs stack them across the funnel rather than betting on a single asset. A typical sequence: a low-cost poll or gamified widget at the top of the funnel to build the list and generate first-party signal, a lead quiz in the middle of the funnel to segment that list and personalize follow-up, and a calculator at the bottom of the funnel once a prospect is comparing options seriously enough to plug in real numbers. Each asset should carry its own conversion target from the tables above, and none of them should be measured against a blended "interactive content" average that hides which one is actually earning its build cost.
Revisit the mix at least twice a year. Quiz conversion has held flat at 40.1% for over a decade precisely because the mechanic itself is mature - the variable that moves is whether the questions still match what the audience is actually curious about, which the Interact data suggests is the real driver of 2026's better-performing quizzes.
The audit worth running twice a year is simple: pull start-to-lead for every quiz, conversion rate for every calculator, and engagement rate for every poll or gamified widget, then compare each against its own format benchmark above rather than against last quarter's overall content number. A format sitting meaningfully below its benchmark usually has a fixable, format-specific cause - question length for a quiz, input complexity for a calculator, or timing for a poll - not a broader "interactive content is not working" problem.
Frequently Asked Questions
What is a good conversion rate for a marketing quiz?
40.1% start-to-lead is the benchmark to beat, drawn from Interact's data on more than 80 million quiz leads generated since 2013 - a figure that has stayed essentially flat for over a decade. Start-to-finish completion runs higher, around 65%, meaning most of the drop-off happens at the final lead-capture step, not mid-quiz.
Should I budget for a quiz or a calculator?
Match the tool to the funnel stage. Quizzes convert more people (40.1% start-to-lead) but skew top-of-funnel and curiosity-driven. Calculators convert fewer people (10-30%, industry-dependent) but the leads are further along, already comparing numbers before they hand over contact details. Budget quizzes for awareness and list growth, calculators for bottom-funnel qualification.
How much interactive content engagement actually happens?
Riddle's 2026 report, drawn from 3.8 billion content views over 12 months, found a 72.7% overall completion rate across interactive formats and 112 seconds of average active engagement per interaction - both far above typical static-page dwell time.
Is interactive content a budget line B2B marketers are actually funding in 2026?
It sits inside a broader owned-media and experiential push rather than its own line. The Content Marketing Institute's 2026 B2B research found 33% of marketers increasing investment in events and experiential marketing and 32% in owned media, the two categories interactive assets like quizzes, calculators and polls are typically budgeted under.
What is the biggest risk in an interactive content budget?
Building the interactive asset without a distribution plan. The conversion data above measures people who already reached the quiz or calculator; none of it accounts for the traffic cost of getting them there. Budget distribution and promotion alongside the build, not as an afterthought.
Sources
Interact - Quiz Conversion Rate Report 2026
Riddle - Interactive Content Statistics 2026, 3.8B views analyzed
Outgrow - Quiz vs Calculator for Lead Generation
Content Marketing Institute - B2B Content and Marketing Trends 2026
Adictiz - Gamification marketing analysis of 3,516 campaigns
Socialinsider - 2026 LinkedIn organic benchmarks


