



Table of contents
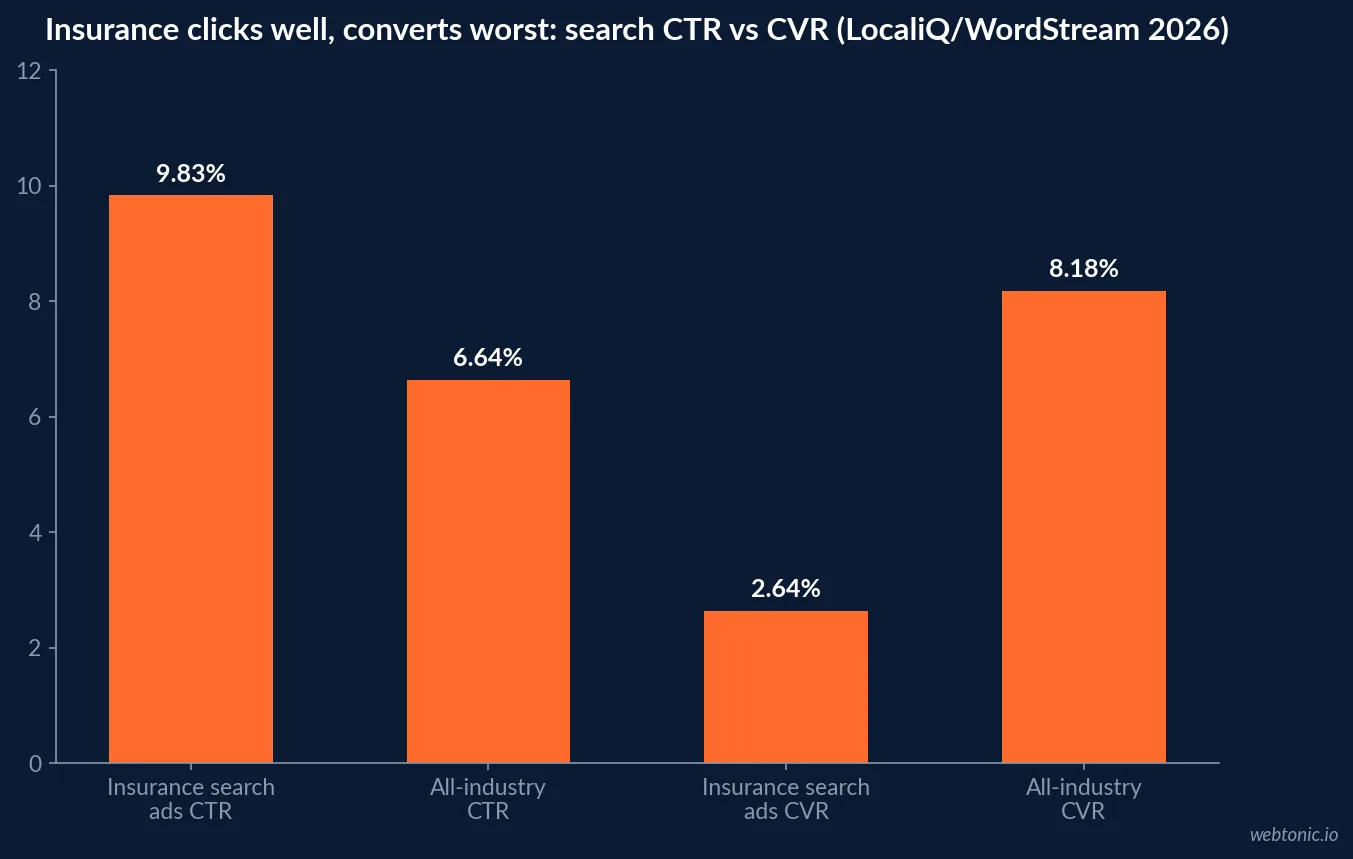
Insurance search ads get clicked at nearly double the average rate, yet the industry logs the lowest conversion rate Google tracks. That is not a demand problem - it is an attribution problem, and it traces to quote comparisons and phone calls a standard pixel never sees.
Key Takeaways
- Insurance search ads convert to Google-tracked goals at 2.64%, the lowest of 23 industries.
- The same category posts a 9.83% click-through rate, the second-highest tracked.
- Insurance shoppers now collect 3.5 quotes on average before buying.
- 47% of new auto and home policies are purchased digitally, up from 36% five years ago.
- Shopping-segment digital satisfaction fell to 523 of 1,000, down 12 points year over year.
- Only about a third of shoppers see a cross-carrier price comparison tool.
- Just 27% see a same-brand policy comparison tool on the insurer's own site.
- Just 11% of shoppers use a chatbot during the digital shopping journey.
- 61% of callers to high-stakes purchase businesses reach a live person.
- 35% of calls generated by digital marketing are qualified leads.
- 37% of phone leads convert during the call itself.
- Call answer rates vary from 54% to 69% across the industries Invoca measured.
- 59% of insurance consumers cannot reliably tell AI from a human agent.
- 64% of consumers blame the brand, not the AI vendor, for a bad automated interaction.
- Facebook traffic-campaign CTR for Finance and Insurance is 0.98%, the lowest tracked.
- Insurance carries the highest Facebook traffic CPC at $1.22.
- Auto insurance expenditure rose 6.1% to $1,127 in 2022, the latest NAIC-sourced figure.
The gap: high clicks, low recorded conversions
LocaliQ/WordStream's 2026 Google Ads benchmarks, drawn from 13,474 search campaigns running April 2025 through March 2026, put Finance and Insurance click-through rate at 9.83% - behind only Arts and Entertainment - while the same category's conversion rate is 2.64%, the lowest of any of the 23 industries measured. No other tracked vertical shows that combination of strong clicks and weak recorded conversions.
Read literally, the data says insurance ads attract the right eyes and then lose almost everyone. Read against how insurance is actually bought, it says something different: the buying decision keeps moving to a channel - a phone call, a call-back, a quote comparison over email - that the ad platform's pixel was never wired to count.
| Metric (2026) | Finance & Insurance | All-industry average | Source |
|---|---|---|---|
| Search ads CTR | 9.83% | 6.64% | LocaliQ/WordStream |
| Search ads conversion rate | 2.64% | 8.18% | LocaliQ/WordStream |
| Facebook traffic CTR | 0.98% | 1.71% | LocaliQ/WordStream (Facebook) |
| Facebook traffic CPC | $1.22 | $0.70 | LocaliQ/WordStream (Facebook) |
| Shopping-segment digital CSAT | 523 / 1,000 | n/a (insurance-specific study) | JD Power 2026 |
Where the missing conversions actually go
The JD Power 2026 U.S. Insurance Shopping Study, based on 12,437 auto insurance shoppers, found customers now collect 3.5 quotes on average before choosing a policy, the highest level in the study's 20-year history, and that 48% of new auto policies are now purchased digitally, up from 36% five years ago. Comparison shopping has moved online - but the comparison tools themselves have not kept pace, and that is where a marketing analytics stack starts losing the thread.
The companion 2026 U.S. Insurance Digital Experience Study reports the average shopping-segment satisfaction score fell to 523 on a 1,000-point scale, 12 points lower than the prior year, and that just 11% of customers use a chatbot even when one is offered. A shopper who cannot finish comparing prices on-site does not vanish from the funnel; they pick up the phone, and that call is where most attribution setups stop looking.
| JD Power 2026 shopping/digital finding | Figure | Attribution consequence |
|---|---|---|
| Average quotes collected before buying | 3.5 | Multiple sessions across devices split one buyer into several "leads" |
| New auto policies bought digitally | 48% (up from 36%) | Half the funnel now leaves a trackable digital trail - half still doesn't |
| Shopping-segment satisfaction score | 523 / 1,000 (-12 pts YoY) | Frustrated on-site shoppers exit to a phone call or a competitor |
| Shoppers seeing a cross-carrier price tool | ~33% | Two-thirds compare off-platform, invisible to on-site analytics |
| Shoppers seeing a same-brand comparison tool | 27% | Even the insurer's own upsell path is undertracked |
| Customers using a chatbot when offered | 11% | Chat transcripts undercount as a lead source despite the investment |
The call is the conversion event nobody logs
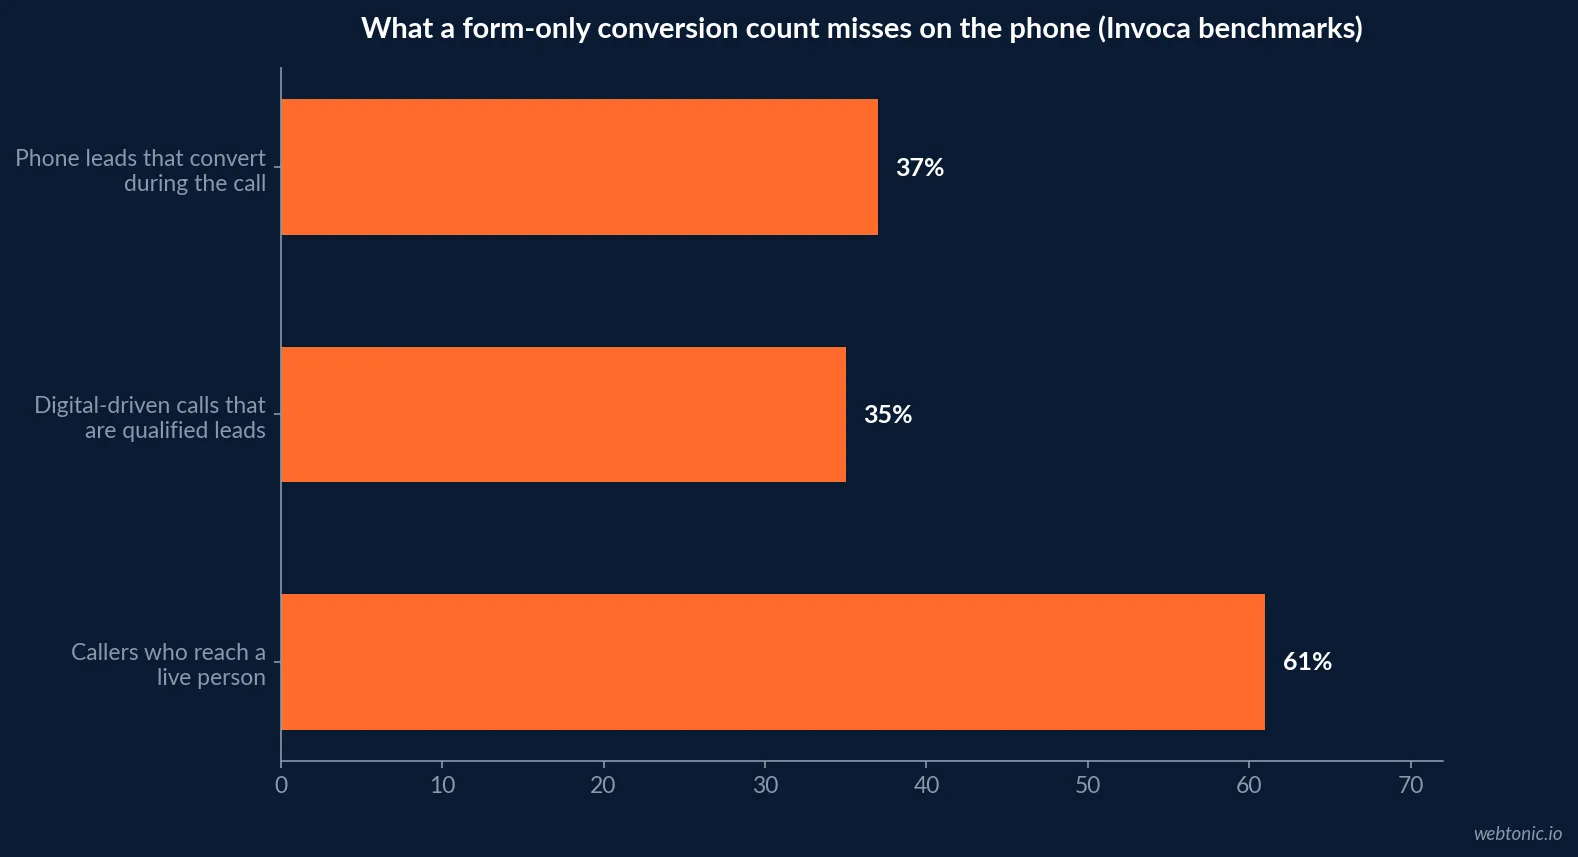
Invoca's Call Conversion Industry Benchmarks Report, an analysis of more than 60 million phone calls across high-stakes purchase categories including financial services, found that 61% of callers reach a live person, that 35% of calls generated by digital marketing are qualified leads, and that 37% of phone leads convert during the call itself. Call answer rates ranged from 54% to 69% across the industries studied, and lead rates reached as high as 54% in the strongest categories.
None of that shows up in a standard "form submit" conversion goal. If an insurance campaign's tracked conversion rate looks like 2.64%, and a third or more of its real conversions close by phone, the campaign's actual return is being reported at roughly half its true value - which is enough to get a profitable channel paused for looking unprofitable.
AI conversations add a second blind spot
The Invoca 2026 Insurance Buyer Experience Report, surveying 129 US insurance consumers in May 2026, found 59% cannot reliably tell whether their last interaction was with a person or an AI agent, down from wider skepticism a year earlier - the share saying AI made the buying experience worse dropped from 29% to 17%. But the same report found roughly 64% of consumers will hold the brand accountable, not the AI vendor, when an automated interaction goes wrong. A voice-AI or chat-AI conversation that closes a policy has to be logged as a conversion and tied back to its source campaign, or the marketing team that generated it gets none of the credit and all of the blame when it underperforms on paper.
| Insurance buyer-experience finding (Invoca 2026) | Figure |
|---|---|
| Consumers who can't reliably tell AI from a human agent | 59% |
| Consumers saying AI made the experience worse (2025) | 29% |
| Consumers saying AI made the experience worse (2026) | 17% |
| Consumers who blame the brand for a bad AI interaction | ~64% |
| Callers who reach a live person, cross-industry | 61% |
What a corrected attribution model has to close
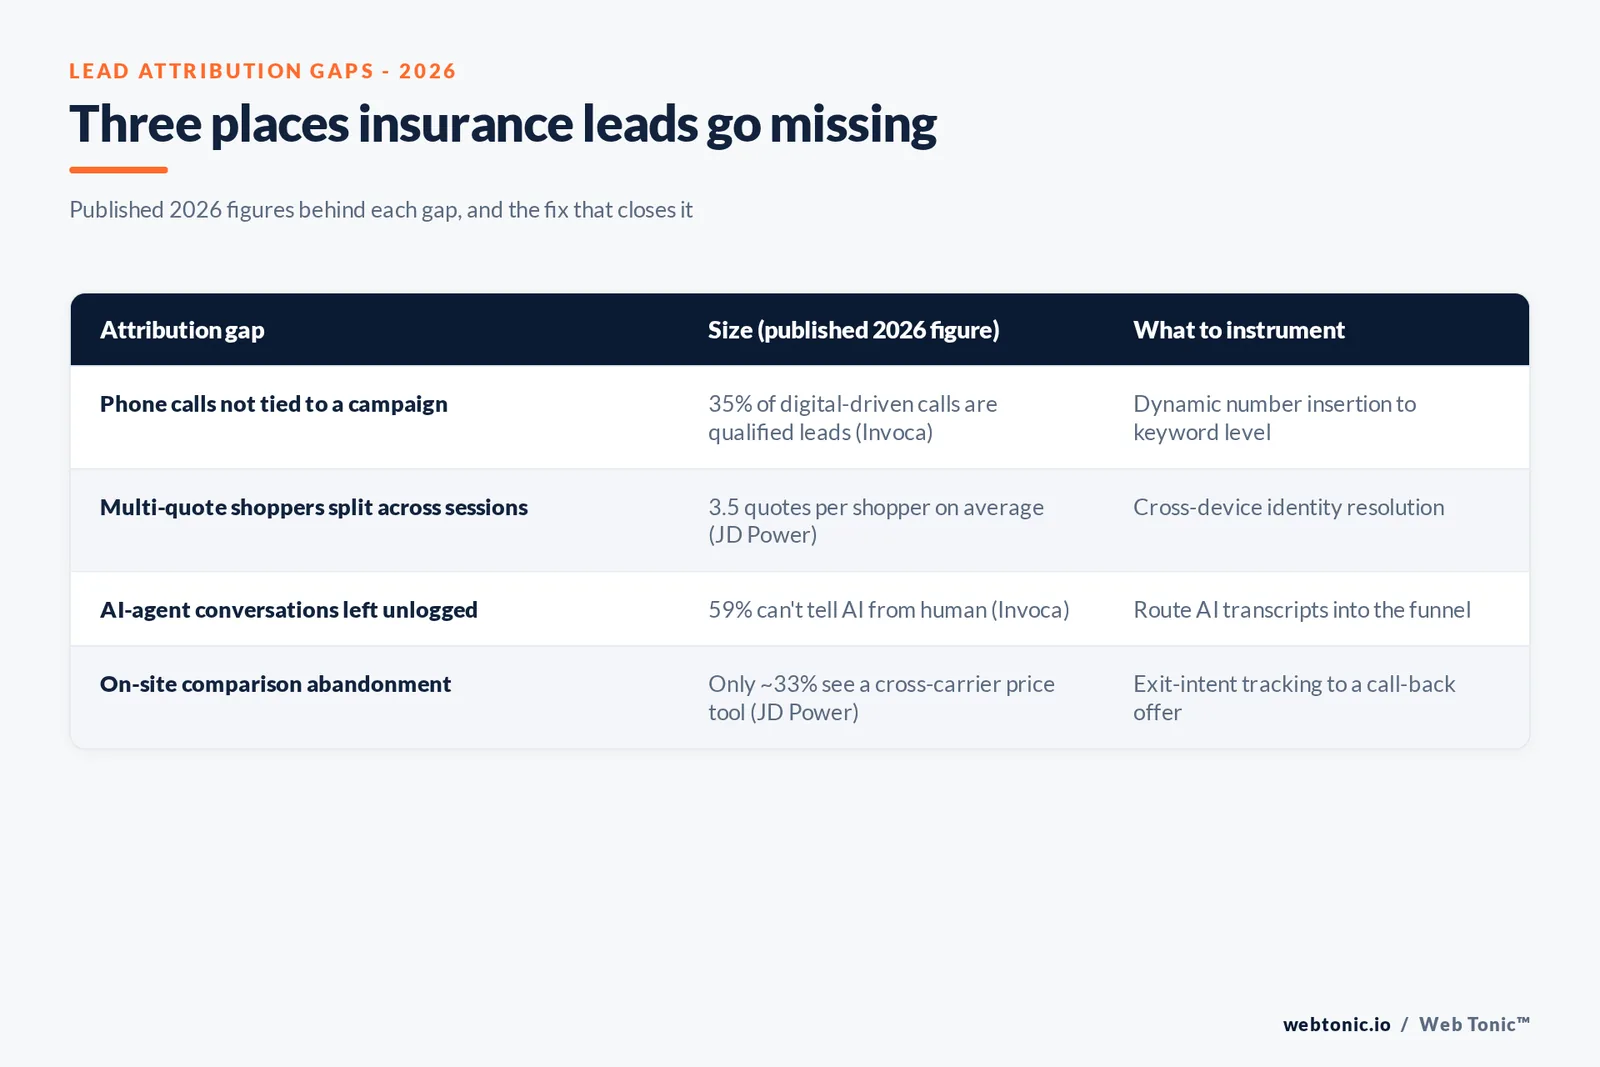
Three gaps recur across the data above: the phone-call gap (roughly a third of qualified leads never touch a web form), the multi-session gap (3.5 quotes per shopper means one buyer can register as three or four "new" sessions across devices), and the AI-conversation gap (voice and chat interactions that close business but were never mapped to a campaign). Closing each one raises the reported conversion rate without changing a single ad.
A rebuilt model connects call tracking numbers to the ad group or keyword that generated the call, deduplicates the multi-quote shopper across sessions using a persistent identifier, and routes AI-agent transcripts into the same CRM stage as a human-answered call. None of it is exotic; it is the same three-legged stool our data and analytics practice builds for any lead-gen account where the phone still closes the sale.
| Attribution gap | Size (published 2026 figure) | What to instrument |
|---|---|---|
| Phone calls not tied to a campaign | 35% of digital-driven calls are qualified leads (Invoca) | Dynamic number insertion down to keyword level |
| Multi-quote shoppers split across sessions | 3.5 quotes per shopper on average (JD Power) | Cross-device identity resolution in the CRM |
| AI-agent conversations left unlogged | 59% can't tell AI from human (Invoca) | Route AI transcripts into the same funnel stage as calls |
| On-site comparison abandonment | Only ~33% see a cross-carrier price tool (JD Power) | Exit-intent tracking tied to a call-back offer |
| Chat under-adoption despite the spend | Just 11% use a chatbot when offered (JD Power) | Audit whether chat is even discoverable on mobile |
The compliance layer sits on top of the tracking layer
Insurance advertising is not free to instrument however it likes. The NAIC's Unfair Trade Practices Act, adopted in some form by nearly every state insurance department, prohibits misleading statements about policy terms and pricing in advertising - the same comparisons a tracking stack is built to measure and optimize. Separately, Google's Financial Services Verification policy now requires insurance advertisers to verify their license and registration in a growing list of markets before their ads can serve at all. A verification lapse looks identical to a tracking failure in a reporting dashboard - conversions drop to zero - so the first diagnostic step on any insurance account should be confirming the account is still verified, not rebuilding the pixel.
Rate context matters here too: the Insurance Information Institute reports the countrywide average auto insurance expenditure rose 6.1% to $1,127 in 2022 (the latest NAIC-sourced figure available), which is the premium size a single mis-attributed lead is actually worth defending.
| Compliance checkpoint before blaming the tracking stack | What it governs | Source |
|---|---|---|
| State insurance advertising rules | Misleading claims/comparisons in creative and offers | NAIC Unfair Trade Practices Act |
| Google Financial Services Verification | License/registration check before insurance ads can serve | Google Ads Help |
| Auto insurance rate context | 6.1% average expenditure rise to $1,127 in 2022 | Insurance Information Institute |
The distribution shift behind the noise
McKinsey's research on P&C insurance distribution describes customers who "jump from" channel to channel across a single purchase decision - in person, mobile, phone, and web - as the norm rather than the exception, with agents increasingly expected to operate across all of them. A tracking stack built for one channel at a time will always under-report an industry that buys this way; the fix is a model built around the buyer's actual path, not the platform's default conversion event.
How to close the gap without adding headcount
Start with call tracking at the keyword level, since it closes the single largest documented gap. Add cross-device identity resolution next, since 3.5 quotes per shopper is the biggest source of duplicate "leads" in most insurance CRMs. Route AI and chat transcripts into the same pipeline stage as a phone call last, once the first two are stable enough to trust the baseline they create. Each step raises the reported conversion rate on the exact same media spend.
If phone leads and quote comparisons are already the bulk of an insurance book of business, talk to us about wiring that funnel properly, or read how we approach the broader Google Ads strategy question before the tracking layer gets rebuilt underneath it.
Frequently Asked Questions
Why does insurance have such a low recorded conversion rate if the clicks are strong?
LocaliQ/WordStream's 2026 benchmarks, built from 13,474 search campaigns, put Finance and Insurance click-through rate at 9.83%, the second-highest of 23 industries, while its conversion rate sits at 2.64%, the lowest of any tracked category. The gap is not a targeting problem. JD Power's 2026 U.S. Insurance Shopping Study finds shoppers now collect 3.5 quotes on average before buying, and a large share of that comparison happens by phone or on a call-back a pixel never sees, so the true conversion count is higher than the tag fires.
How much of insurance lead volume comes from phone calls instead of forms?
Invoca's Call Conversion Industry Benchmarks Report, built from more than 60 million calls across high-stakes purchase categories including financial services, found 61% of callers reach a live person, 35% of calls from digital marketing are qualified leads, and 37% of phone leads convert during the call itself - all revenue that a form-only conversion count misses entirely.
What does JD Power's shopping data say about where quote comparisons happen?
JD Power's 2026 study reports only about one-third of insurance shoppers encounter a price comparison tool that includes other carriers, and just 27% see a tool comparing other policies from the same brand. When shoppers cannot compare on-site, they call, email, or use a chat window that a standard web analytics conversion goal was never configured to catch.
Is AI making insurance lead attribution harder or easier to track?
Both. Invoca's 2026 Insurance Buyer Experience Report finds 59% of insurance consumers cannot reliably tell whether they spoke with a person or an AI agent, and conversation-intelligence tools can now score and route those calls automatically. But the same report shows 64% of consumers will blame the brand, not the vendor, when an AI interaction goes wrong - so a call that converts through AI still has to be tied back to the campaign that generated it, or it looks like the campaign failed.
Do compliance rules limit what insurance advertisers can track and report?
Yes. The NAIC's Unfair Trade Practices Act, adopted in some form by nearly every state, prohibits misleading claims in insurance advertising and applies to the offers and comparisons shown in the same funnel a tracking stack measures. Google separately requires financial-services advertiser verification in a growing list of markets before insurance ads can run at all, which means a broken verification status - not a broken pixel - is sometimes the real reason a campaign stops generating tracked leads.
Sources
LocaliQ/WordStream - 2026 Google Ads industry benchmarks
LocaliQ/WordStream - 2025 Facebook ads industry benchmarks
J.D. Power - 2026 U.S. Insurance Shopping Study
J.D. Power - 2026 U.S. Insurance Digital Experience Study
Invoca - Call Conversion Industry Benchmarks Report
Invoca - Insurance Buyer Experience Report 2026
NAIC - Unfair Trade Practices Act
Google Ads Help - Financial Services Verification
Insurance Information Institute - Facts + Statistics: Auto Insurance
McKinsey - Agents of the Future: P&C Insurance Distribution


