Table of contents
Instagram ads cost roughly $13.66 per 1,000 impressions (CPM) and $1.36 per click on average, with a platform minimum of $1 per day.
Those averages hide a 10x spread. Below is what each buying model really costs, what moves the number, and how to model a budget before you spend.
Key Takeaways
- Benchmark Instagram costs: CPM $13.66, CPC $1.36, cost per engagement $0.063, cost per lead $9.23 and cost per app install $1.99, per Buffer's 2025–2026 cost tracking.
- Instagram and Facebook share one auction. Across Meta, average CPC is $1.92 for lead campaigns and $0.70 for traffic campaigns, with an average cost per lead of $27.66 (WordStream benchmark study).
- Industry is the single biggest cost variable: cheapest clicks land near $0.34 (shopping, collectibles, gifts) and the most expensive near $9.78 (dental services).
- Conversion-objective campaigns range from $0.42 to $3.89 CPC and $2.28 to $30.97 CPM depending on objective and audience (WordStream).
- You are not bidding against a rate card. You are bidding against every advertiser targeting the same person — which is why creative quality shows up as a cost line, not a brand line.
- Organic reach cannot subsidise the gap: Instagram's average engagement rate is now 0.48%, down 24% year over year (Socialinsider, 35M posts).
- Global social ad spend is on track for $317.33 billion, growing 10.9% a year — auction prices rise with it (Sprout Social).
What Instagram ads cost in 2026: the benchmark table
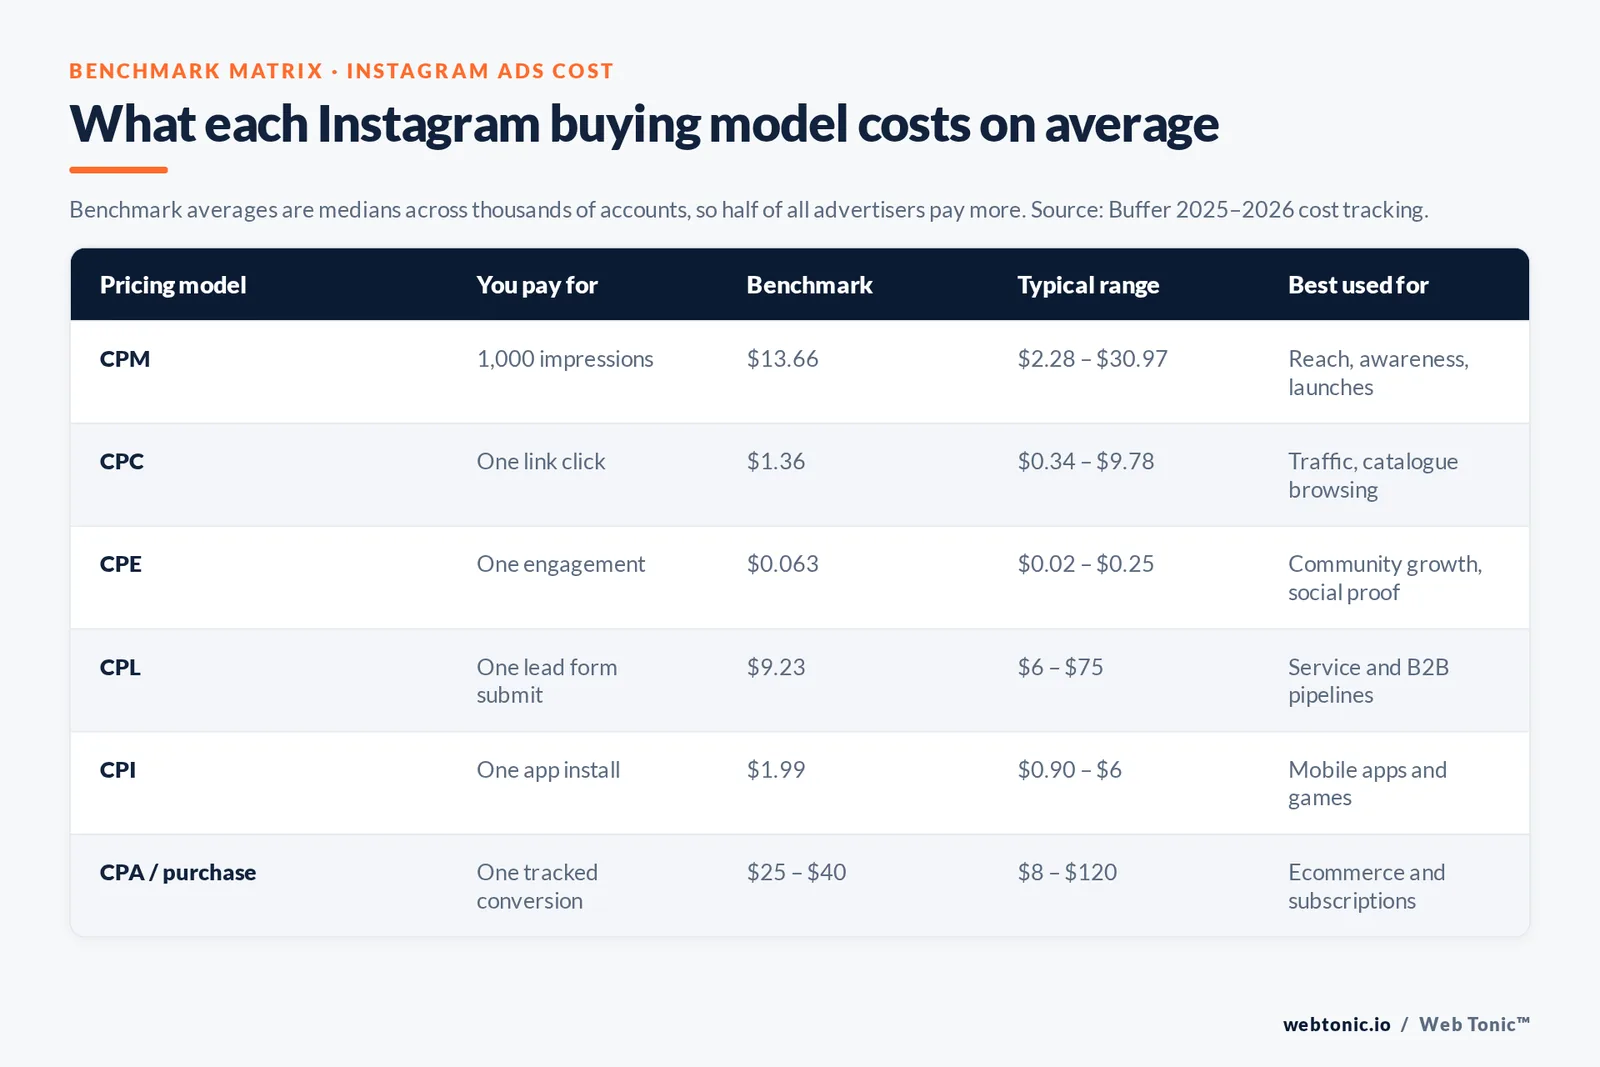
Instagram advertising is priced per outcome, not per placement. You pick a campaign objective, Meta charges you for the event that objective optimises for, and the "cost" you talk about internally depends entirely on which of those events you chose. Comparing your CPM to someone else's CPL is the most common budgeting error we see.
| Pricing model | What you pay for | Benchmark average | Typical range | Best used for |
|---|---|---|---|---|
| CPM | 1,000 impressions | $13.66 | $2.28 – $30.97 | Reach, awareness, launches |
| CPC | One link click | $1.36 | $0.34 – $9.78 | Traffic, catalogue browsing |
| CPE | One engagement | $0.063 | $0.02 – $0.25 | Community growth, social proof |
| CPL | One lead form submit | $9.23 | $6 – $75 | Service and B2B pipelines |
| CPI | One app install | $1.99 | $0.90 – $6 | Mobile apps and games |
| CPA / purchase | One tracked conversion | $25 – $40 | $8 – $120 | Ecommerce and subscriptions |
Two notes on reading that table honestly. First, benchmarks are medians across thousands of accounts, so half of all advertisers pay more. Second, a low CPM is not a win on its own — a $4 CPM against an audience that never buys is more expensive than a $25 CPM against in-market buyers. The only cost that matters is customer acquisition cost against contribution margin.
Why Instagram ads cost what they cost: the auction
Meta runs an auction for every impression. The winner is not the highest bidder; it is the ad with the highest total value, which Meta calculates from three inputs: your bid, an estimated action rate (how likely this person is to take the action you optimised for), and ad quality signals gathered from user feedback. That structure has a practical consequence: raising estimated action rate is cheaper than raising your bid.
It also means Instagram ads cost is partly a creative problem. If two advertisers bid the same amount and one has a hook that holds attention, the strong creative wins impressions at a lower effective CPM. This is the same mechanic that makes Facebook ads pricing move with relevance rather than budget size, since both platforms are bought through Facebook Ads Manager on shared inventory.
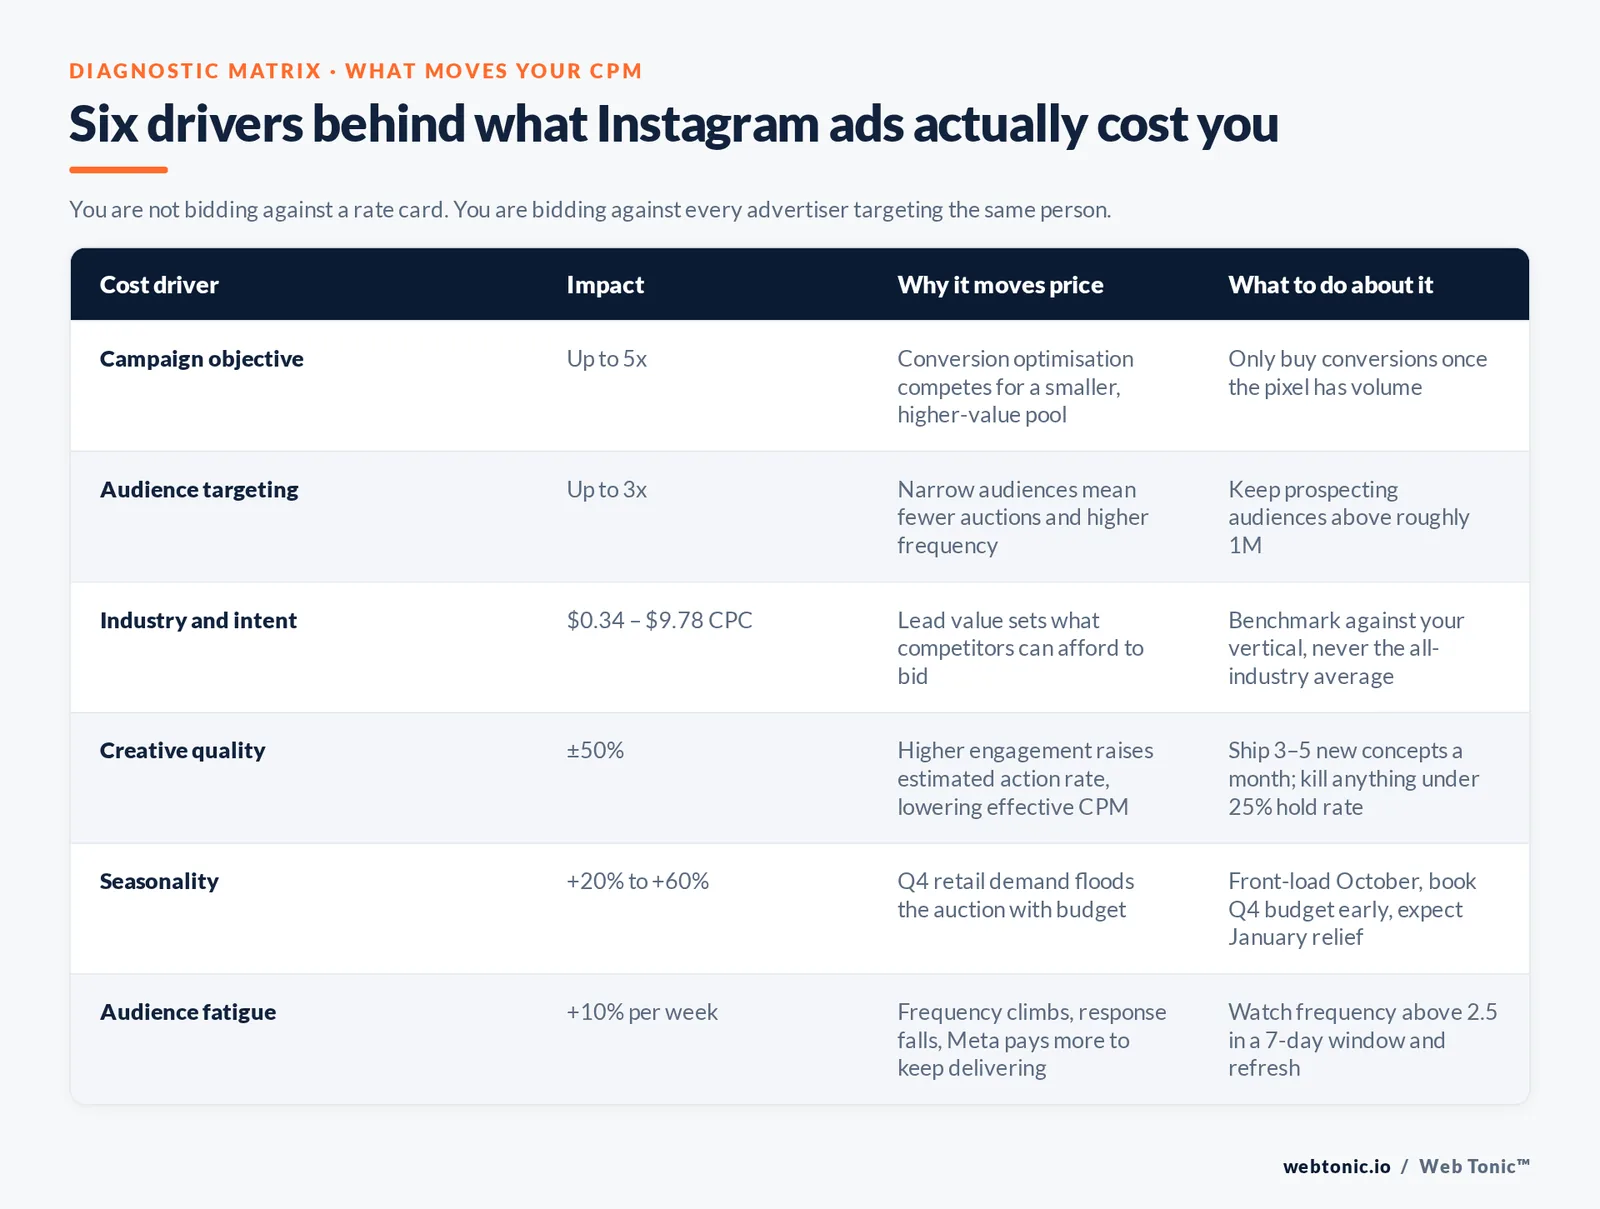
| Cost driver | Direction | Why it moves price | What to do about it |
|---|---|---|---|
| Campaign objective | Up to 5x | Conversion optimisation competes for a smaller, higher-value pool of people | Only buy conversions once the pixel has volume; buy traffic or engagement while learning |
| Audience targeting | Up to 3x | Narrow audiences mean fewer auctions and higher frequency | Keep audiences above roughly 1M for prospecting; let broad targeting find buyers |
| Industry and intent | $0.34 – $9.78 CPC | Lead value sets what competitors can afford to bid | Benchmark against your vertical, never against the all-industry average |
| Placement | ±40% | Feed, Stories, Reels and Explore have different supply and attention profiles | Run Advantage+ placements, then read placement-level CPA before excluding anything |
| Creative quality | ±50% | Higher engagement raises estimated action rate and lowers effective CPM | Ship 3–5 new concepts a month; kill anything under a 25% hold rate |
| Seasonality | +20% to +60% | Q4 retail demand floods the auction with budget | Front-load October, book Q4 budget early, expect January relief |
| Geography | Up to 10x | US and UK inventory is bid up far above emerging markets | Set separate CPA targets per market rather than one global goal |
| Audience fatigue | +10% per week | Frequency climbs, response falls, Meta pays more to keep delivering | Watch frequency above 2.5 in a 7-day window and refresh creative |
Minimum budgets and what small spend actually buys
The technical floor is low: Instagram accepts a daily budget from $1 per day for impression-optimised ads, and around $5 per day once you optimise for clicks or conversions. The useful floor is much higher. Meta needs roughly 50 optimisation events per ad set per week to exit the learning phase and deliver stably, so a realistic minimum is "target CPA × 50 ÷ 7" per day.
Worked example: if your cost per lead sits near the $9.23 Instagram benchmark, 50 leads a week costs about $66 per day. At the broader Meta lead-gen average of $27.66, the same stability costs closer to $198 per day. That arithmetic — not a blog post's "recommended budget" — is what decides whether your account can support conversion buying yet.
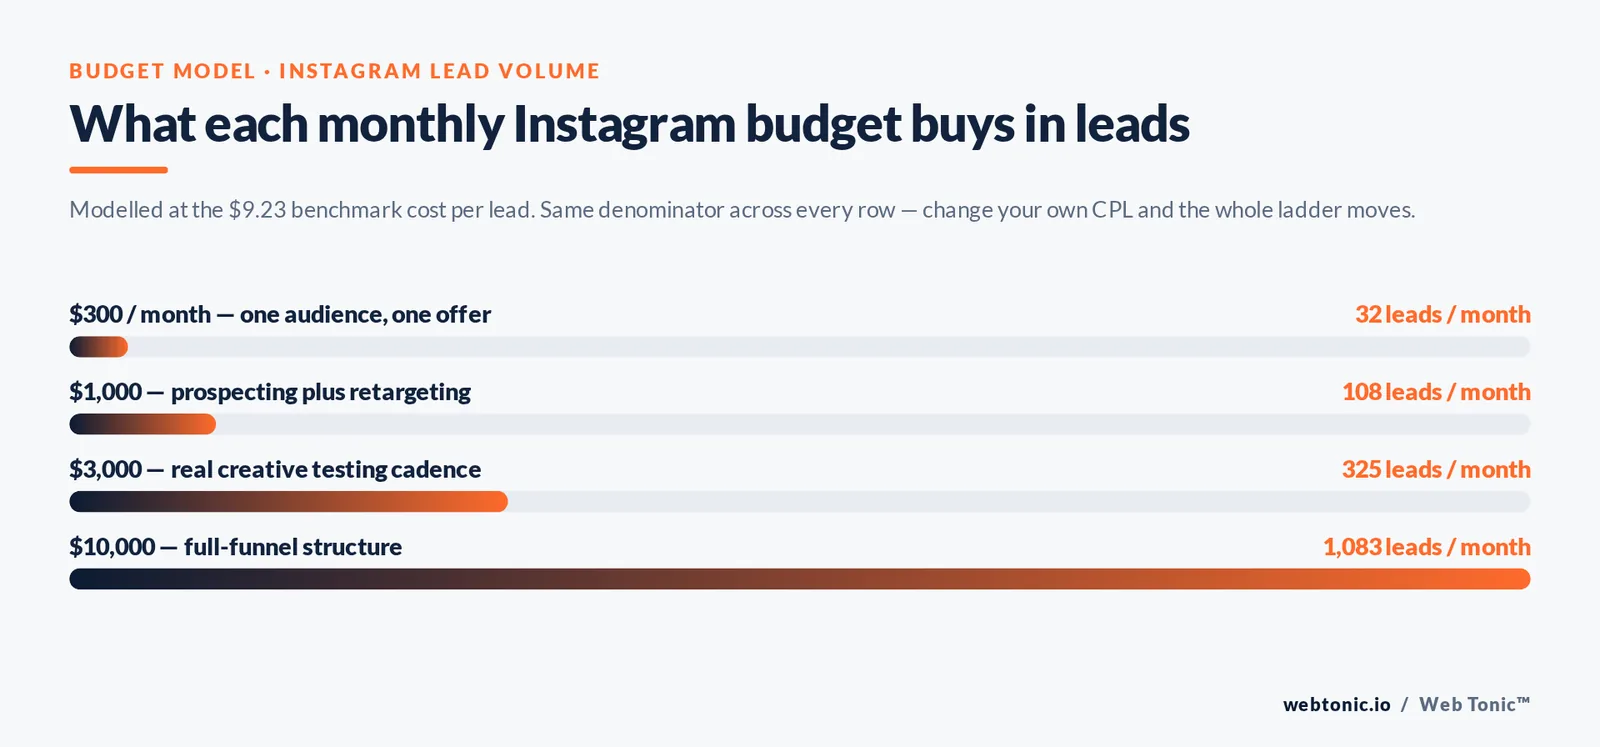
| Monthly budget | Impressions at $13.66 CPM | Clicks at $1.36 CPC | Leads at $9.23 CPL | What this tier is good for |
|---|---|---|---|---|
| $300 | ~22,000 | ~220 | ~32 | One audience, one offer, learning only |
| $1,000 | ~73,000 | ~735 | ~108 | Prospecting plus retargeting split |
| $3,000 | ~220,000 | ~2,200 | ~325 | Real creative testing cadence |
| $10,000 | ~732,000 | ~7,350 | ~1,083 | Full-funnel structure, incrementality reads |
| $50,000+ | ~3.66M | ~36,750 | ~5,417 | Always-on brand plus performance mix |
One billing detail that surprises app advertisers: if you top up an ad account through the iOS app, Apple adds a 30% service fee on the payment. Fund the account from desktop instead and that 30% stays in your media budget.
Setting costs up correctly in Facebook Ads Manager
Instagram ads are bought inside Facebook Ads Manager, and most cost problems are created there before a single impression is served. The campaign objective you pick sets which event Meta charges you for; the audience targeting you pick sets how many auctions your ad enters; the bid strategy you pick sets whether Instagram advertising costs stay predictable or drift.
- Campaign objective: awareness and traffic campaigns buy cheap impressions and clicks (CPM and CPC); leads, app promotion and sales campaigns buy costlier conversion events (CPL, CPI, CPA). Never compare the cost per result of two different objectives.
- Bid strategy: highest volume spends the full budget and lets cost float; cost-per-result goals hold your average cost near a target but can throttle delivery; bid caps give the tightest control and the thinnest reach. Start with highest volume, move to a cost cap once you know your true customer acquisition cost.
- Audience targeting: broad targeting plus a strong creative now beats hand-built interest stacks in most accounts. Lookalikes at 1–3% are still useful for lead gen; interest layering below 500,000 people usually raises CPM without improving quality.
- Advantage+ placements: leaving placements automatic lets Meta buy the cheapest available inventory across Instagram feed, Stories, Reels, Explore and Facebook. Excluding placements manually raises average CPM more often than it improves conversion rate.
- Budget level: campaign budget optimisation pushes spend to the ad set with the best estimated action rate; ad-set budgets let you protect a test. Use CBO for scale, ABO for controlled creative tests.
- Attribution setting: a 7-day click / 1-day view window reports more conversions and therefore a lower apparent cost than 1-day click. Pick one window and keep it, or your cost trend is meaningless.
Digital marketing teams that treat those six settings as a fixed configuration — reviewed monthly rather than fiddled with daily — see far steadier Instagram ads costs than teams that adjust bids after every soft day. Frequent edits reset the learning phase, and every reset costs money in the form of inefficient early delivery.
Instagram vs Facebook vs other platforms
Instagram usually carries a higher CPM than Facebook feed inventory and a lower CPM than search-driven channels, because you are paying for attention rather than declared intent. For context, average Google Ads cost per click across industries runs around $5.26 — roughly 4x the Instagram average — but the click arrives from someone already searching.
| Channel | Typical CPM | Typical CPC | Intent level | Where it fits |
|---|---|---|---|---|
| $13.66 | $1.36 | Low to medium | Demand creation, visual products | |
| Facebook feed | $8 – $14 | $0.70 – $1.92 | Low to medium | Scale, lead gen, older audiences |
| Google Search | n/a | ~$5.26 | High | Harvesting existing demand |
| TikTok | $6 – $12 | $0.50 – $1.50 | Low | Native video, younger reach |
| Snapchat | ~$8 | ~$0.84 | Low | Cheap reach under 30 |
The comparison that matters is blended: cheap reach that never converts inflates your true acquisition cost, while an expensive search click that closes at 20% may be your best line item. We model channels against contribution margin in our growth marketing engagements rather than against each other's CPMs.
How to lower Instagram ads cost without cutting reach
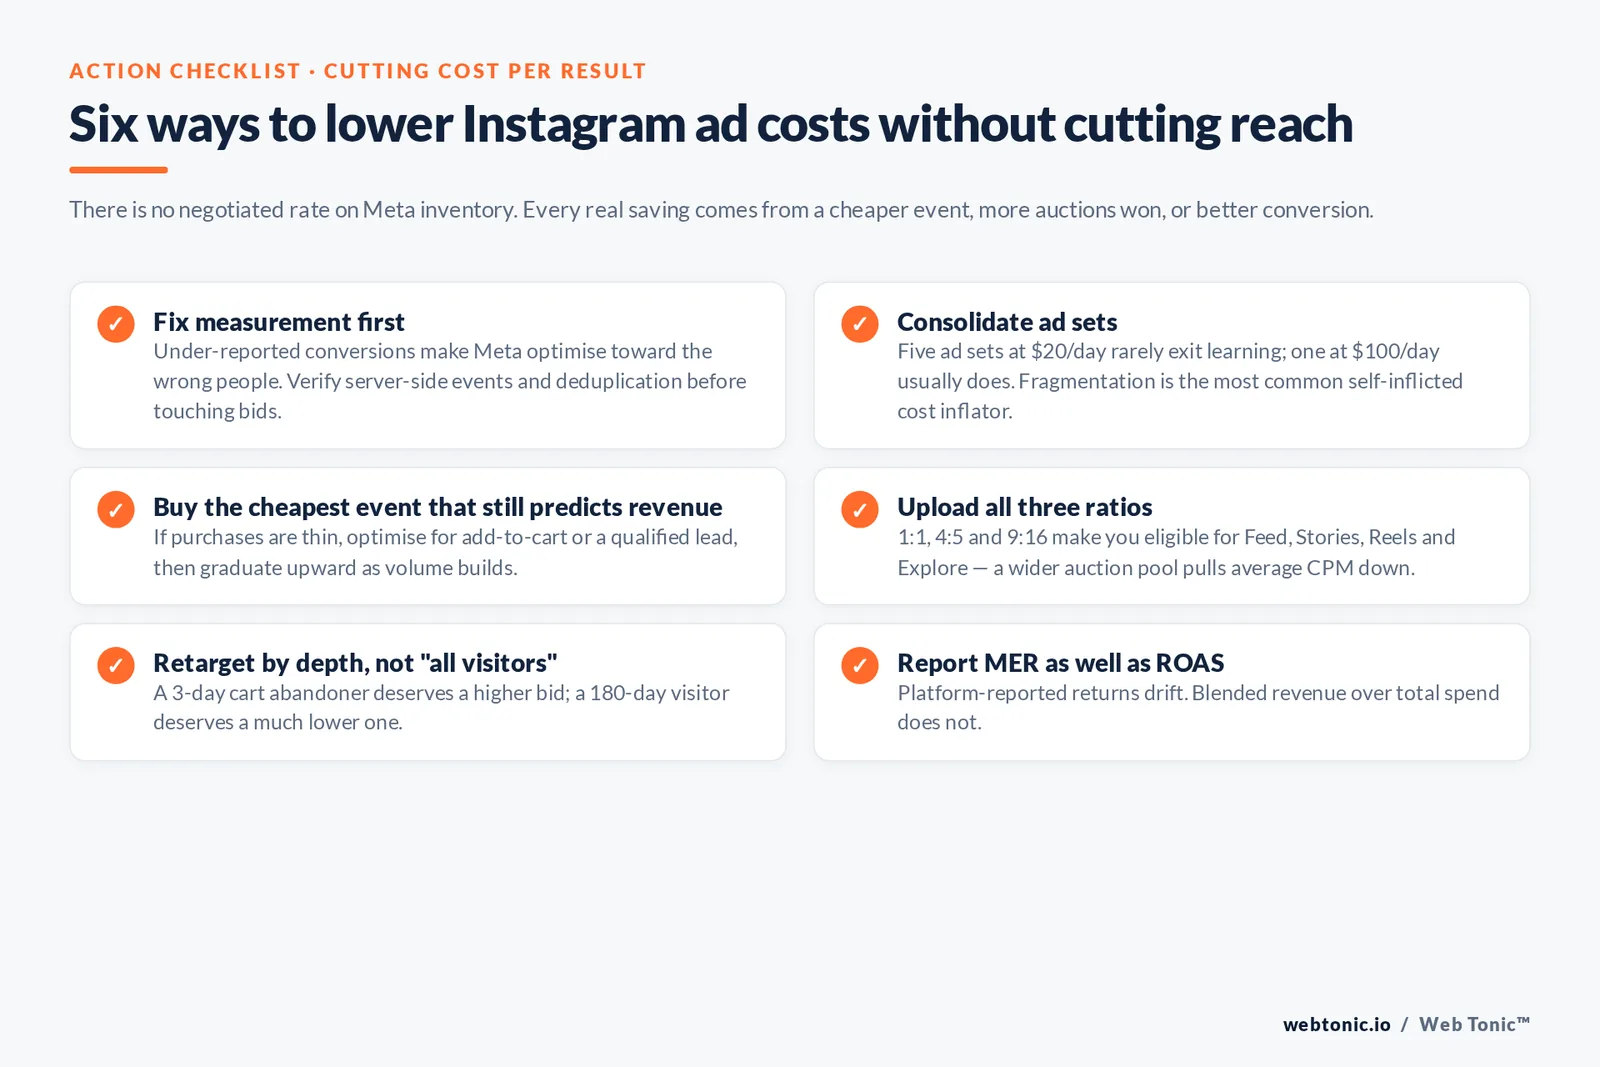
Every genuine cost reduction comes from one of three places: paying for a cheaper event, winning more auctions at the same bid, or converting more of the traffic you already bought. Discount tricks do not exist — there is no negotiated rate on Meta inventory.
- Fix measurement first. Under-reported conversions make Meta optimise toward the wrong people, which raises real CPA even when the dashboard looks calm. Verify server-side events and deduplication before touching bids.
- Consolidate ad sets. Five ad sets at $20/day each rarely exit learning; one at $100/day usually does. Fragmentation is the most common self-inflicted cost inflator we find in audits.
- Buy the cheapest event that still predicts revenue. If purchases are thin, optimise for add-to-cart or a qualified lead event, then graduate upward as volume builds.
- Refresh creative on a schedule. Cost rises with frequency, not with time. Three to five new concepts a month keeps effective CPM flat.
- Use every ratio. Uploading 1:1, 4:5 and 9:16 crops makes you eligible for Feed, Stories, Reels and Explore, widening the auction pool and pulling average CPM down.
- Retarget by depth, not by "all visitors". Separate 3-day cart abandoners from 180-day site visitors; the first deserves a higher bid, the second a much lower one.
- Improve the landing experience. Halving bounce on a mobile page does more for cost per sale than any bid change. Our web development team treats page speed as a media-efficiency lever.
- Report on MER as well as ROAS. Platform-reported returns drift; blended revenue over total spend does not.
Budget planning: build the model backwards
Start from the outcome, not the budget. Take your target number of customers, divide by your close rate to get required leads, multiply by a realistic CPL, then add 20–30% for creative testing that will not pay back immediately. That test allocation is not waste; it is how you find the concept that lowers next quarter's CPA.
Two allocation splits work in practice. New accounts do well at roughly 70% prospecting / 20% retargeting / 10% testing, since there is no audience to remarket to yet. Accounts with steady traffic usually settle near 60/25/15. Either way, review pacing weekly: Meta will happily spend a monthly budget in ten days if your campaign budget is set daily and demand spikes.
Remember the demand context. Instagram reaches roughly 2 billion monthly users and about 35.3% of the world's internet population according to DataReportal, and it remains one of the top platforms for product discovery per Sprout Social's Instagram data. That scale is why costs stay competitive despite rising CPMs — and why Instagram ad revenue keeps climbing alongside total internet advertising revenue.
What good looks like: cost targets by business type
Set targets before launch, then judge the account against them for at least 14 days. Cost data over shorter windows mostly measures the learning phase.
| Business type | Primary metric | Healthy target | Investigate above | Leading indicator |
|---|---|---|---|---|
| Ecommerce under $100 AOV | Cost per purchase | $18 – $30 | $45 | Add-to-cart rate above 6% |
| Ecommerce over $200 AOV | ROAS | 2.5x – 4x | Below 1.8x | Landing page view rate above 80% |
| Local services | Cost per lead | $12 – $35 | $60 | Form completion above 25% |
| B2B / SaaS | Cost per qualified lead | $45 – $150 | $250 | MQL rate above 30% |
| Mobile app | Cost per install | $1.20 – $3 | $6 | Day-1 retention above 25% |
| Creator / community | Cost per engagement | $0.03 – $0.10 | $0.25 | Saves and shares per 1,000 views |
One compliance note that protects your cost curve: claims in paid social have to be substantiated the same way as any other advertising, and disclosure rules apply to paid creator content. The FTC's advertising guidance is the reference. Rejected ads restart learning, and restarted learning is expensive.
Reading Instagram cost reports without fooling yourself
Three habits separate teams who control costs from teams who react to them. They compare like objectives to like objectives across a rolling 28-day window. They read cost alongside frequency and hold rate so they know whether a rise is fatigue or competition. And they check platform-reported numbers against a source of truth — order data, CRM records or a call log — before making a budget decision.
Benchmarks are for sanity checks, not targets. Your competitors' Meta benchmark averages and the broader Instagram marketing landscape tell you whether you are in the right zip code. Your own margin tells you what to pay. If you want a second opinion on whether your Instagram costs are structural or fixable, our data intelligence team runs that diagnosis, and you can get in touch for a review.
FAQ
How much do Instagram ads cost per day?
The platform minimum is about $1 per day for impression-based ads and around $5 per day for click or conversion optimisation. For stable delivery, budget target CPA × 50 ÷ 7 per day so the ad set can gather the roughly 50 weekly events Meta needs to exit the learning phase.
Are Instagram ads more expensive than Facebook ads?
Usually slightly, on a CPM basis. Both run through the same auction and the same Ads Manager, but Instagram inventory attracts strong competition for younger, visually driven audiences. Meta-wide averages sit near $0.70 CPC for traffic and $1.92 CPC for leads, while Instagram-specific clicks average $1.36.
Why did my Instagram ads cost suddenly increase?
Check four things in order: frequency (fatigue), audience size (too narrow), tracking (missing conversions push optimisation off target) and seasonality (Q4 raises prices 20–60%). A creative refresh fixes fatigue faster than a bid change fixes anything else.
Is a $500 monthly Instagram budget worth it?
Yes, if you spend it on one audience and one offer. At $13.66 CPM that buys roughly 36,000 impressions or about 360 clicks — enough to validate a hook, not enough to run five ad sets. Splitting $500 across multiple ad sets is the fastest way to waste it.
How do I lower cost per result without lowering reach?
Raise estimated action rate rather than cutting spend: better hooks, all three aspect ratios uploaded, consolidated ad sets, accurate server-side conversion tracking and a faster landing page. Those five changes routinely move effective CPM by 20–40% with the same budget.
Sources: Buffer Instagram ads cost data · WordStream Facebook/Meta ads cost benchmarks · WordStream Facebook advertising guide · Socialinsider Instagram and Facebook benchmark studies · Sprout Social social media and Instagram statistics · Statista Instagram marketing · eMarketer Instagram ad revenue · IAB internet advertising revenue report · DataReportal Digital 2026 · Google Ads pricing · FTC advertising guidance. Cost figures are market averages and will vary by industry, geography and season.