Table of contents

No published study states what percentage of hospitality bookings come directly from visual social content — this page will not manufacture one to fit the headline. What Sprout Social's 2026 research does show, in named, sourced figures, is how heavily visual formats and reviews shape the travel planning journey before a booking happens, which is the honest and better-supported claim.
Key Takeaways
- 69% of consumers plan to use social media to plan travel in the next year.
- That figure rises to 87% among Gen Z and 81% among Millennials.
- 83% of parents plan to use social for travel planning, above the general average.
- 55% say review-platform feedback influences whether they book with a travel brand.
- 42% cite the quality of social customer care as a booking influence.
- 32% cite the ease of booking directly from social as an influence.
- Social content itself ranked fourth, at 29%, for shaping destination research.
- Single-image Instagram posts fell nine points as a share of tourism-brand content, 2023-2024.
- Travel and hospitality brands respond to only 6% of incoming messages daily.
- 73% of social users would switch to a competitor after a brand ignores them.
- 61% of travelers value tailored, personalized recommendations from brands.
- 73% say supporting local small businesses matters while traveling.
- 58% of travelers with kids plan to revisit childhood destinations in 2025.
- Social media leads travel inspiration in China at 68% and India at 63%.
- That beats booking websites (51% and 49%) and search engines in those same markets.
What the claim can and cannot be built on
A headline like "visuals drive most hospitality bookings" implies a measured share of bookings attributable to visual content. No source in this research turned up such a figure, from Sprout Social, Skift, Booking.com or anyone else, and this page is not going to invent one to make the title literally true. What the evidence supports instead: social media, and specifically video and carousel content, is where a large and growing share of travelers do their pre-booking research, and reviews visible on social platforms are a named, quantified influence on the booking decision itself.
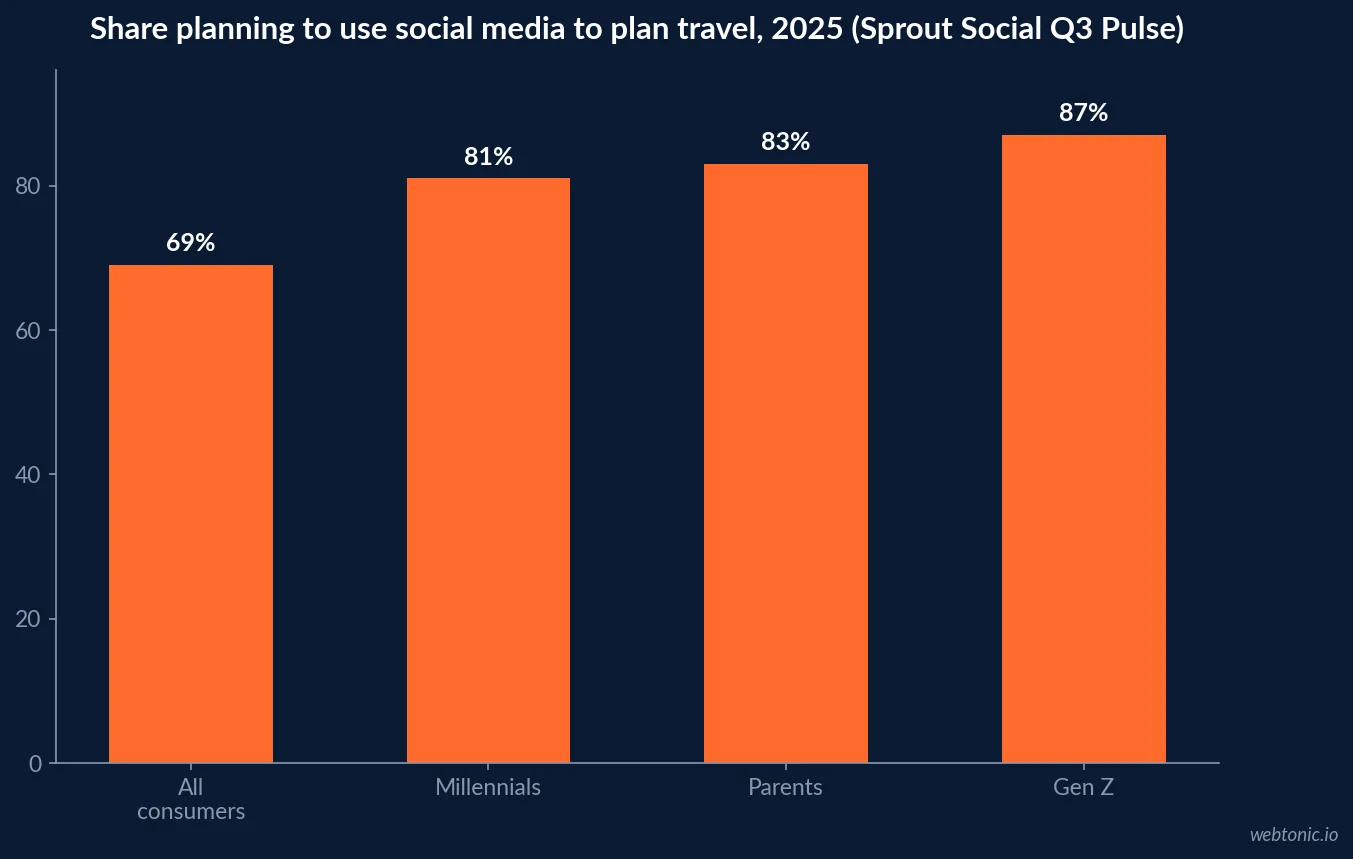
Per Sprout Social's Q3 2025 Pulse Survey, 69% of consumers anticipate using social to plan travel in the next year, rising to 87% among Gen Z, 81% among Millennials and 83% among parents. That is a planning-behavior statistic, not a bookings-attribution statistic, and the distinction matters for how a marketing team should read it.
| Group | Plans to use social for travel planning | Source |
|---|---|---|
| All consumers | 69% | Sprout Social Q3 2025 Pulse Survey |
| Gen Z | 87% | Sprout Social Q3 2025 Pulse Survey |
| Parents | 83% | Sprout Social Q3 2025 Pulse Survey |
| Millennials | 81% | Sprout Social Q3 2025 Pulse Survey |
What actually moves someone from browsing to booking
The same Sprout survey asked what shapes whether someone books with a travel brand, and the answer is not primarily the content itself. 55% cited customer feedback on review platforms, 42% cited the quality of a brand's social customer care, and 32% cited the ease of booking directly from social. When Sprout separately asked what shapes destination research specifically, social media content ranked fourth at 29% of the vote — present, but behind other factors the survey did not fully break out.
Read together, that ordering argues visual content's real job is to get a traveler into the consideration set; reviews, responsiveness and booking friction are what convert consideration into an actual reservation. Treating content quality as the entire strategy, without review management or responsiveness, is the gap most travel brands are leaving open.

| What shapes the booking decision | Share citing it | Source |
|---|---|---|
| Customer feedback on review platforms | 55% | Sprout Social Q3 2025 Pulse Survey |
| Quality of social customer care | 42% | Sprout Social Q3 2025 Pulse Survey |
| Ease of booking directly from social | 32% | Sprout Social Q3 2025 Pulse Survey |
| Social media content, for destination research specifically | 29% | Sprout Social Q3 2025 Pulse Survey |
Why video and carousel content specifically is gaining share
Sprout's 2025 Travel & Hospitality Content Benchmarks Report found that single-image Instagram posts declined nine percentage points as a share of tourism-brand content between 2023 and 2024, replaced by multi-image carousels and video. Sprout's stated reasoning: video lets a prospective traveler picture themselves in a destination — sound, movement and a sense of place — in a way a static image cannot. That is a content-mix shift with a measured number behind it, distinct from any claim about how many bookings it produces.
| Content trend (Sprout Social 2025 data) | Figure | What it measures |
|---|---|---|
| Single-image Instagram post share, change 2023-2024 | -9 points | Format share, not booking attribution |
| Brands responding to incoming social messages daily | 6% | Responsiveness, a named engagement gap |
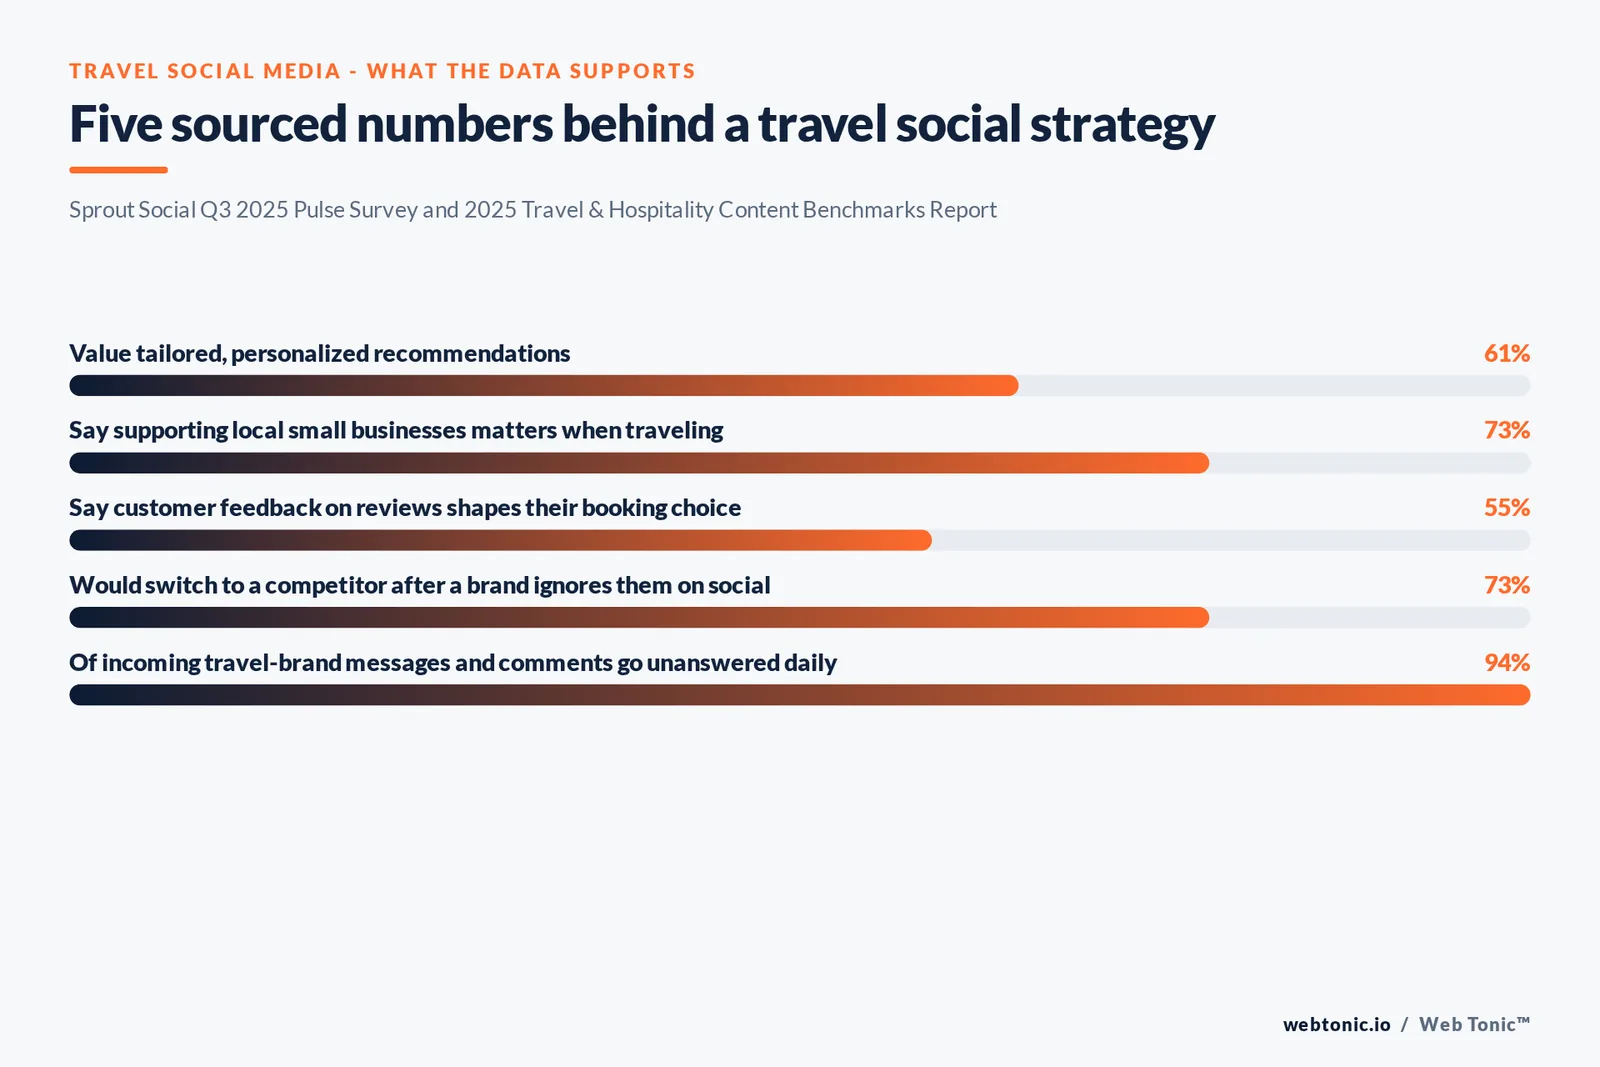
| Consumers who'd switch to a competitor after being ignored | 73% | Cost of the responsiveness gap |
| Travelers valuing tailored, personalized recommendations | 61% | Personalization demand |
| Travelers who say supporting local business matters | 73% | Local-culture content demand |
The responsiveness gap is bigger than the content gap
The most actionable number in this data set may be the least visual one. Travel and hospitality brands respond to just 6% of incoming messages and comments per day, per Sprout's benchmarks report, meaning 94% go unanswered. The 2025 Sprout Social Index found 73% of social users would switch to a competitor after a brand fails to respond. A brand investing heavily in video production while leaving replies unmanaged is optimizing the smaller of the two levers the same survey identifies, and doing so at the exact moment competitors who do respond stand to gain the most from the gap.
The platform breakdown behind the video shift
Sprout's separate 2024 Influencer Marketing Benchmarks Report counted more than 6.5 million influencer posts about travel in 2023, carrying an estimated USD 34.6 billion in earned media value. Broken out by platform, TikTok posts earned the highest engagement rate at 3.21%, ahead of Instagram at 2.82%, YouTube at 1.83%, Facebook at 0.55% and X at 0.21%. A brand-specific example from the same report: Airbnb-tagged posts averaged a 4.38% engagement rate, nearly double the travel-industry figure, on 5,370 posts worth an estimated USD 22.9 million in earned media.
That is the clearest evidence in this data set that visual, creator-made content specifically outperforms brand-only posting — but it is an engagement and earned-media figure, not a booking-share figure, and should be read as such.
| Platform (travel influencer content, 2023) | Posts | Engagement rate |
|---|---|---|
| TikTok | 300K | 3.21% |
| 5.4M | 2.82% | |
| YouTube | 146K | 1.83% |
| 261K | 0.55% | |
| X | 395K | 0.21% |
Why paid video reinforces the organic pattern
The organic pattern above lines up with what Google reports on the paid side of video. Its own Think with Google research found that running Search and YouTube campaigns together drives 21% higher ROAS than all other media combined for travel advertisers. That is a paid-media figure, not a social-organic one, but it is one more data point in the same direction: video is outperforming static formats across both paid and organic travel marketing right now, not just on TikTok or Instagram specifically.
It is also worth sizing why travel brands are willing to keep investing in that content pipeline at all. The U.S. Travel Association's Spring 2026 forecast puts domestic leisure travel spending at USD 909 billion for the year, and AHLA's 2026 State of the Industry report separately expects hotel guest spending near USD 805 billion. A market that size can support sustained video production budgets even without a hard bookings-attribution number to point to. Occupancy data adds a scheduling layer on top of that: CoStar's STR benchmarking service put July 2026 US hotel occupancy at 69.7%, meaning content and response capacity should scale up ahead of the specific weeks demand peaks, not run at a flat cadence year-round.
Where geography changes the answer
Booking.com's 2026 Travel Predictions survey found social media is the dominant source of travel inspiration in China (68% of travelers) and India (63%), ahead of booking websites (51% and 49%) and search engines (60% and 43%) in those same markets. That ranking does not hold everywhere; it is a market-specific finding, and a brand building a global content calendar should weight social discovery differently for an India- or China-facing campaign than for a market where search or OTA sites still lead inspiration. A single global content calendar built around one market's channel mix risks under-resourcing the platforms that actually lead discovery elsewhere.
| Market | Social media as top inspiration source | Booking websites | Search engines |
|---|---|---|---|
| China | 68% | 51% | 60% |
| India | 63% | 49% | 43% |
What to do with this data
Build the content plan around video and carousel formats, since that is where the measured content-mix shift is heading, but do not treat content as the whole strategy: put equal or greater resourcing behind review management and message response, since those are the two factors Sprout's own survey ties most directly to the booking decision. Our social and content team can audit both sides of that split, and our roundup of agencies running paid social for travel brands is a useful comparison point if you are weighing in-house versus outsourced execution. To talk through a plan, reach out.
Frequently Asked Questions
Does any study actually prove visuals 'drive most' hospitality bookings?
No single published study states a percentage of bookings directly attributable to visual social content, and this page will not invent one. What Sprout Social's research does show is that 69% of consumers plan to use social to plan travel in the next year, rising to 87% for Gen Z, and that hospitality brands are shifting spend toward video and carousel formats specifically because static single-image posts underperform them. That is evidence that visual content shapes the planning journey, not proof of a bookings percentage.
What social content format is actually working best for travel brands right now?
Sprout Social's 2025 Travel & Hospitality Content Benchmarks Report found that single-image Instagram posts declined nine percentage points as a share of tourism-brand content between 2023 and 2024, replaced by multi-image carousels and video. Sprout's own guidance is that video performs better in travel specifically because it lets a prospective traveler picture themselves in a destination, which a static image communicates less effectively.
What actually influences whether someone books with a travel brand after finding it on social?
Sprout's Q3 2025 Pulse Survey asked exactly this. 55% of consumers said customer feedback on review platforms influences whether they book with a travel company, 42% cited the quality of social customer care, and 32% cited the ease of booking directly from social. Social content itself ranked fourth in that same survey, at 29% of the vote, when people were asked what shapes their destination research.
How responsive are travel and hospitality brands on social right now?
Not very, per Sprout's own data: travel and hospitality brands respond to only 6% of incoming messages and comments per day, according to the 2025 Travel & Hospitality Content Benchmarks Report. That matters because the 2025 Sprout Social Index found 73% of social users say they would switch to a competitor if a brand doesn't respond on social — meaning most travel brands are leaving a large, measurable engagement gap for competitors that do reply.
Is social media booking behavior the same everywhere in the world?
No. Booking.com's 2026 Travel Predictions survey found social media is the dominant source of travel inspiration in China (68% of travelers) and India (63%), well above booking websites (51% and 49%) and search engines (60% and 43%) in those same markets. A brand targeting those markets should weight social discovery more heavily than one targeting markets where search or OTA sites still dominate inspiration.
Sources
Sprout Social - Social Media Marketing for Tourism
Sprout Social - 2025 Travel & Hospitality Social Media Benchmarks
Sprout Social - 2024 Influencer Marketing Benchmarks Report
Google (Think with Google) - AI in travel marketing: winning the new era of Search
U.S. Travel Association - U.S. Travel Forecast, Spring 2026
American Hotel & Lodging Association - 2026 State of the Industry
CoStar / STR - U.S. hotel performance for July 2026
Booking.com - 2026 Travel Predictions
Web Tonic - Best Facebook Ads agencies