



Table of contents

Hospitality and travel landing pages convert at a median of 4.8%, 37% below the 6.6% all-industry median, and the reason is not one bad headline - it is a booking engine that loses most of its mobile visitors before checkout. This report prices the CRO problem by booking-page type, not by "travel" as one bucket.
Key Takeaways
- Travel and hospitality landing pages convert at a 4.8% median, 37% below the 6.6% all-industry figure (Unbounce).
- Accommodations pages convert at just 3.7%, the weakest subcategory in the vertical.
- Transportation and travel-services pages convert at 14.8%, the strongest subcategory.
- The top 25% of travel and hospitality pages convert at 15.6% or higher.
- Desktop converts 10.4% better than mobile in this vertical specifically.
- Independent boutique portfolios see mobile at roughly 62% of sessions yet converting 1.8 to 2.3 times worse than desktop.
- Around 62% of visitors who reach a booking engine never complete it (Pixel and Polish, 2026).
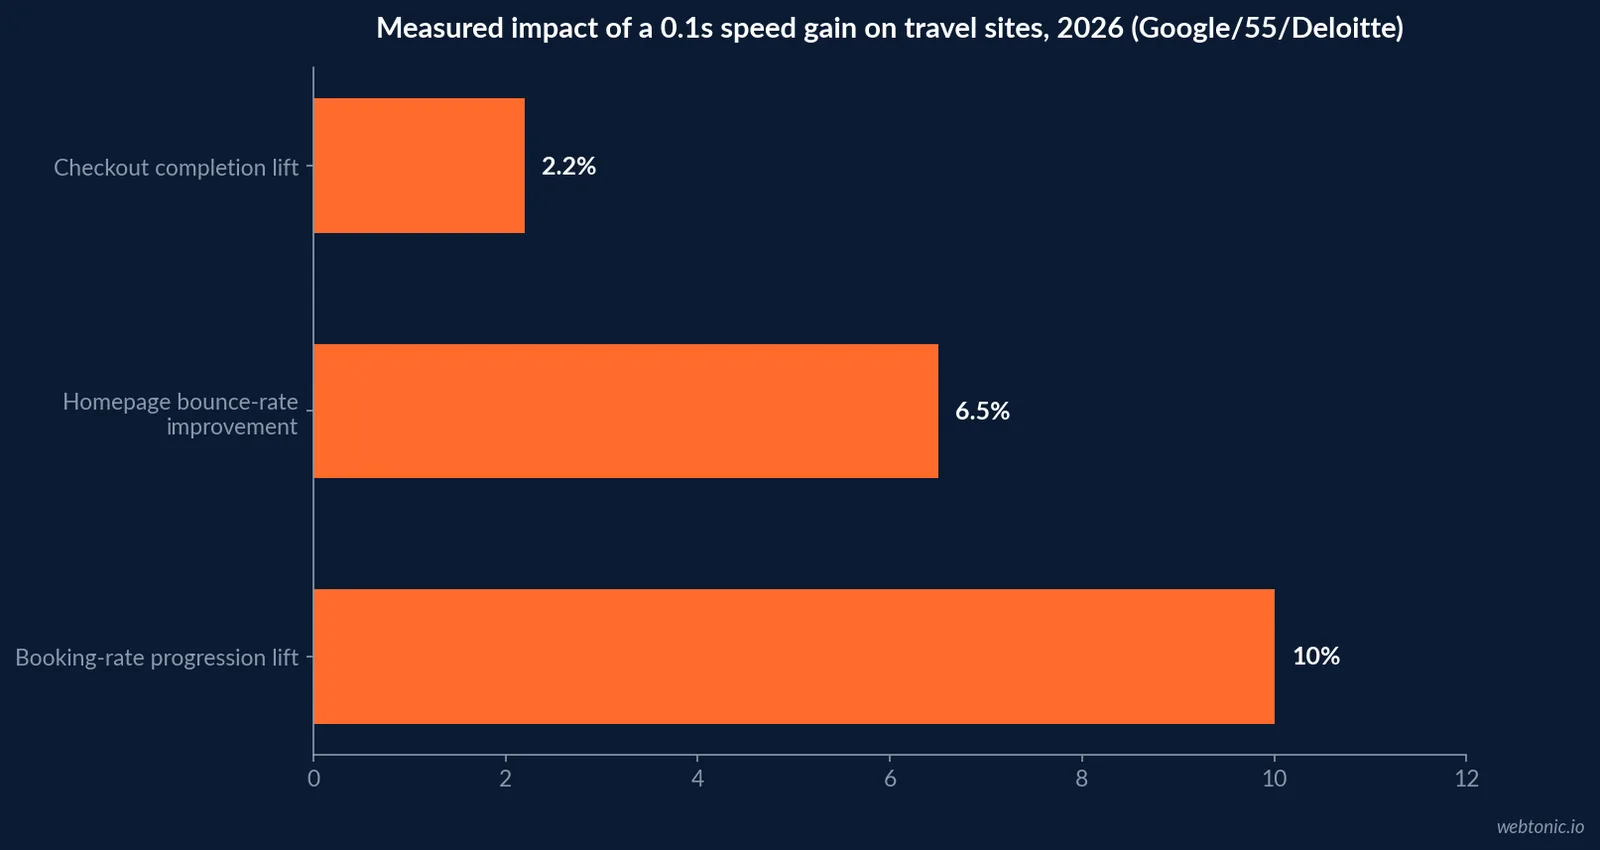
- A 0.1-second load-time improvement lifted travel booking-rate progression by 10% (Google/55/Deloitte).
- Checkout completion rose 2.2% for the same 0.1-second gain.
- Travel recorded the largest bounce-rate improvement of any vertical tested, at 6.5%.
- Average travel mobile pages load in 10.1 seconds, against a 53% mobile abandonment threshold at 3 seconds (Think with Google).
- OTAs now take 63.4% of independent-hotel bookings, direct sits at 36.6% (Cloudbeds, 90 million bookings, 2026).
- OTA cancellation rates run 21.8%, more than double the 10.6% direct-booking rate.
- Travel's 2026 paid-search cost per lead fell 39.35% year over year, the steepest drop of any industry (LocaliQ/WordStream).
- Travel's average Google Ads click-through rate is 9.32%, third-highest of 23 industries tracked.
- Travel buys the second-cheapest Facebook traffic clicks at USD 0.42, after Arts and Entertainment.
- Boutique portfolio median direct-booking share was 69% against a roughly 63% OTA share reported industry-wide for independents.
- Median hotel website conversion sits in the 2.2% to 3.9% range across 2026 industry commentary, with high performers clearing 5%.
The benchmark, split by what the page actually sells
The 4.8% median that gets quoted as "travel's conversion rate" is an average of very different pages. Unbounce's Conversion Benchmark Report, drawn from more than 57 million conversions across 41,000 landing pages, breaks the vertical into accommodations (3.7%), food and beverage, and transportation and travel services (14.8%). A hotel booking page and a rental-car quote form are not competing for the same visitor intent, and benchmarking one against the other's rate is the first CRO mistake most operators make.
| Travel subcategory | Median conversion rate | vs. all-industry 6.6% median | Source |
|---|---|---|---|
| All travel and hospitality (blended) | 4.8% | -37% | Unbounce Conversion Benchmark Report |
| Accommodations (hotels, rentals) | 3.7% | -44% | Unbounce Conversion Benchmark Report |
| Transportation and travel services | 14.8% | +124% | Unbounce Conversion Benchmark Report |
| Top 25% of travel and hospitality pages | 15.6%+ | +136% | Unbounce Conversion Benchmark Report |
| Independent hotel websites (general commentary) | 2.2%-3.9% | -41% to -68% | 2026 industry benchmark roundups, STR-sourced |

Where the booking engine loses people
Most of the visitor volume in hospitality is mobile, and most of the lost conversions are too. Unbounce reports desktop converting 10.4% better than mobile in travel and hospitality specifically, a wider gap than the 8% average across all industries. Pixel and Polish's 2026 Boutique Hotel Direct Booking Benchmark, built from anonymized portfolio data with a stated method (June 2025 to June 2026, medians with 25th to 75th percentile ranges), puts mobile at roughly 62% of sessions converting 1.8 to 2.3 times worse than desktop, and finds that roughly 62% of visitors who reach the booking engine abandon it before finishing.
That is two different problems wearing one label. The traffic mix has moved to mobile; the booking engine's checkout flow has not caught up to it.
| Metric | Figure | Source | What it means for the page |
|---|---|---|---|
| Desktop vs mobile conversion gap, travel | Desktop 10.4% better | Unbounce | Mobile checkout is the priority fix, not desktop polish |
| Mobile share of booking-engine sessions | ~62% | Pixel and Polish, 2026 | Most of the volume arrives on the weaker-converting device |
| Booking-engine abandonment (reached engine, did not finish) | ~62% | Pixel and Polish, 2026 | The leak is post-click, inside the booking flow itself |
| Mobile vs desktop conversion multiple, boutique portfolios | 1.8x-2.3x | Pixel and Polish, 2026 | A mobile-first rebuild, not a responsive patch, is the real fix |
Speed is not a technical nice-to-have here, it is measured revenue
Google's Milliseconds Make Millions study, run with 55 and Deloitte across 37 European and US retail, travel, luxury and lead-gen sites and tracked hour-by-hour over 30 days, found that a 0.1-second improvement across four load metrics (first meaningful paint, estimated input latency, observed load, and max server latency) lifted travel-site booking-rate progression by 10% and checkout completion by 2.2%. Travel also recorded the largest homepage bounce-rate improvement of any vertical tested at that speed gain, 6.5%. Separately, Think with Google's mobile-experience research measured average travel mobile pages loading in 10.1 seconds, against a documented 53% abandonment rate once a mobile page passes 3 seconds.
Ten seconds against a three-second abandonment cliff is not a rounding error - it is most of the funnel gone before the offer is even visible. Our performance creative practice treats booking-engine speed as a conversion lever, not an engineering afterthought.
The direct-vs-OTA economics a landing page has to compete against
Cloudbeds' 2026 State of Independent Hotels report, compiled from 90 million bookings across 180 countries, found OTA share of independent-hotel bookings at 63.4% against 36.6% direct - and the durability gap matters as much as the split. OTA cancellation rates ran 21.8%, more than double the 10.6% rate for direct bookings. Boutique portfolio data from Pixel and Polish, drawing on the same period, reported a materially higher median direct-booking share of 69% among independents in its own book of business, evidence that a well-run direct channel can outperform the industry-wide OTA-dependence trend rather than assume it.
A landing page cannot change rate parity clauses or loyalty program economics. What it can do is close the trust gap that sends bookers to a familiar OTA logo instead of an unfamiliar property site: visible reviews, a price-match statement, and a checkout that finishes in fewer steps than the OTA's.
| Channel economics (2026) | Figure | Source |
|---|---|---|
| OTA share of independent-hotel bookings | 63.4% | Cloudbeds, 90M bookings, 180 countries |
| Direct share of independent-hotel bookings | 36.6% | Cloudbeds |
| OTA booking cancellation rate | 21.8% | Cloudbeds |
| Direct booking cancellation rate | 10.6% | Cloudbeds |
| Boutique-portfolio median direct-booking share | 69% | Pixel and Polish, own portfolio data |
What the paid-traffic side of the funnel looks like right now
Landing pages do not exist without traffic feeding them, and travel's 2026 paid numbers are unusually favorable relative to other verticals - which raises the stakes on what happens after the click. LocaliQ/WordStream's 2026 Google Ads benchmark report, built from over 13,000 campaigns across 23 industries, found travel's cost per lead falling 39.35% year over year, the steepest drop of any industry tracked, alongside a 9.32% average click-through rate, third-highest of the 23. On the social side, travel bought the second-cheapest Facebook traffic clicks in the same benchmark set, at USD 0.42, behind only Arts and Entertainment.
Cheaper, more plentiful clicks landing on a page that converts 37% below the all-industry median is the exact combination that makes a CRO project pay for itself faster than a media-budget increase would. Our growth marketing team runs that comparison before recommending either lever.
| Paid-traffic metric (2026) | Travel figure | All-industry figure | Source |
|---|---|---|---|
| Google Ads cost-per-lead, YoY change | -39.35% | n/a (steepest drop of 23 industries) | LocaliQ/WordStream |
| Google Ads click-through rate | 9.32% | 6.64% | LocaliQ/WordStream |
| Google Ads cost per click | USD 2.14 | USD 5.42 | LocaliQ/WordStream |
| Facebook traffic-campaign cost per click | USD 0.42 | USD 0.60 | WordStream 2026 Facebook Ads Benchmarks |
What AI-mediated search is starting to change about the booking page
A landing page built purely for a human clicking through search results is no longer the whole job. Skift's coverage of new research from Aven Hospitality and h2c found that 44% of travelers using AI-powered search now treat it as their primary source of travel insight, ahead of traditional search engines, brand websites and review platforms - and that only 11% of hotel organizations have deployed AI agents capable of completing a booking end to end. The same research found 80% of hotel chains already using AI in some capacity, mostly in chatbots and marketing automation rather than the booking-page infrastructure that would let an AI assistant actually transact.
For CRO purposes, the practical implication is that a booking page's structured data, rate accuracy and machine-readable content are becoming part of the conversion path, not a separate SEO task. A page an AI system cannot read accurately will not be surfaced at the moment a traveler asks an assistant to book for them, regardless of how well it converts a human visitor who arrives by search.
| AI-search readiness signal (2026) | Figure | Source |
|---|---|---|
| Travelers treating AI search as primary travel-insight source | 44% | Aven Hospitality / h2c, via Skift |
| Hotel chains already using AI in some capacity | 80% | Aven Hospitality / h2c, via Skift |
| Hotel organizations with AI agents that can complete a booking | 11% | Aven Hospitality / h2c, via Skift |
How much of the booking journey is already happening before the landing page loads
Industry-wide research on short-term rental distribution (2024 data, widely reported across 2026 travel research updates) found roughly 80% of short-term rental hosts using a marketplace-type listing site (Airbnb, Vrbo and similar), while only about 35% of hosts received any bookings through their own site - and that hosts pursuing direct bookings lean on SEO, social content and incentives specifically to shift demand away from the marketplace. That 35% figure is the honest ceiling most independent operators are working against before a single landing-page test even runs: the booking engine has to overcome a channel-preference habit that starts long before the click. Cloudbeds' property-level data corroborates the same pattern at the hotel level, with direct bookings sitting at 36.6% industry-wide in 2026.
| Booking-channel starting point (2026) | Figure | Source |
|---|---|---|
| Short-term-rental hosts using a marketplace-type site (2024 data) | ~80% | 2026 travel-research updates |
| Hosts receiving bookings via their own site (2024 data) | ~35% | 2026 travel-research updates |
| Independent hotel direct-booking share (all-property, 2026) | 36.6% | Cloudbeds |
A realistic CRO test plan for a booking page
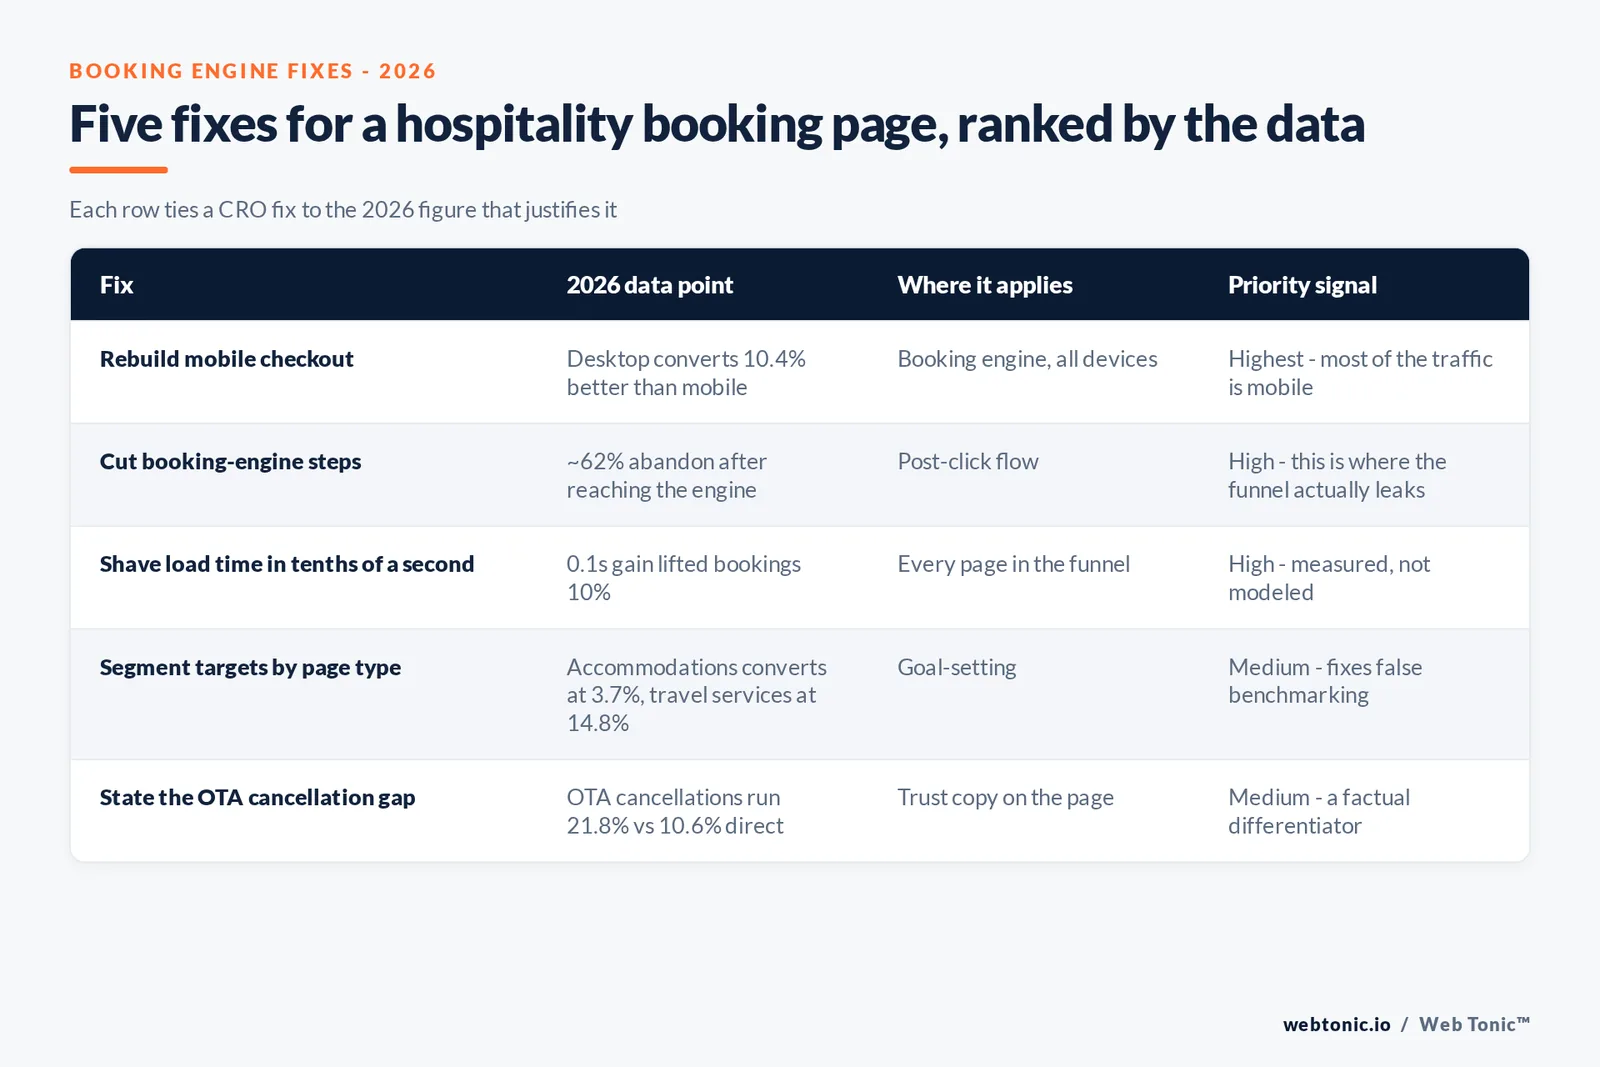
- Rebuild the mobile checkout first. With 62% of sessions mobile and a 10.4% device conversion gap, this is the highest-leverage fix, not a stretch goal.
- Cut the booking engine's steps, not the marketing copy. The 62% mid-engine abandonment rate points to post-click friction, which page-copy tests alone will not solve.
- Chase load time in tenths of a second, not whole seconds. The measured lift came from 0.1-second gains across four specific metrics, not a full redesign.
- Segment the benchmark by page type before setting a target. An accommodations page should be judged against 3.7%, not the 14.8% travel-services figure.
- Put the OTA cancellation-rate gap in the copy. Direct bookings cancel at less than half the OTA rate - a factual trust point most hotel pages never state.
Read our related breakdown of what paid search actually costs before setting the media budget that feeds this funnel, or talk to us about a booking-engine CRO audit.
Frequently Asked Questions
Why do hospitality and travel landing pages convert below average?
Unbounce's Conversion Benchmark Report, built from more than 57 million conversions across 41,000 landing pages, puts the travel and hospitality median at 4.8% against a 6.6% all-industry median - a 37% gap. The drag comes almost entirely from accommodations pages, which convert at 3.7%, while transportation and travel-services pages convert at 14.8%. Lumping every booking page into one benchmark hides which page type is actually underperforming.
Is mobile or desktop the bigger problem for booking pages?
Both, for different reasons. Unbounce reports desktop converting 10.4% better than mobile specifically in travel and hospitality, worse than the 8% all-industry gap, even though most of the traffic is mobile. Independent operator data from Pixel and Polish's 2026 Boutique Hotel Direct Booking Benchmark puts mobile at roughly 62% of sessions but converting 1.8 to 2.3 times worse than desktop, and finds that roughly 62% of visitors who reach the booking engine never finish it. The honest read is a booking-engine friction problem that mobile simply exposes faster.
Does page speed actually move hotel bookings, or is that assumed?
It is measured, not assumed. Google's Milliseconds Make Millions study, run with 55 and Deloitte across 37 European and US travel, retail and lead-gen sites over 30 days of session data, found that a 0.1-second improvement across four load-time metrics lifted travel booking-rate progression by 10% and checkout completion by 2.2%, with the largest homepage bounce-rate improvement of any vertical tested, 6.5%. Separate Think with Google research measured average travel mobile pages loading in 10.1 seconds against a 53% abandonment threshold at 3 seconds.
Is losing bookings to OTAs a landing page problem or a trust problem?
Some of both. Cloudbeds' 2026 State of Independent Hotels report, built from 90 million bookings across 180 countries, found OTA share of independent-hotel bookings at 63.4% against 36.6% direct, with OTA cancellation rates at 21.8% versus 10.6% for direct bookings - meaning direct bookings are also the more durable revenue. A landing page cannot fix rate parity or loyalty economics, but it can close the trust gap: reviews, price-match guarantees and a visibly faster checkout are the levers a CRO project actually controls.
What is a realistic conversion-rate target for a hotel or travel landing page in 2026?
Use the top-quartile figure, not the median, as your target: Unbounce puts the top 25% of travel and hospitality pages at 15.6% or higher, more than three times the segment median. For lead-generation formats specifically (quote requests, group bookings), a much older but still-cited Unbounce study found the very best travel lead-gen pages converting above 25%, with the 90th percentile line at 19.7% - useful as a stretch goal, not a promise.
Sources
Unbounce - Travel and hospitality conversion benchmark report
Unbounce - What's a good conversion rate (41,000 landing pages)
Pixel and Polish - The Boutique Hotel Direct Booking Benchmark, 2026 edition
Think with Google, 55 and Deloitte - Milliseconds Make Millions
web.dev - Milliseconds Make Millions case study summary
Cloudbeds - 2026 State of Independent Hotels report
LocaliQ/WordStream - 2026 Google Ads industry benchmarks
WordStream - Digital benchmarks by industry, PPC
Skift, citing Aven Hospitality / h2c - The new search economy white paper


