



Table of contents

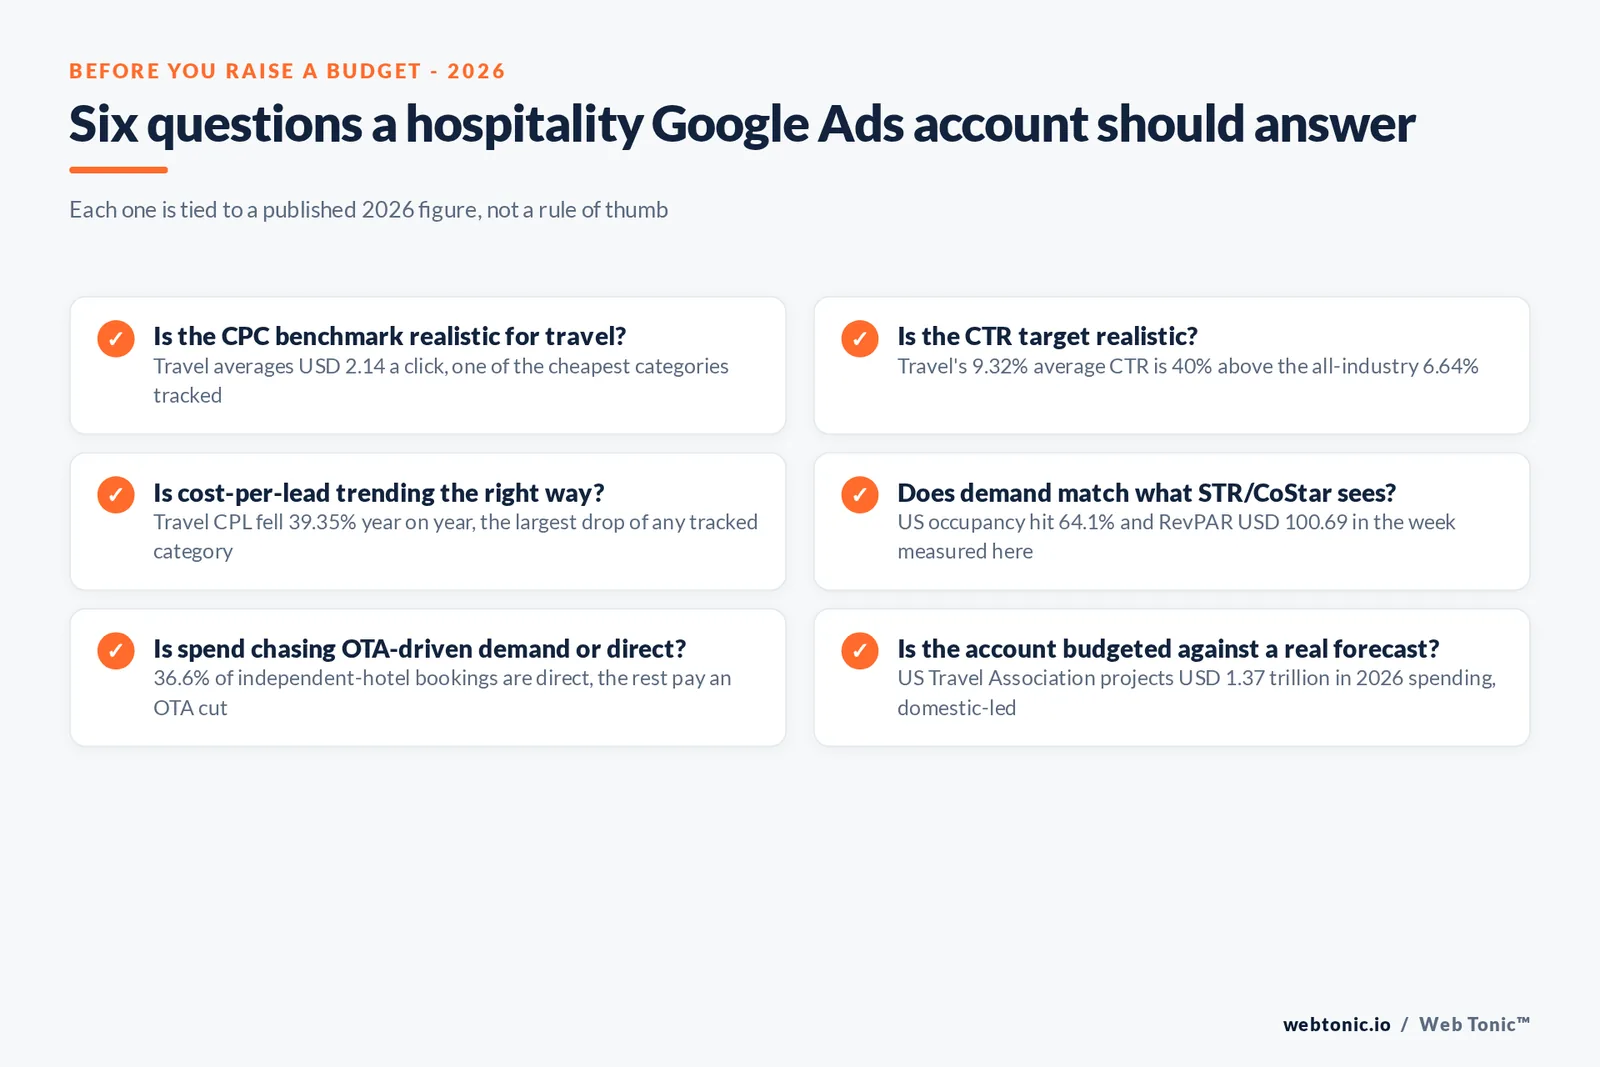
Travel's average Google Ads click costs USD 2.14, and its cost per lead fell 39.35% year over year in 2026 - the largest such decline of any of the 23 industries LocaliQ tracked. That's the paid-media backdrop. Whether it's worth spending against depends on what real hotel demand data says at the same moment, and on how much of the resulting booking a Google Ads click actually helps the brand capture versus an OTA.
Key Takeaways
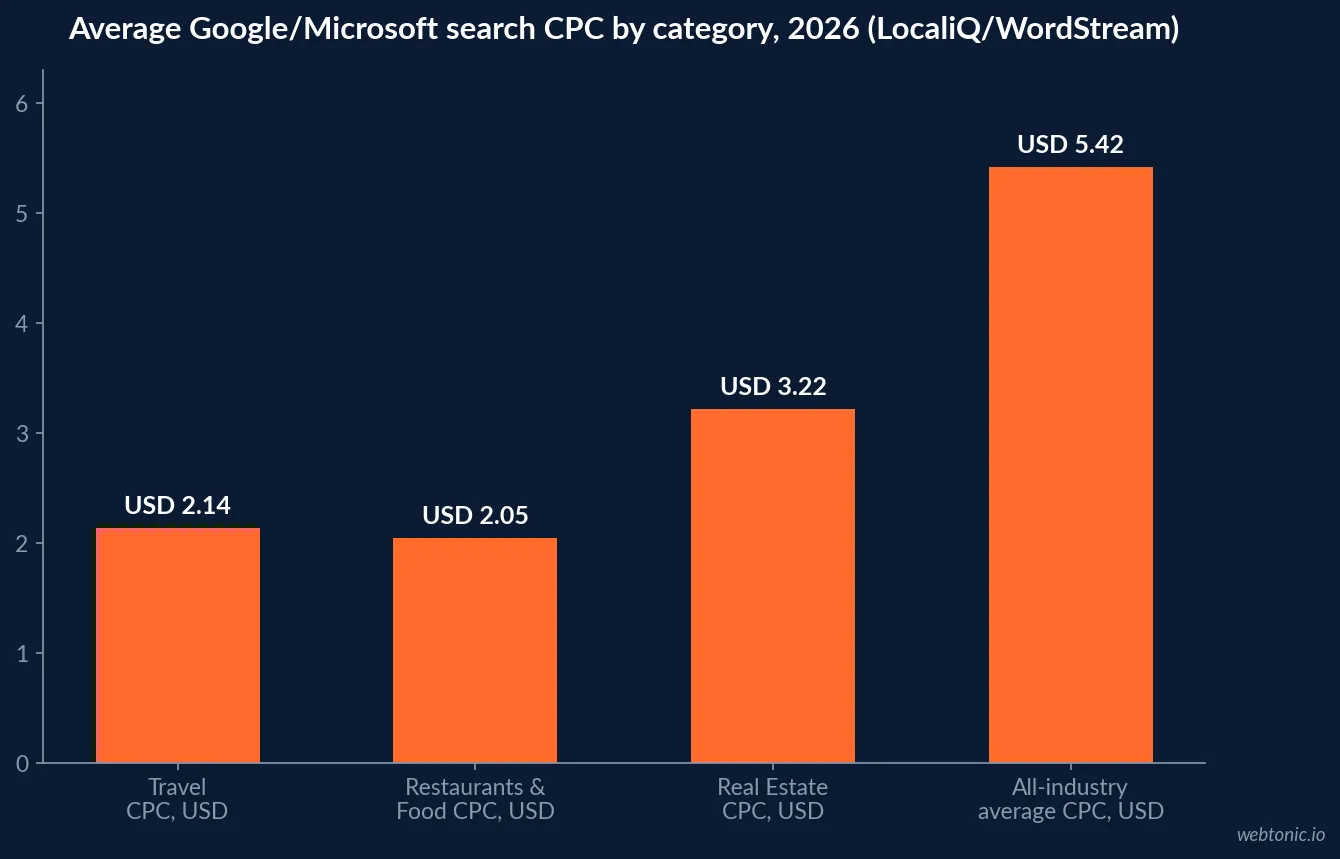
- Travel's average search CPC is USD 2.14, well under the USD 5.42 all-industry average.
- Travel's average search CTR is 9.32%, versus 6.64% all-industry.
- Travel's cost per lead fell 39.35% year over year, the largest drop of 23 industries tracked.
- Conversion rate rose in 87% of industries LocaliQ tracked in 2026.
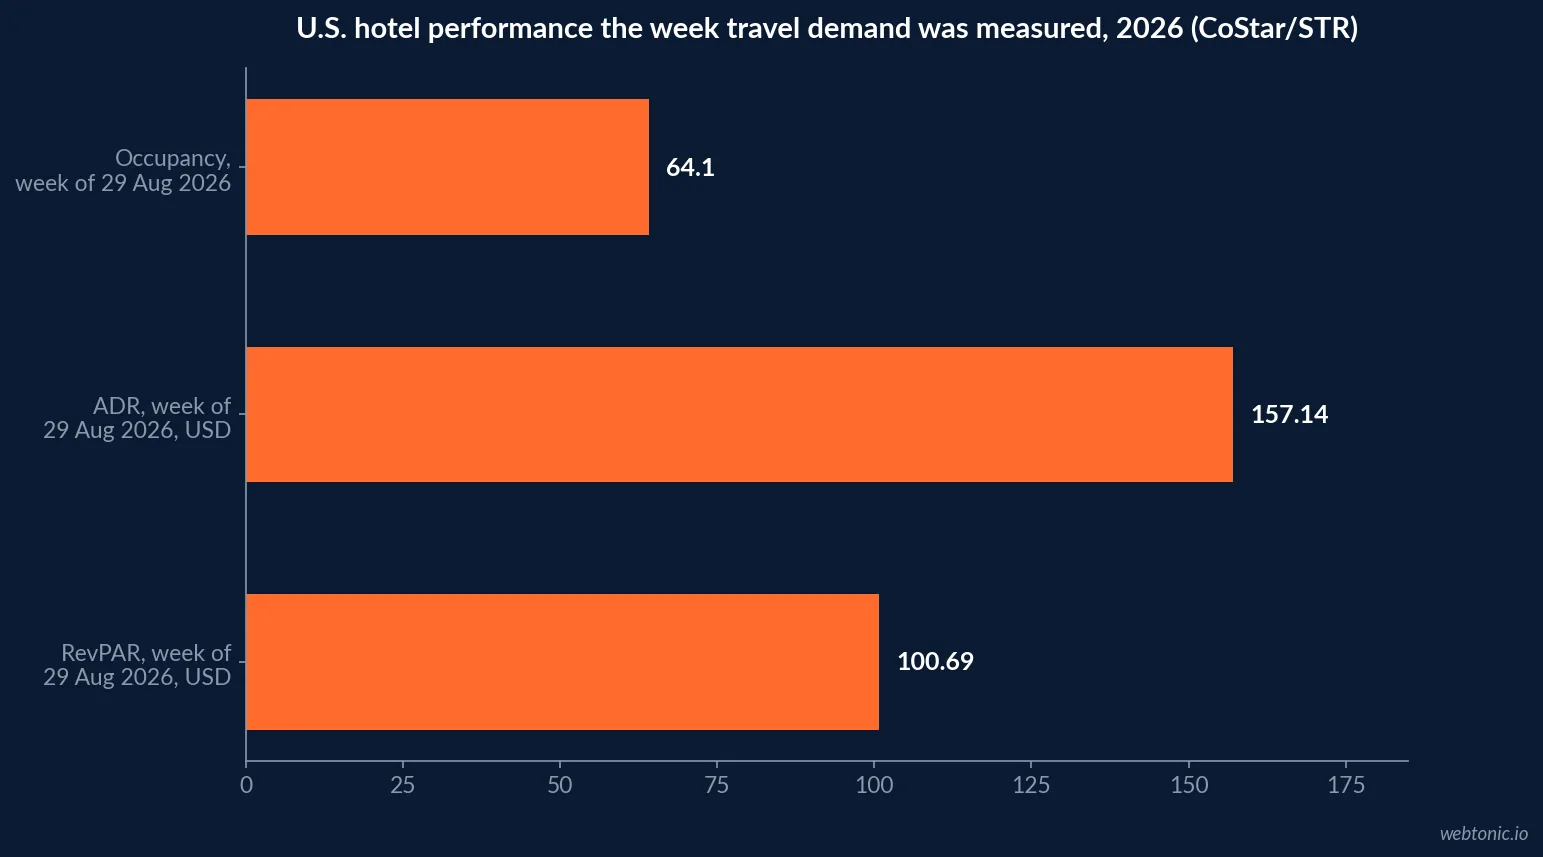
- US hotel occupancy hit 64.1% the week of 29 August 2026, up 1.1% year over year.
- Average daily rate reached USD 157.14 that same week, up 0.6%.
- RevPAR hit USD 100.69, up 1.7% - a 20th straight week of gains.
- STR/Tourism Economics project full-year 2026 RevPAR growth of +4.4%.
- US hotel guest spending is forecast at nearly USD 805 billion in 2026, up 1.7%.
- Hotels paid nearly USD 128 billion in wages and benefits in 2025, headed to USD 131 billion.
- Independent hotels keep only 36.6% of bookings direct; 63.4% go through an OTA.
- US properties hold the strongest direct share among major markets, at 53.3%.
- US total travel spending is forecast at USD 1.37 trillion in 2026.
- That spending grows just 1% inflation-adjusted in 2026, accelerating to 3% in 2027-28.
- 88% of smartphone travelers would switch sites if the current one underperforms.
What the auction actually costs right now
LocaliQ/WordStream's 2026 Search Advertising Benchmarks, built from over 13,000 campaigns across 23 industries running April 2025 through March 2026, put Travel's average cost per click at USD 2.14 against a USD 5.42 all-industry average - one of the three cheapest categories tracked, alongside Restaurants & Food and Sports & Recreation. Travel's average click-through rate of 9.32% is also well above the 6.64% all-industry line, meaning the category combines a cheap floor with strong engagement, a pairing most verticals don't get simultaneously.
| Category (2026, LocaliQ/WordStream) | Average CPC | Average CTR | YoY change in cost per lead |
|---|---|---|---|
| Travel | USD 2.14 | 9.32% | -39.35% (largest drop tracked) |
| Physicians & Surgeons | USD 4.76 | 6.61% | -29.54% |
| Beauty & Personal Care | USD 4.62 | 6.75% | -34.95% |
| Real Estate | USD 3.22 | 7.61% | not among the largest movers |
| All-industry average | USD 5.42 | 6.64% | CPL declined overall for the first time in five years |
Why lead costs fell harder in travel than almost anywhere else
The same LocaliQ/WordStream report found 2026 marked the first year-over-year decline in average cost per lead across search advertising in five years, and travel led that shift with a 39.35% drop - ahead of Beauty & Personal Care (-34.95%) and Physicians & Surgeons (-29.54%). The industries that saw cost per lead rise instead were concentrated in categories affected by tariffs, including automotive and retail. Conversion rate also rose across 87% of tracked industries in 2026, which is the more important half of the story: cheaper leads that also convert better is a compounding advantage, not just a discount.
Checking the ad spend against real hotel demand
CoStar's STR benchmark data for the week ending 29 August 2026 recorded US occupancy at 64.1% (up 1.1% year over year), average daily rate at USD 157.14 (up 0.6%) and RevPAR at USD 100.69 (up 1.7%) - the 20th consecutive week of positive year-over-year comparisons. STR and Tourism Economics project full-year 2026 RevPAR growth of +4.4%, driven by both demand (+1.7%) and rate (+3.1%). Twenty straight weeks of growth is a stronger signal to hold or raise search budget than any single benchmark table, because it confirms the demand a campaign is chasing is real and current, not seasonal noise.
| Hotel performance signal | Figure | Source |
|---|---|---|
| US occupancy, week of 29 Aug 2026 | 64.1% (+1.1% YoY) | CoStar/STR benchmark data |
| US ADR, week of 29 Aug 2026 | USD 157.14 (+0.6% YoY) | CoStar/STR benchmark data |
| US RevPAR, week of 29 Aug 2026 | USD 100.69 (+1.7% YoY) | CoStar/STR benchmark data |
| Full-year 2026 RevPAR growth forecast | +4.4% | STR/Tourism Economics |
| Consecutive weeks of positive YoY comparisons | 20 | CoStar/STR benchmark data |
What the industry's own numbers say about the year
AHLA's 2026 State of the Industry report projects US hotel guest spending reaching nearly USD 805 billion in 2026, a 1.7% increase over 2025, with hotels generating USD 85.1 billion in local, state and federal taxes in 2025 and paying close to USD 128 billion in wages and benefits, projected to approach USD 131 billion in 2026. The hotel workforce is projected to grow by more than 30,000 jobs. That's a mature, steadily expanding category rather than a boom - Google Ads budget cases here should be built on capturing share of stable demand, not on a rising tide lifting every campaign.
| Industry signal (AHLA 2026 State of the Industry) | Figure |
|---|---|
| US hotel guest spending forecast, 2026 | nearly USD 805 billion (+1.7%) |
| Hotel tax contribution, 2025 | USD 85.1 billion |
| Hotel wages and benefits paid, 2025 | nearly USD 128 billion |
| Hotel wages and benefits forecast, 2026 | approaching USD 131 billion |
| Projected hotel workforce growth, 2026 | over 30,000 jobs |
The OTA share Google Ads has to overcome
Cloudbeds' 2026 State of Independent Hotels report, built from 90 million bookings across 180 countries, found independent hotels keep only 36.6% of bookings direct against 63.4% through an OTA - and OTA share grew in every key market measured. US properties hold the strongest direct share among major markets at 53.3%, while Portugal (20.3%) and Spain (23.3%) lean far more heavily on third parties. A Google Ads campaign that drives traffic to a booking page without a conversion rate competitive with an OTA's one-click checkout is paying for awareness the OTA is more likely to convert.
Why the segment a campaign targets changes the bidding math
STR and Tourism Economics' August 2026 forecast assumptions project double-digit RevPAR growth for luxury chains in both Q2 and Q3 2026, lifting full-year luxury ADR growth to +5.9%, while select-service properties are expected to end 2026 at roughly +3.6% RevPAR with ADR growth around +2.5%. Midscale and economy hotels see RevPAR growth driven mainly by demand rather than rate, since financial pressure on budget-conscious travelers limits how much those properties can raise prices. A Google Ads account bidding the same way across a luxury resort brand and a midscale chain is bidding against two different growth curves.
| Hotel segment (STR/Tourism Economics, Aug 2026 forecast) | 2026 RevPAR growth | Primary driver |
|---|---|---|
| Luxury chains | Double-digit in Q2-Q3, +5.9% full-year ADR | Rate |
| Select-service | roughly +3.6% | Rate, ADR +2.5% |
| Midscale and economy | Positive but rate-constrained | Demand, not rate |
| All-scale full-year forecast | +4.4% RevPAR | Mix of demand +1.7% and ADR +3.1% |
What the traveler on the other end of the click actually wants
Expedia Group's Traveler Value Index, a Wakefield Research survey of 11,000 respondents across 11 markets, and Booking.com's 2026 Travel Predictions, based on 29,733 respondents across 33 countries, both point to travelers prioritizing flexibility, individuality and enhanced technology features in how they choose and book a stay. On the search side, Google's own 2026 travel trends analysis found "AI flight booking" search interest up 315% year over year and "solo travel" search interest at an all-time high - signals worth testing directly in ad copy and audience targeting rather than assuming last year's messaging still lands.
| Traveler research signal (2025-26) | Figure | Source |
|---|---|---|
| Traveler Value Index survey size | 11,000 respondents, 11 markets | Expedia Group / Wakefield Research |
| Booking.com 2026 predictions survey size | 29,733 respondents, 33 countries/territories | Booking.com |
| Search interest in 'AI flight booking', YoY | +315% | Google 2026 travel trends |
| Search interest in 'AI travel assistant', YoY | +350% | Google 2026 travel trends |
Building the budget case
Confirm current STR/CoStar occupancy and RevPAR trends before committing new budget, since travel's cheap CPC and falling CPL only matter if real demand supports them. Prioritize booking- page conversion rate work alongside search spend, since OTAs still win nearly two-thirds of bookings by default. And size the account against AHLA and US Travel Association's steady, low- single-digit growth forecasts rather than a boom-year assumption. Our growth marketing practice builds hospitality search accounts around this mix of live performance data and booking-page economics; see our guide on what Google Ads actually costs for the account-level math, or talk to us about a hospitality account review.
Frequently Asked Questions
What does a click cost in Google Ads for a travel or hospitality brand?
Travel averages USD 2.14 per click in LocaliQ/WordStream's 2026 Search Advertising Benchmarks, built from over 13,000 campaigns across 23 industries. That's less than half the USD 5.42 all-industry average and one of the three cheapest categories tracked, alongside Restaurants & Food (USD 2.05) and Sports & Recreation (USD 2.77). Cheap clicks reflect high search volume and a category Google's auction doesn't treat as high-value per click the way Legal Services (USD 9.87) or Home Improvement (USD 8.33) are priced.
Did lead costs actually get cheaper for travel advertisers in 2026?
Yes, more than for almost any other category. LocaliQ/WordStream reported travel's cost per lead fell 39.35% year over year in 2026 - the single largest decline of the 23 industries in the report, ahead of Beauty & Personal Care (down 34.95%) and Physicians & Surgeons (down 29.54%). The report also notes that conversion rate increased for 87% of tracked industries in 2026, meaning the traffic clicking through is converting at a higher rate even as it costs less to acquire.
How do I know if the demand my ads are chasing is actually there?
Check it against real-time hotel performance data rather than a seasonal assumption. CoStar's STR benchmark data for the week ending 29 August 2026 recorded US occupancy at 64.1% (up 1.1% year over year), average daily rate at USD 157.14 (up 0.6%) and RevPAR at USD 100.69 (up 1.7%) - the 20th consecutive week of positive year-over-year comparisons. Twenty straight weeks of growth is a reasonable signal to keep search budget flowing rather than pulling back on a hunch.
Should Google Ads budget go toward the brand's own site or toward beating OTAs on price?
Toward the brand's own site conversion, mainly, because OTAs already win the majority of bookings by default. Cloudbeds' 2026 State of Independent Hotels report found independent hotels keep only 36.6% of bookings direct globally, with 63.4% going through an OTA - and OTA share grew in every key market measured. A hospitality Google Ads budget aimed only at driving traffic, without a booking-page conversion rate strong enough to beat an OTA's convenience, is subsidizing awareness for a booking the OTA is more likely to close.
Is overall hospitality advertising demand growing enough to justify a bigger Google Ads budget?
Modestly, and it varies by segment. AHLA's 2026 State of the Industry report projects US hotel guest spending reaching nearly USD 805 billion in 2026, a 1.7% increase over 2025, with the hotel workforce growing by more than 30,000 jobs. The US Travel Association's Spring 2026 forecast puts total US travel spending at USD 1.37 trillion, growing just 1% inflation-adjusted this year before accelerating to 3% in 2027-28. That's steady, not explosive growth - a budget case built on category tailwinds should set expectations accordingly rather than assume compounding growth.
Sources
LocaliQ/WordStream - 2026 Search Advertising Benchmarks by Industry
CoStar - U.S. hotel results for week ending 29 August 2026 (STR benchmark data)
American Hotel & Lodging Association - 2026 State of the Industry
Cloudbeds - The 2026 State of Independent Hotels
U.S. Travel Association - Spring 2026 Travel Forecast
Expedia Group - Traveler Value Index
Booking.com - 2026 Travel Predictions
Google - 2026 Travel Trends and Top Destinations


