



Table of contents

Paint - the most visually driven product in the category - is bought by 62% of renovating homeowners, more than any other product, while Instagram reach for home goods content grew 45% and TikTok engagement fell from 2.4% to 1.4% over the same reporting window. This page tests the "visuals drive sales" claim against both what homeowners buy and how that content actually performs, rather than asserting it.
Key Takeaways
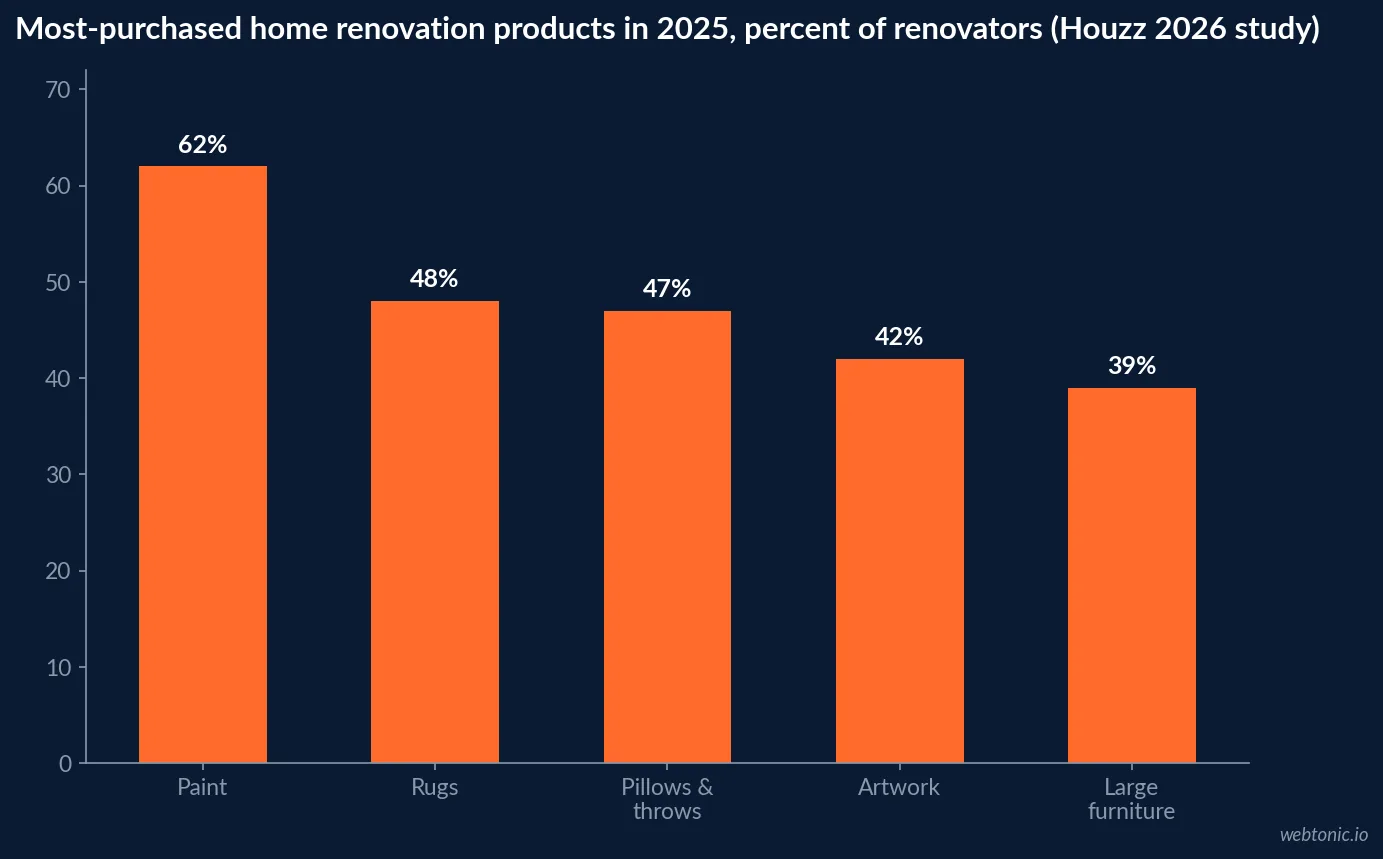
- Paint is bought by 62% of renovating homeowners, the single most common purchase (Houzz 2026).
- Rugs (48%) and pillows/throws (47%) are the top interior decor purchases.
- Artwork rose to 42%, up 1 point, overtaking furniture's prior tie.
- Furniture sits at 39% each for large and small pieces, below 2022 peaks of 50-53%.
- Instagram reach for home goods content rose 45%, with Reels the strongest discovery format (Dash Social 2026).
- YouTube Shorts views rose 127% for the category over the same window.
- TikTok engagement fell from 2.4% to 1.4%, with views down 11% despite more frequent posting.
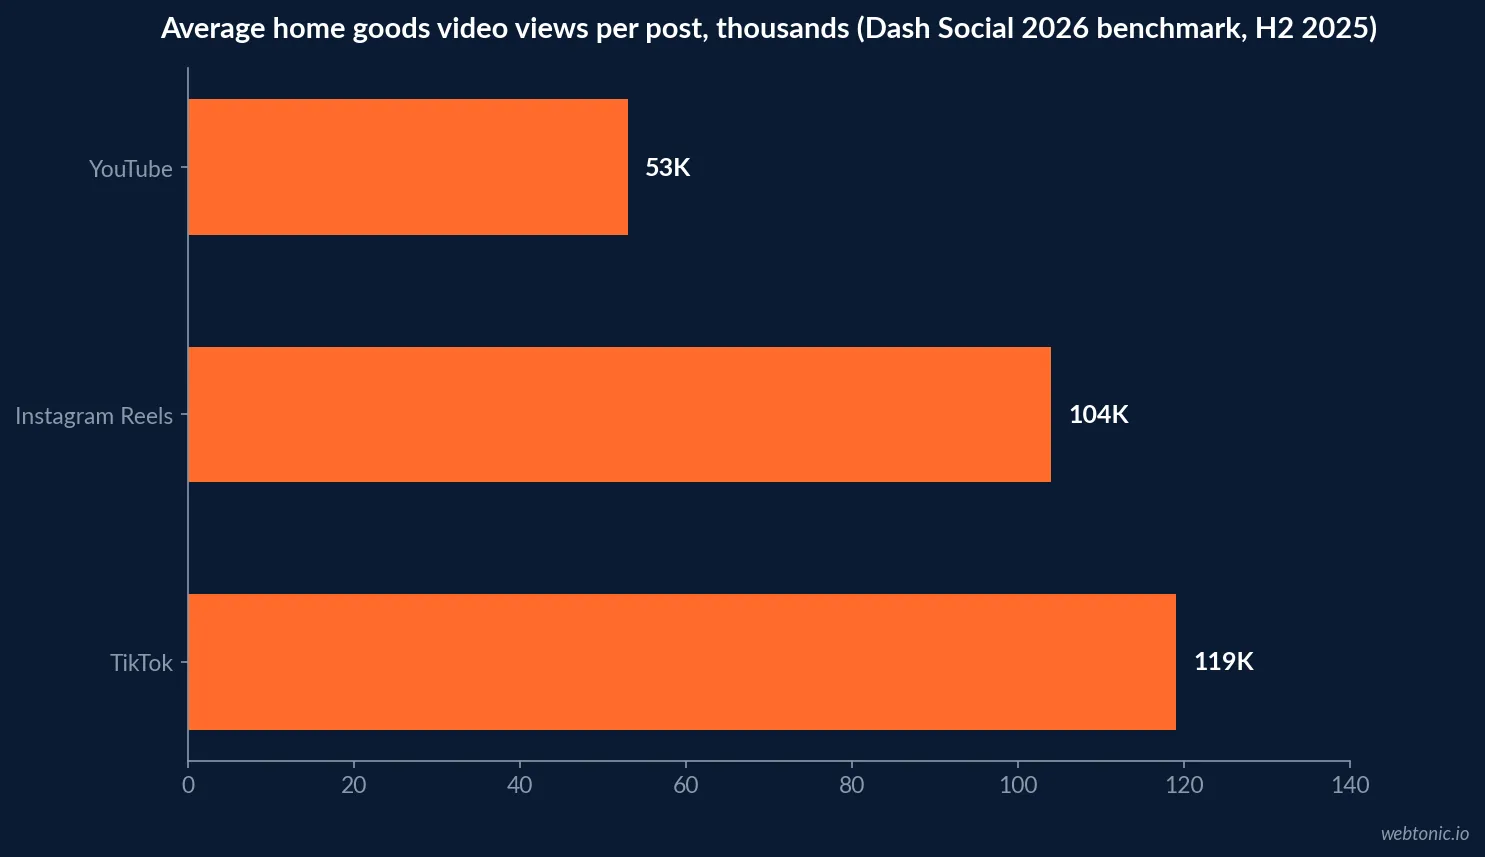
- TikTok home goods video averages 119,000 views a post, ahead of Instagram (104,000) and YouTube (53,000).
- Recommended organic engagement benchmarks: 2.5-3.0% on TikTok, 1-1.5% on Instagram (Dash Social).
- Data covers organic, boosted and promoted content, excluding paid ads - a distinct dataset from paid social spend.
What homeowners are actually buying, and why it is a visual list
The 2026 U.S. Houzz and Home Renovation Trends Study lists paint at 62% of renovating homeowners' purchases in 2025 - down 3 points year over year but still the category leader - ahead of light fixtures (48%, also down 3 points) and faucets and shower heads (46%). On the decor side specifically, rugs (48%) and pillows and throws (47%) remain the top purchases, with artwork rising 1 point to 42%, breaking its prior tie with large furniture, which now sits at 39% - notably below its 2022 peak of 50%.
| Product-buying purchase (2025) | Share of renovating homeowners | YoY change | Category |
|---|---|---|---|
| Paint | 62% | -3pp | Product |
| Rugs | 48% | flat | Interior decor |
| Pillows and throws | 47% | flat | Interior decor |
| Artwork | 42% | +1pp | Interior decor |
| Large furniture (indoor) | 39% | well below 2022's 50% | Interior decor |
What that content actually does on each platform
Dash Social's 2026 Home Goods Industry Benchmark Report (a sample of global brands across TikTok, n=1,361; Instagram, n=3,363; and YouTube, n=616, covering July to December 2025, organic plus boosted/promoted content but excluding paid ads) found a genuine platform split: Instagram reach rose 45% with Reels remaining the strongest discovery format, and YouTube Shorts views rose 127% with high watch-through rates. TikTok told a different story - brands posted more often (averaging 3 posts a week) but engagement fell from 2.4% to 1.4% and views dropped 11%, which Dash Social frames as a shift from "static visuals to video-led discovery" outrunning brands' ability to keep pace with quality.
| Platform signal (Dash Social 2026, H2 2025) | Figure | Direction |
|---|---|---|
| TikTok engagement rate | 2.4% -> 1.4% | Down |
| TikTok video views | Down 11% | Down |
| Instagram reach | Up 45% | Up |
| YouTube Shorts views | Up 127% | Up |
| TikTok posting frequency | ~3 posts/week | Selective, not volume-driven |
Matching product to format instead of posting everywhere the same way
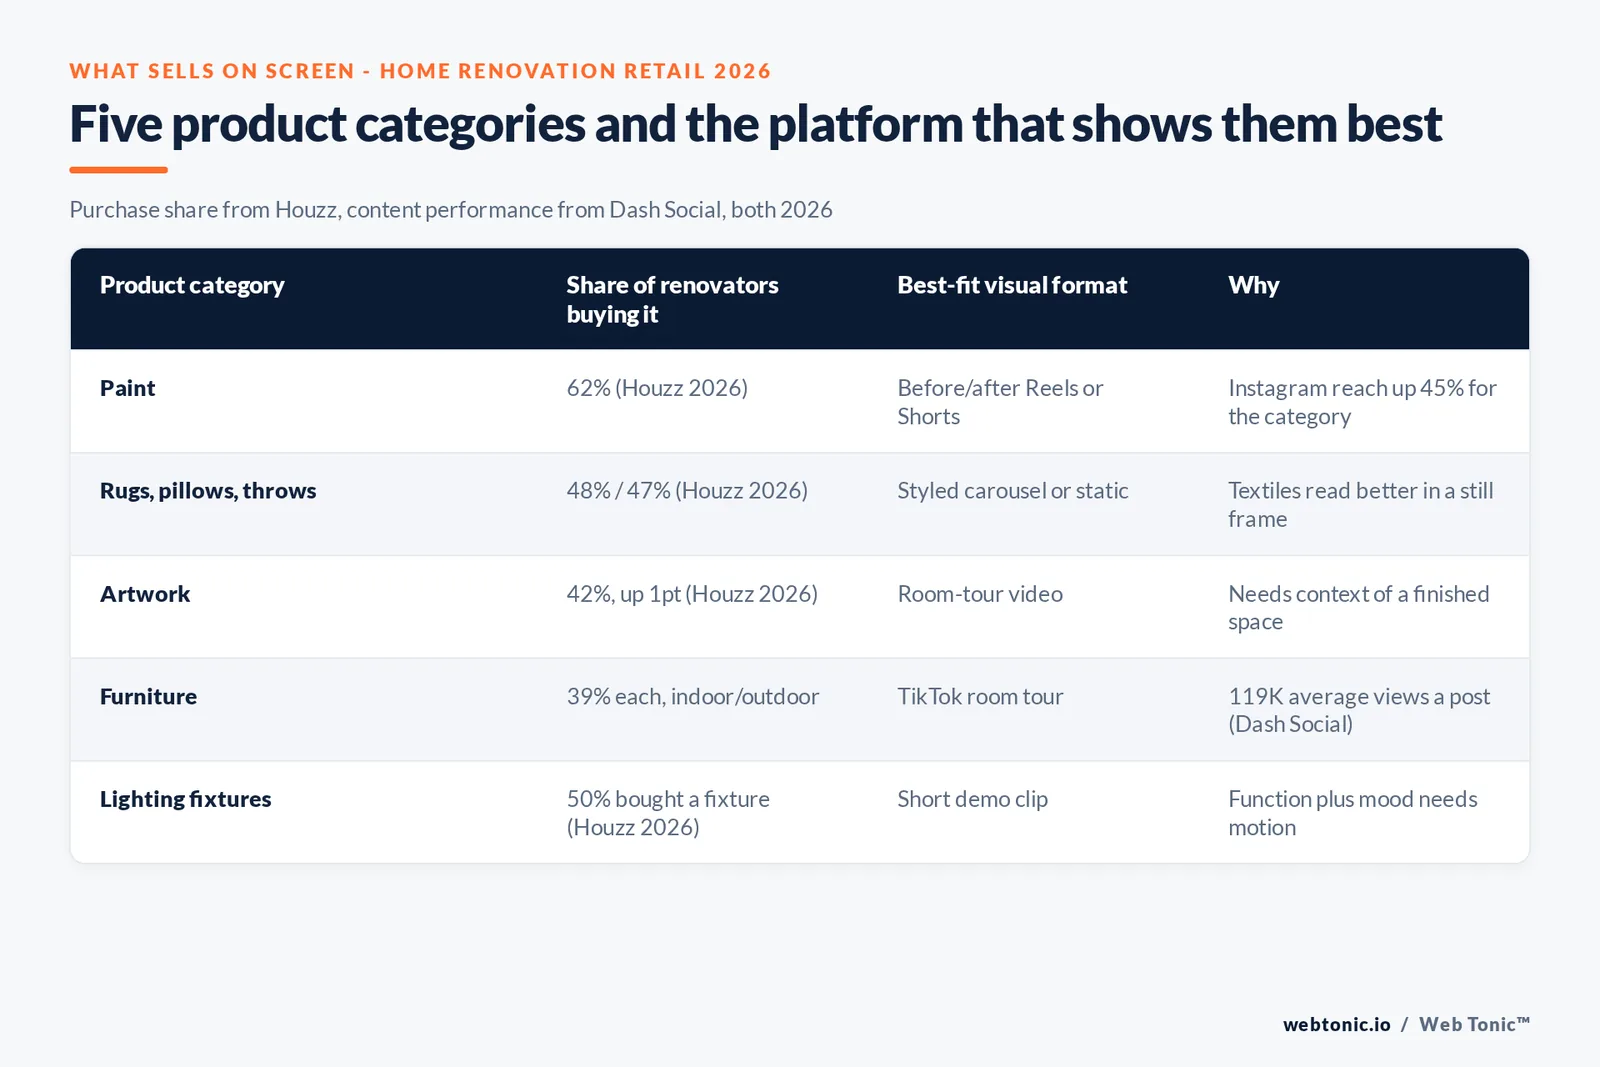
The purchase data and the content data point in a consistent direction: textiles and decor (rugs, pillows, artwork) read well in a styled static image or carousel, while paint, lighting and furniture benefit from a before/after or room-tour video where the transformation - not just the object - is the selling point. Dash Social's recommended organic engagement benchmarks for home goods brands are 2.5% to 3.0% on TikTok and 1% to 1.5% on Instagram; a brand sitting at the reported category average of 1.4% on TikTok is at the floor, not a target.
The clearest planning implication is a content calendar built around what a product actually looks like in use, not a generic weekly posting cadence. A paint SKU photographed on a shelf will not move the needle the way the same paint shown mid-application in a 20-second before/after clip will, and the purchase-frequency data above says paint is worth that production investment more than almost any other category in the store.
Why the format-matching argument matters more than a single "best platform"
Treating "social media" as one channel misses the actual signal in Dash Social's data: Instagram and YouTube grew reach and views over the same window that TikTok's engagement and views fell, despite more frequent TikTok posting. That is not a story about one platform winning - it is a story about quality and format fit mattering more than raw posting volume, which is exactly the discipline a product-to-format map like the one below is built to enforce rather than a generic "post more" content calendar.
| Content mistake | What the data says instead | Fix |
|---|---|---|
| Posting the same static photo everywhere | Video drove all the platform-level gains in H2 2025 | Shoot a short video version of every hero shot |
| Treating TikTok as a volume game | Engagement fell despite brands posting more often | Cut frequency, raise per-post production quality |
| Ignoring YouTube Shorts | Views up 127%, the single biggest platform gain | Repurpose top Reels/TikToks as Shorts |
| Skipping product tagging on decor posts | Rugs, pillows and artwork are top-5 purchases | Tag SKUs directly in styled decor posts |
How this connects to the retailer landscape
HIRI's 2024 OpenBrand data (used elsewhere in this series for retailer market share) also breaks out category-level dollar share: Major Appliances led at 20% of category dollars in 2024, followed by Lawn & Garden and Home Care Products at 14% each. None of the top three categories by dollar volume is the same as the top five by purchase frequency in Houzz's data (paint, rugs, pillows, artwork, furniture) - a reminder that the products people buy most often are not always the ones generating the most revenue, and a social content plan optimized purely for purchase frequency will under-represent the appliance and lawn-care dollars that matter just as much to a retailer's bottom line.
| Category (HIRI 2024, dollar share) | Share | Purchase frequency rank (Houzz 2025) |
|---|---|---|
| Major Appliances | 20% | Not in top 10 by frequency |
| Lawn & Garden | 14% | 44% of renovators (mid-tier frequency) |
| Home Care Products | 14% | Not separately ranked by Houzz |
| Paint (Houzz top purchase) | Not separately ranked by HIRI | 62%, highest frequency |
Where the emerging channels stand
TikTok Shop's home-improvement category is showing real early growth, but mostly outside the US so far. Lengow's Q2 2026 TikTok Shop Europe report, using Kalodata's category tracking, found Home Improvement growing faster than every other filtered category above EUR 2 million in sales: +228% in Germany, +298% in Spain, +207% in Italy and +202% in France. That is a European, cross-border-commerce data point, not a US home-renovation-retail figure, and it should be read as evidence the category is forming quickly on the platform rather than as a US conversion benchmark this page can responsibly state. Build organic content performance first, using the Dash Social benchmarks above, before treating TikTok Shop as a primary revenue channel for a US retailer.
The disclosure layer under creator and review content
The FTC's 2024 rule against fake or deceptive reviews and testimonials directly covers creator content used in paid social: undisclosed brand-creator relationships, review content that misrepresents a genuine experience, and buying or suppressing reviews used as social proof are all explicit enforcement targets. A retailer repurposing a creator's before/after room tour into paid social creative needs the same disclosure standard applied to a written review on its own site.
Our performance creative practice builds format-matched content briefs from data like the table above rather than a generic content calendar; our Facebook ads pricing breakdown covers what it costs to turn that organic content into paid social once it is proven. If you want a content plan built for a specific catalog, talk to us.
Frequently Asked Questions
Do visuals actually drive home renovation retail sales, or is that just a slogan?
The purchase data supports it more than it contradicts it. Houzz's 2026 study found paint bought by 62% of renovating homeowners - the single most common purchase - followed by rugs (48%), pillows and throws (47%), artwork (42%) and furniture (39% each indoor/outdoor). Every one of those is a product category whose value is communicated almost entirely through appearance rather than a spec sheet, which is exactly the kind of product that social video and imagery are built to sell. The honest caveat: this shows what homeowners buy, not a controlled measurement of social media's specific causal lift on those purchases.
Which platform actually performs for home goods content in 2026?
Dash Social's 2026 Home Goods Industry Benchmark Report (a sample of global brands, TikTok n=1,361, Instagram n=3,363, YouTube n=616, covering July-December 2025) found Instagram reach up 45% via Reels and YouTube Shorts views up 127%, while TikTok engagement fell from 2.4% to 1.4% and views dropped 11% even as brands posted more often. The clear signal is that posting volume alone is not working on TikTok anymore - intention and format fit are doing more of the work.
What is a good engagement rate benchmark for a home goods brand on social?
Dash Social's own guidance from the same report: aim for 2.5% to 3.0% engagement on TikTok and 1% to 1.5% on Instagram. Brands should treat the category average of 1.4% on TikTok as the floor to beat, not the target - and note that Dash Social's data excludes paid ads, so these are organic-content benchmarks specifically.
Should a home renovation retailer run TikTok Shop or focus on organic content?
This is genuinely still forming, and mostly outside the US so far. Lengow's Q2 2026 TikTok Shop Europe report, using Kalodata's category tracking, found Home Improvement the fastest-growing category above EUR 2 million in sales across Germany, Spain, Italy and France, up over 200% year over year in each. No source available to this page publishes comparable sampling detail for US home-renovation-retail specifically, so treat TikTok as an organic discovery and reach channel first, with shoppable product tagging layered in once organic content is already performing, rather than launching TikTok Shop as the primary US strategy on the strength of European growth alone.
Does the FTC's fake-review rule affect social proof used in ad creative?
Yes. The FTC's 2024 rule against fake and deceptive reviews and testimonials covers creator and influencer content that misrepresents a genuine experience, undisclosed material connections between a brand and a reviewer, and company-controlled review sites that suppress negative feedback. A retailer repurposing creator before/after content in paid social creative needs the same disclosure and authenticity standard it would apply to a written review.
Sources
Houzz - 2026 U.S. Houzz and Home Renovation Trends Study
Dash Social - 2026 Home Goods Industry Benchmark Report
HIRI - 5 Key 2024 Home Improvement Trends
Federal Trade Commission - Final rule on fake reviews and testimonials, 2024


