



Table of contents
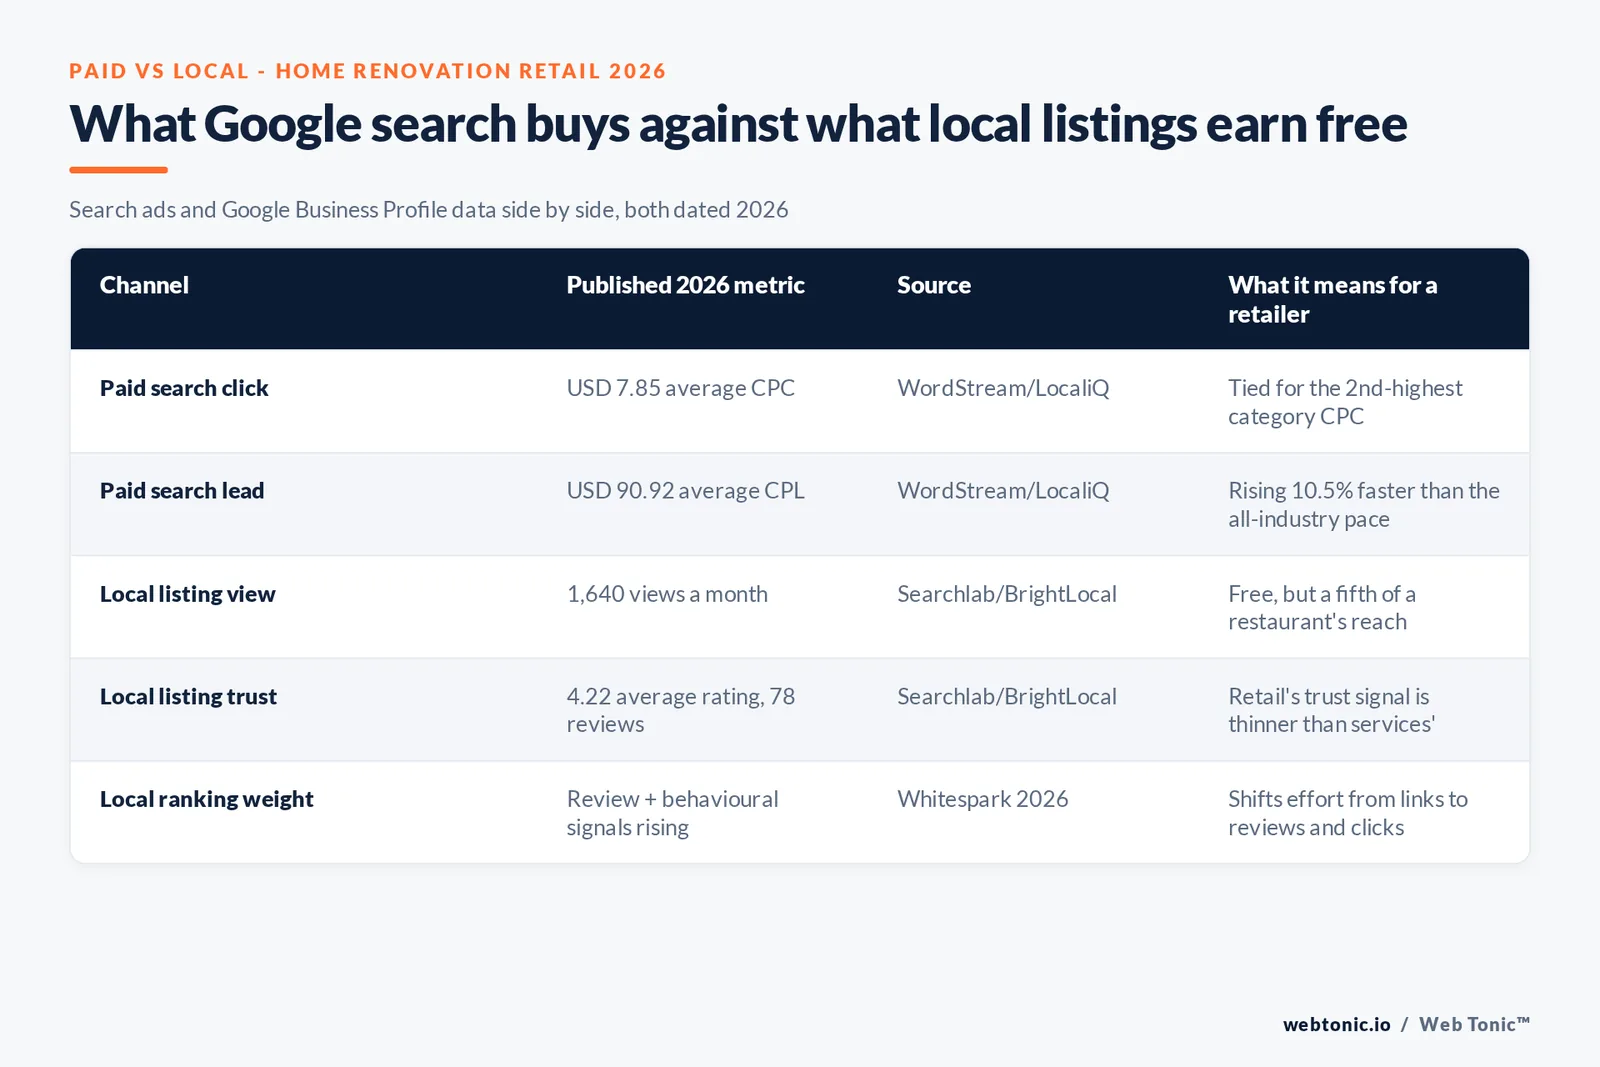
Home & Home Improvement paid search clicks average USD 7.85 and leads average USD 90.92 in 2025, while a Retail & Stores Google Business Profile earns roughly 1,640 free views a month - a fifth of what a restaurant listing gets. This page puts both sides of that trade next to each other for a category where, per HIRI's own retailer data, in-store purchases still dominate.
Key Takeaways
- Home & Home Improvement search CPC is USD 7.85, tied for the second-highest category WordStream tracks.
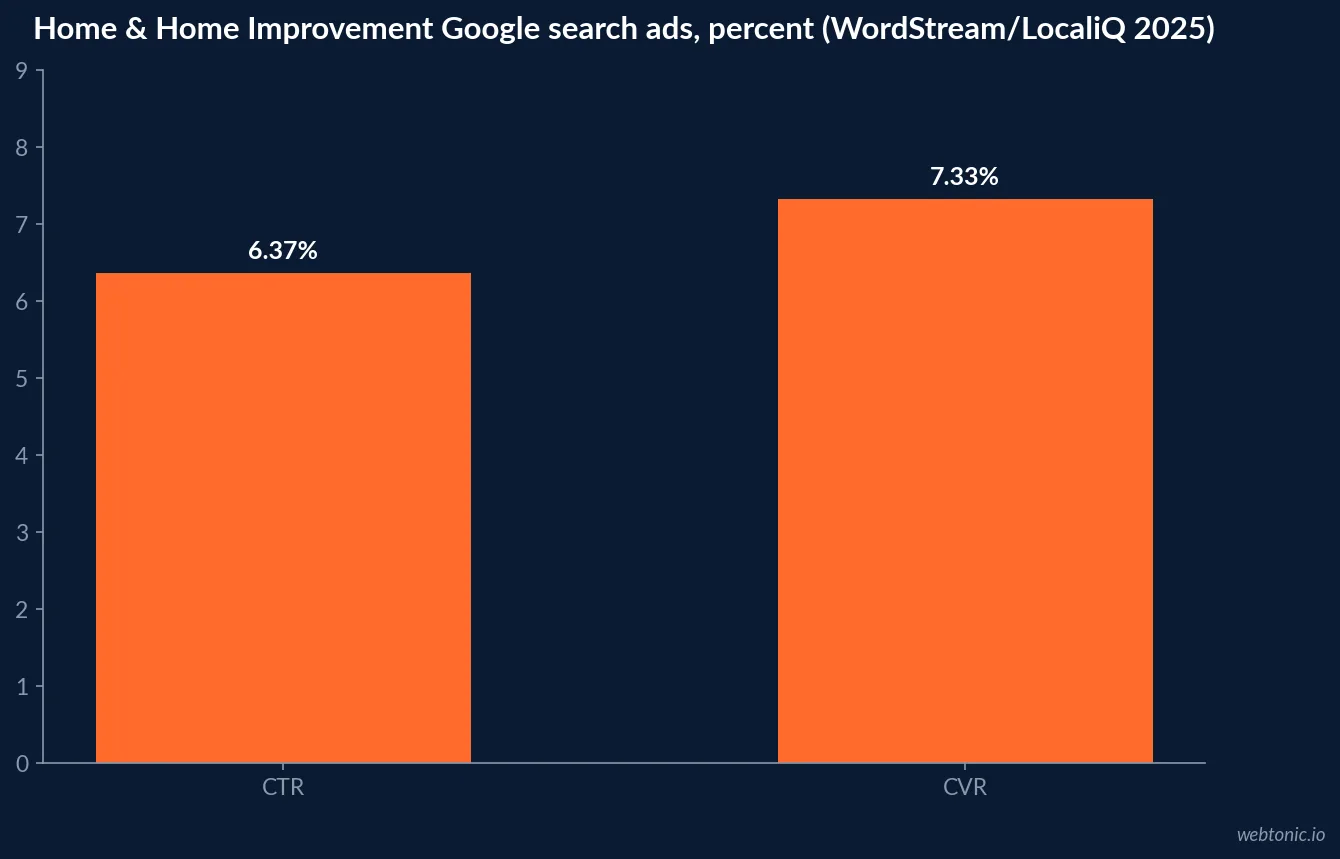
- Search CVR for the category is 7.33%, down 14.97% year over year.
- Search CTR is 6.37%, up 13.95%, one of the biggest gainers.
- Cost per lead is USD 90.92, rising 10.51% faster than the all-industry pace.
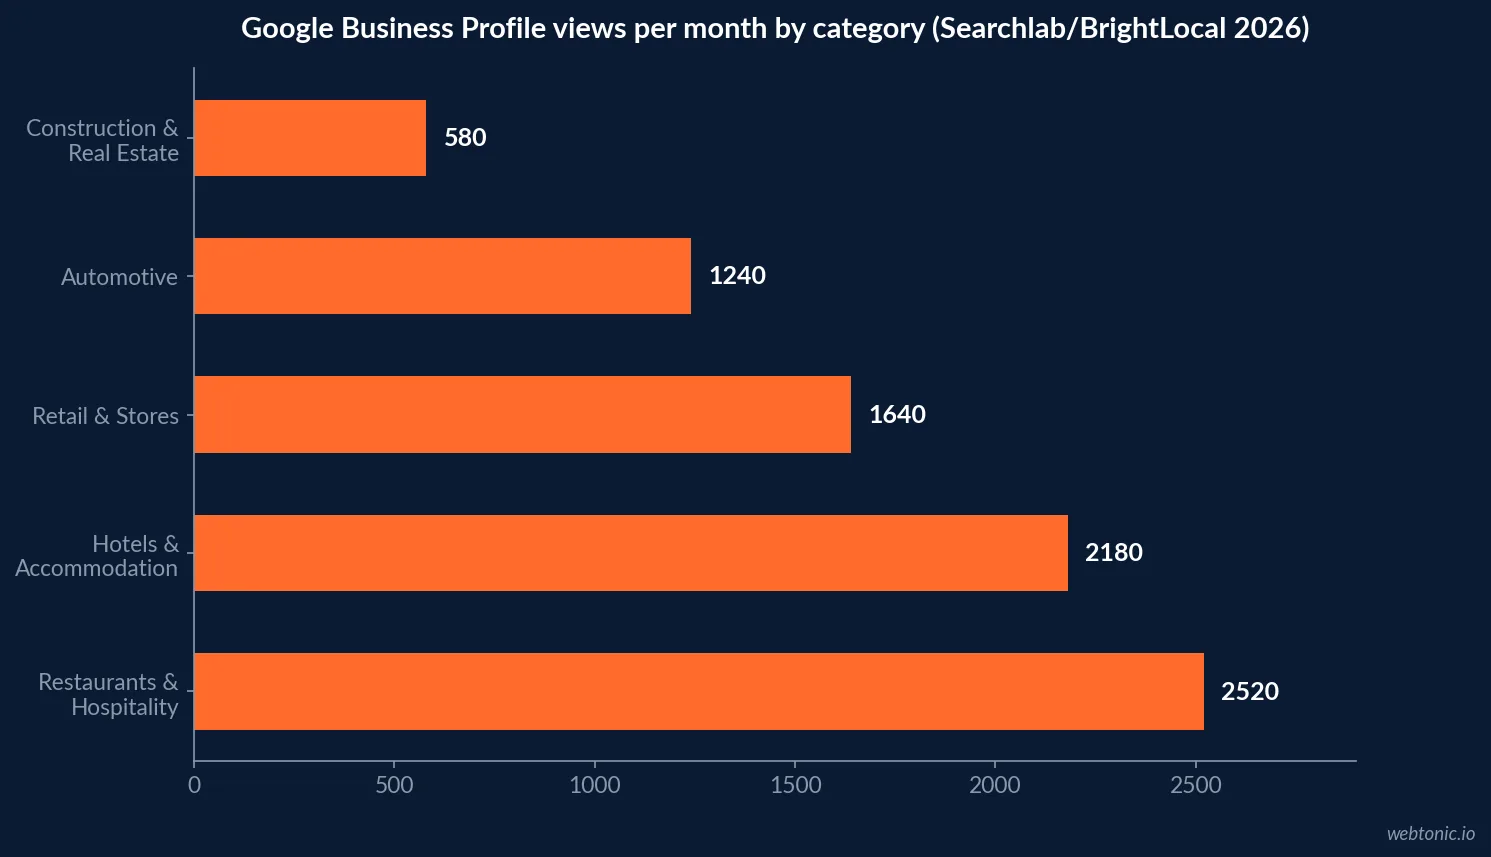
- A Retail & Stores Google Business Profile averages 1,640 views a month and 78 reviews at a 4.22 rating (Searchlab 2026).
- That trails Restaurants & Hospitality at 2,520 views and Hotels at 218 reviews.
- Home centers capture almost 70% of the category's purchases (HIRI).
- Only 42% of consumers now trust reviews as much as a friend's recommendation, down from 79% in 2020 (BrightLocal).
- Review and behavioural signals gained weight in Whitespark's 2026 local ranking factors survey.
- Retail e-commerce overall was 17.1% of total US retail sales in Q2 2026 (Census Bureau) - most home improvement spend still happens in a store.
What paid search costs for this category right now
WordStream's 2025 Google Ads Benchmarks lists Home & Home Improvement's average CPC at USD 7.85, tied with Dentists and Dental Services for the second-highest tracked category behind Attorneys and Legal Services (USD 8.58). The category's CTR rose 13.95% year over year to 6.37%, one of the largest gains WordStream measured, while its conversion rate fell 14.97% to 7.33%, one of the largest declines. Cost per lead, at USD 90.92, increased faster than the 5.13% all-industry CPL rise, up 10.51% year over year.
| Google search metric (2025) | Home & Home Improvement | YoY change | Source |
|---|---|---|---|
| Average CPC | USD 7.85 | n/d exact %, among highest | WordStream Google Ads Benchmarks 2025 |
| Average CTR | 6.37% | +13.95% | WordStream Google Ads Benchmarks 2025 |
| Average CVR | 7.33% | -14.97% | WordStream Google Ads Benchmarks 2025 |
| Average CPL | USD 90.92 | +10.51% | WordStream Google Ads Benchmarks 2025 |
What a Google Business Profile earns without a media budget
Searchlab's 2026 compiled Google Business Profile data - a secondary compilation that blends BrightLocal Industry Benchmarks 2026, SOCi's Local Visibility Report and ReviewTrackers rather than a single named primary study, so treat the figures as directional - places Retail & Stores at 1,640 views a month on average, with 78 reviews and a 4.22 rating - views well below Restaurants & Hospitality (2,520) and Hotels & Accommodation (2,180), and a review count under half of Hotels' 218. SOCi's own 2026 Local Visibility Index, one of the surveys behind that compilation, separately reports the average retailer appears in Google's local 3-Pack just 49.5% of the time. Retail is a lower-frequency, higher-consideration purchase category than dining, so lower view volume is not automatically a problem, but the thinner review count against every other listed category is a real trust gap for a category where 42% of shoppers weigh reviews as heavily as a personal recommendation.
| Category (Searchlab 2026) | Views / month | Avg. reviews | Avg. rating |
|---|---|---|---|
| Restaurants & Hospitality | 2,520 | 142 | 4.18 |
| Hotels & Accommodation | 2,180 | 218 | 4.05 |
| Retail & Stores | 1,640 | 78 | 4.22 |
| Healthcare | 1,380 | 56 | 4.31 |
| Construction & Real Estate | 580 | 18 | 4.35 |
Why homeowners still pick a store, not just a listing
HIRI's Retail Selection Drivers research finds home centers and specialty stores together account for almost 70% of the home improvement market, with product selection, location/convenience and price as the top unaided reasons homeowners name for choosing a specific retailer. The top five aided reasons - convenient location, wide product selection, one-stop shopping, ease of finding desired items and availability of preferred brands - are almost entirely about physical and informational convenience, not price alone. A Google Business Profile with accurate hours, categories and product attributes speaks directly to four of those five drivers before a shopper ever leaves home.
| HIRI aided purchase-decision driver | Rank | What a GBP can influence |
|---|---|---|
| Convenient location | 1 | Directly - accurate address, service area, map pin |
| Wide product selection | 2 | Partially - categories, product attributes, posts |
| One-stop shopping convenience | 3 | Partially - categories and service listings |
| Ease of finding desired items | 4 | Directly - Q&A, product attributes, photos |
| Availability of preferred brands | 5 | Partially - posts and product catalog |
The trust signal retail still has to earn
BrightLocal's 2025 Local Consumer Review Survey found that 42% of consumers now trust online reviews as much as a personal recommendation from friends or family - up 4 points from 2024, but far below the 79% BrightLocal recorded in 2020. Google remains the dominant review-discovery platform, used by roughly 81-87% of consumers depending on the year, though BrightLocal notes its share of that market has started to soften. For a category with a thinner average review count than most (78 for Retail & Stores versus 142-218 for dining and hospitality), closing that gap matters more than chasing star-rating perfection.
What is shifting in how Google weighs local signals
Whitespark's 2026 Local Search Ranking Factors report, based on a survey of 47 local search practitioners, groups ranking signals into Google Business Profile, on-page, review, link, behavioural, citation, personalization and (new for 2026) social signals. Whitespark's own commentary on the 2026 edition states that review signals and behavioural signals - things like click-through rate, mobile clicks-to-call and dwell time - gained the most weight this year, while on-page and link signals eased back and citation signals continued a multi-edition decline. The report does not publish exact percentage weightings in the public summary, so treat this as directional: invest in reviews and the experience that drives a click and a call, not just backlinks and citations.
BOPIS and the local intent it signals
Lowe's 2025 annual report states the company "accelerated online sales with growth of 8.8%, which now represents 13% of our retail sales," and Home Depot's own 10-K puts online sales at 15.9% of net sales for fiscal 2025. Read against HIRI's near-70% home-center purchase share, the pattern is consistent: the large majority of category revenue still closes in a physical store, even where the research or the first click started online or through a Google Business Profile. That is the strongest practical argument for local SEO investment in this category - the profile is frequently the last touchpoint before someone drives to a specific location, whether or not the purchase itself happens digitally.
| Retailer (fiscal 2025) | Online share of sales | Implied in-store share |
|---|---|---|
| The Home Depot | 15.9% | ~84.1% |
| Lowe's | 13% | ~87% |
What "near me" search volume means for a multi-location retailer
Retail categories compete on the same map-pack real estate as every other local business type, and a location's Google Business Profile only shows up there if its categories, service area and hours are accurate. HIRI's data on unaided purchase reasons names location/convenience as a top driver for home centers and specialty stores alike, and convenient location as the single most-cited aided reason across the whole category. A multi-location retailer with even one store carrying an outdated address, wrong hours, or a mismatched primary category is losing map-pack visibility on the exact driver its own customers say matters most.
Our growth marketing practice audits GBP category and attribute accuracy as a standing line item for multi-location retail clients, alongside the paid search program covered in our Google Ads strategy guide.
| Local SEO lever | HIRI driver it supports | Cost to fix |
|---|---|---|
| Accurate GBP category and attributes | Location/convenience, product selection | Low - internal audit |
| Complete hours across all locations | Ease of finding desired items | Low - internal audit |
| Review generation program | Trust signal (42% weight reviews like a referral) | Medium - ongoing process |
| Photo and Q&A completeness | Product selection, brand availability | Low-medium - content ops |
Reading the two channels together
Retail e-commerce was 17.1% of total US retail sales in the second quarter of 2026 ( Census Bureau Advance Monthly Sales), and the Building Material & Garden Equipment category (NAICS 444) posted roughly USD 338.2 billion in trailing 12-month sales, up 4.6% year over year. Most of that spend is still store-driven, which is exactly why the local side of this comparison - profile completeness, review volume, accurate categories - carries weight a national paid-search budget cannot fully replace. Our growth marketing practice builds that split by store cluster rather than treating local as an afterthought to national search spend. For the paid-search cost detail behind this page, see our Google Ads pricing guide.
Frequently Asked Questions
Is it cheaper to rank a home renovation retail location organically than to pay for search clicks?
The Google Business Profile side is free to occupy, but 'free' does not mean equivalent traffic. Searchlab's 2026 compiled data (sourcing BrightLocal, SOCi and ReviewTrackers) puts Retail & Stores profiles at 1,640 views a month on average, well below Restaurants & Hospitality (2,520) and Hotels & Accommodation (2,180). Paid search, by contrast, costs a category average of USD 7.85 per click and USD 90.92 per lead (WordStream/LocaliQ 2025). The two channels are not substitutes; a profile drives map-pack and near-me visibility that a search ad cannot buy at any price, while search ads buy volume on demand that organic listings cannot.
Why did the Home & Home Improvement search category see CTR rise while conversion rate fell?
WordStream's 2025 Google Ads Benchmarks report shows the category's CTR rising 13.95% year over year while its conversion rate fell 14.97% - one of the steepest CVR declines it tracks. That combination reads as more searchers clicking through but converting at a lower rate, consistent with a more crowded results page (WordStream separately notes home services listings routinely share space with Local Services Ads, Maps ads and organic results) and, per the New York Times reporting WordStream cites, renovation buyers now routinely collecting six or more competitive quotes before committing.
What actually drives a homeowner to choose one home improvement retailer over another?
HIRI's Retail Selection Drivers research names product selection, location/convenience and price as the top unaided reasons across home centers and specialty stores, with the aided top five being convenient location, wide product selection, one-stop shopping, ease of finding items and availability of preferred brands. Four of those five are things a Google Business Profile with accurate categories, hours and inventory signals can directly influence; price is the one local SEO cannot touch.
Do home improvement shoppers still trust online reviews as much as they used to?
Less than they did. BrightLocal's 2025 Local Consumer Review Survey found 42% of consumers now trust reviews as much as a personal recommendation from friends or family, down from 79% in 2020, though that figure did tick up 4 points from 2024. Retail categories also carry thinner review volume than services: Searchlab's data shows Retail & Stores averaging 78 reviews per profile against 218 for Hotels & Accommodation, so a retailer investing in review generation is working against both a lower starting trust baseline and a thinner review count than most categories it is compared to.
Should a multi-location home improvement retailer prioritize local ranking factors over paid search?
Not either/or. Whitespark's 2026 Local Search Ranking Factors survey of 47 local SEO practitioners reports review signals and behavioural signals (click-through rate, mobile clicks-to-call, dwell time) gaining weight in the 2026 edition versus prior years, which argues for review generation and profile completeness work regardless of ad spend. But with search CPLs at USD 90.92 and rising 10.51% faster than the all-industry pace, a retailer with strong organic local visibility should treat that as budget protected from paid search inflation, not a reason to abandon paid search for high-intent terms.
Sources
WordStream - Google Ads Benchmarks 2025 by industry
Searchlab - Google Business Profile Statistics 2026 (BrightLocal/SOCi/ReviewTrackers)
HIRI - Top Retail Selection Drivers infographic
BrightLocal - Local Consumer Review Survey 2025
Whitespark - 2026 Local Search Ranking Factors report
US Census Bureau - Advance Monthly Retail Trade Survey, August 2026
HIRI - 5 Key 2024 Home Improvement Trends


