Table of contents
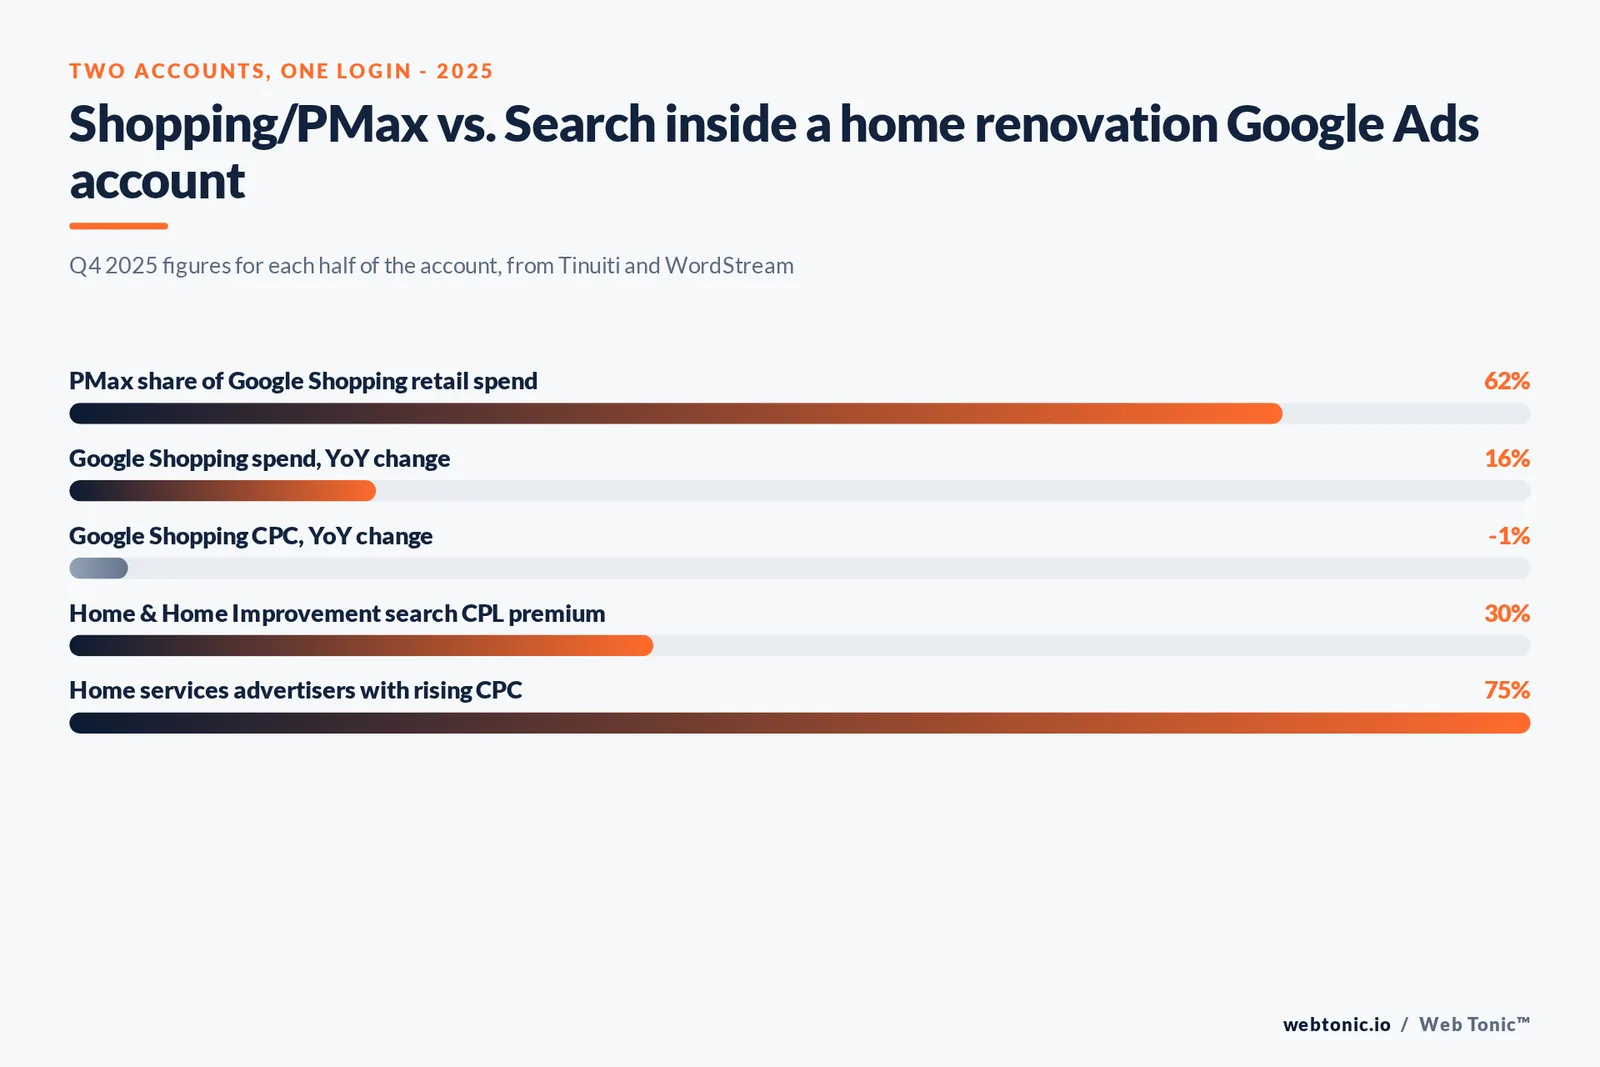
A home renovation retailer's Google Ads account is really two accounts wearing one login: a Shopping/Performance Max side now dominated by feed-based bidding, and a Search side where cost per lead sits well above the all-industry average. This page uses Q4 2025 and 2025-benchmark data from Tinuiti and WordStream to size both halves separately, because a single blended number hides which one is actually working.
Key Takeaways
- Performance Max carried 62% of retail Google Shopping spend in Q4 2025.
- PMax generated 61% of Google Shopping ad sales in the same quarter.
- PMax's Shopping-spend share peaked near 82% in May 2024 before easing back.
- Typical PMax retail accounts run 3 to 7 campaigns, about double the 2022 count.
- 90% of PMax cost typically comes from feed-based (Shopping) assets.
- Google Shopping spend rose 16% year over year in Q4 2025.
- Shopping CPC fell 1% year over year in the same quarter.
- Google search ad spend rose 13% year over year in Q4 2025, the fastest since early 2021.
- Home & Home Improvement search CPL averages USD 90.92, versus USD 70.11 all-industry.
- The category's average CTR is 6.37%, close to the 6.66% all-industry figure.
- CPC rose for 75% of home services advertisers in the 2025 benchmark window.
- Doors & Window Sales CPC rose more than 46% year over year.
- NRF projected holiday 2025 sales above USD 1 trillion for the first time.
- Trade coverage flagged home-category retail as unlikely to see much holiday lift despite that record total.
- Amazon's exit from US Shopping auctions opened space no single retailer has fully filled.
The Shopping side of the account: PMax has the wheel
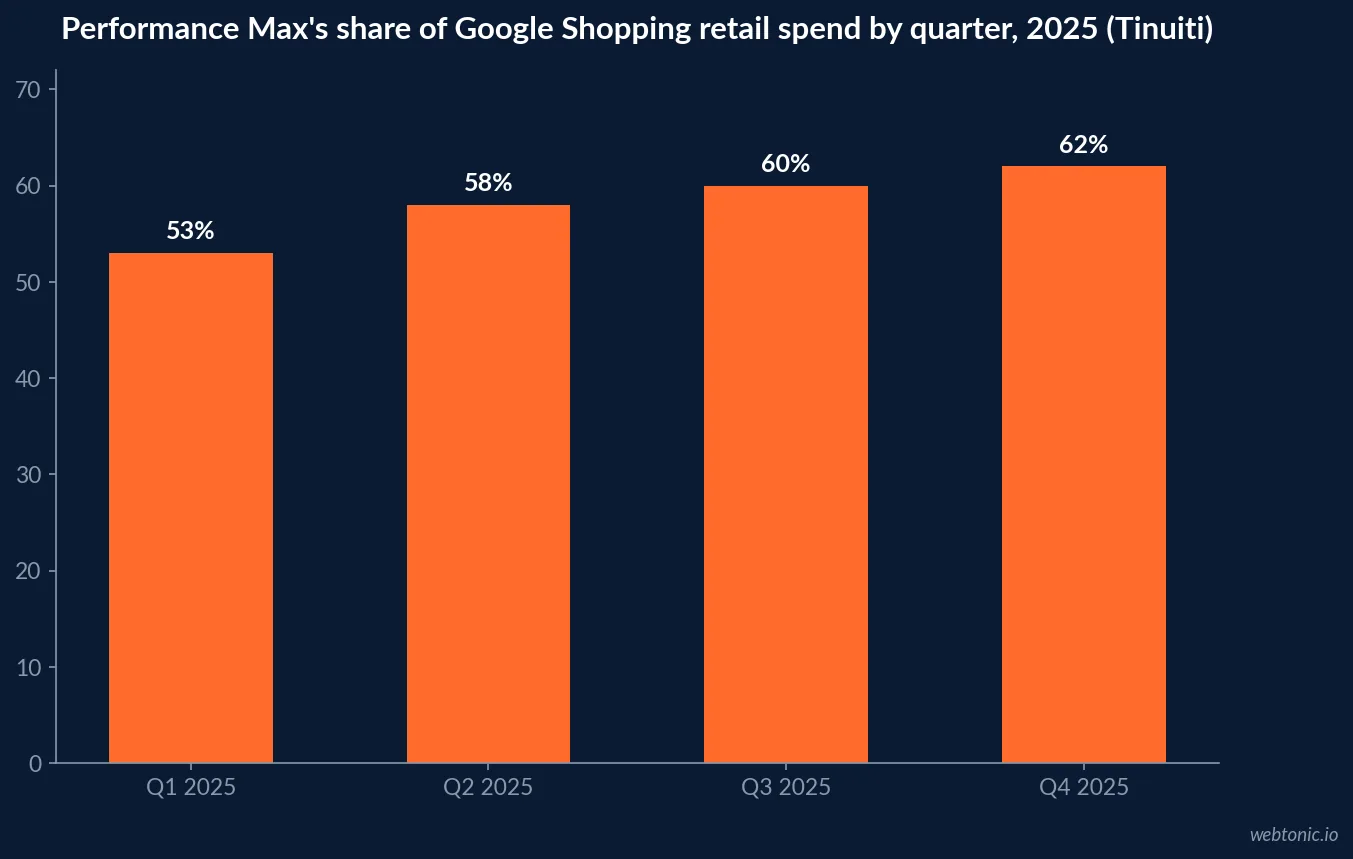
Tinuiti's Q4 2025 Digital Ads Benchmark Report, drawn from its managed retail advertiser base, found Performance Max accounted for 62% of retailer spending on Google Shopping ad listings in the quarter - down from 69% a year earlier but up from a low of 53% in Q1 2025 - and that PMax generated 61% of Google Shopping ad sales in the same period, tracking closely with its spend share. Independent analysis of 4,000-plus PMax retail campaigns across 500-plus advertiser accounts puts PMax's peak cost share within the broader ecommerce ad mix at just under 82% in May 2024, easing roughly 0.65% a month since, for a cumulative 6-point decline - a rebalancing, not a retreat.
The same independent analysis reports that the typical PMax account now runs 3 to 7 campaigns, roughly double the count seen when PMax fully rolled out in September 2022, and that 90% of PMax cost typically flows through feed-based (Shopping) assets rather than the video, display or Gmail inventory PMax can also serve into. For a home renovation retailer with a large SKU catalog, that means the product feed - not the creative - is still the highest-leverage lever inside PMax.
| PMax / Shopping metric (2025) | Figure | Direction | Source |
|---|---|---|---|
| PMax share of Google Shopping retail spend, Q4 2025 | 62% | Down from 69% a year earlier | Tinuiti Q4 2025 report |
| PMax share of Google Shopping retail sales, Q4 2025 | 61% | Tracking spend share closely | Tinuiti Q4 2025 report |
| PMax share of ecommerce ad spend, peak (May 2024) | ~82% | Down ~6 points since peak | Independent 500-advertiser PMax analysis |
| Typical PMax campaigns per retail account | 3-7 | Roughly double the 2022 count | Independent 500-advertiser PMax analysis |
| Share of PMax cost from feed-based assets | 90% | Product feed remains the main lever | Independent 500-advertiser PMax analysis |
Why Shopping got both cheaper and bigger at once
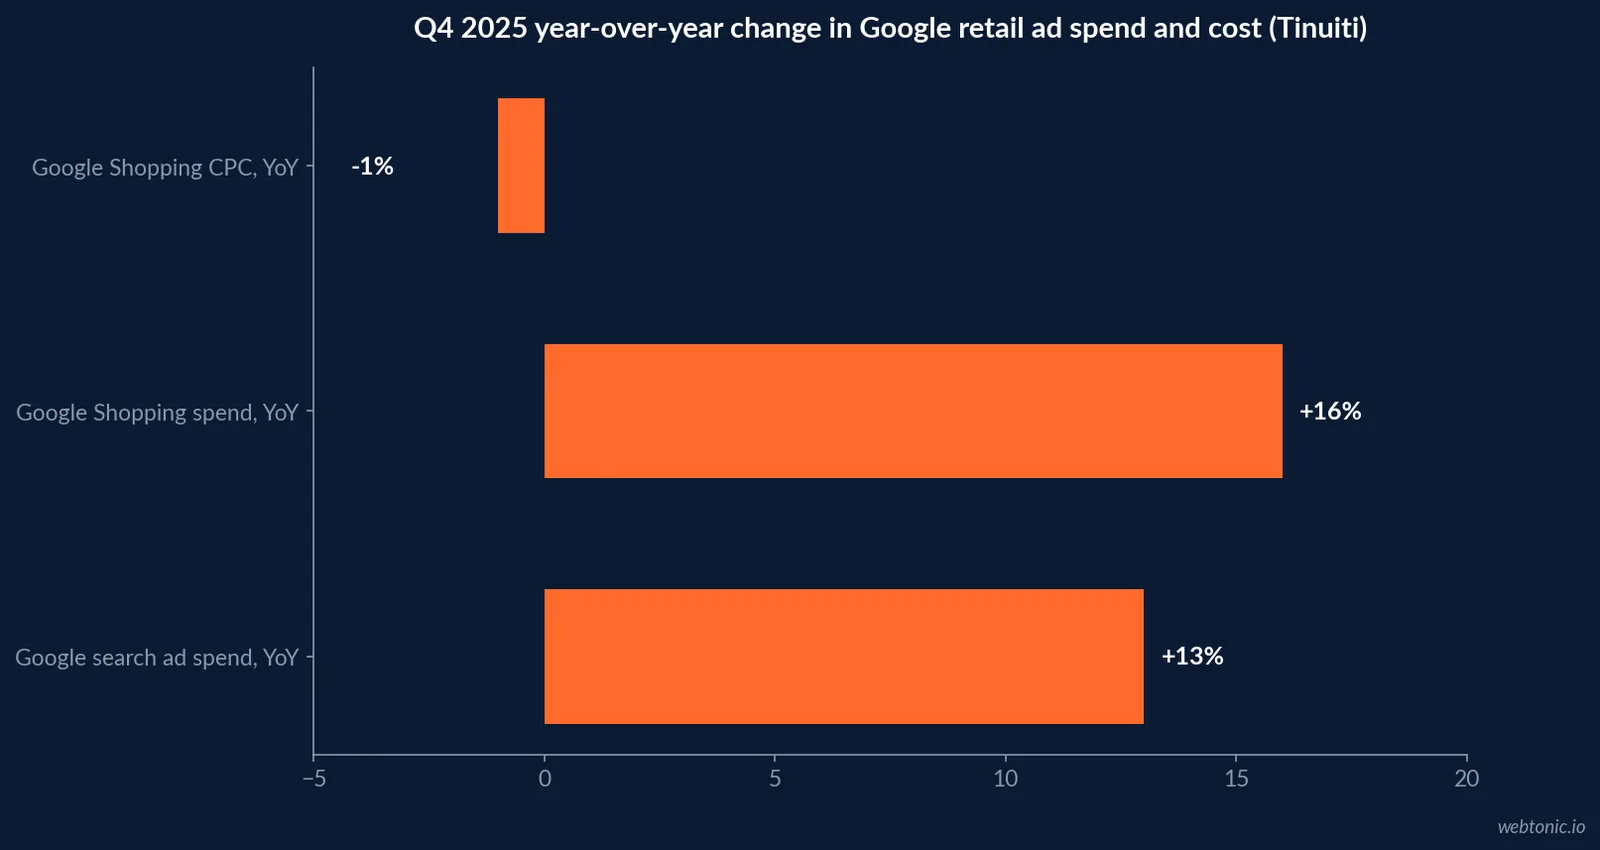
Tinuiti's Q4 2025 data shows Google Shopping ad spending up 16% year over year while Shopping CPC fell 1% in the same quarter - an unusual combination explained by a single structural event: Amazon exited nearly all US Google Shopping auctions after pausing in July 2025, and Temu and Shein pulled back earlier in the year ahead of the expiration of the de minimis tariff exception. Target became more prominent in the resulting auctions, with Walmart's share strong in December after an earlier-quarter dip, but no single retailer has fully replaced Amazon's former position. Google search ad spend, separately, rose 13% year over year in Q4 2025, its fastest growth since early 2021, which Google itself has partly attributed to AI-driven query volume growth.
For a home renovation retailer, this is a live, if temporary, window: the auction is less crowded at the top than it has been in years, even as overall spend and click volume both climb.
| Q4 2025 paid search signal | Year-over-year change | What changed it | Source |
|---|---|---|---|
| Google Shopping ad spend | +16% | Amazon exit + Target/Walmart fill-in | Tinuiti Q4 2025 report |
| Google Shopping CPC | -1% | Reduced bidder density at the top | Tinuiti Q4 2025 report |
| Google search ad spend | +13% | Strongest growth since early 2021 | Tinuiti Q4 2025 report |
| Google search click growth | Upper teens % | AI-driven query volume growth, per Google | Tinuiti Q4 2025 report |
The Search side of the account: a category tax on cost per lead
WordStream's 2025 Google Ads Benchmarks, built on more than 16,000 US campaigns running April 2024 through March 2025, puts the Home & Home Improvement category's average cost per lead at USD 90.92 against an all-industry average of USD 70.11 - a roughly 30% premium - while its average click-through rate of 6.37% sits only slightly below the 6.66% all-industry figure. Its companion Home Services Search Ads Benchmarks, drawn from over 3,200 LocaliQ campaigns, shows CPC rising for 75% of home services advertisers, with Doors & Window Sales among the categories seeing CPC increases over 46% year on year, even as conversion rate fell an average 14.96% across the 16 home services subcategories it tracks - a departure from the roughly 6.84% CVR increase seen across all industries in the same window.
Note this is home-services-scale campaign data (installers, contractors, retailers with local search intent), not the enterprise-account economics a Home Depot or Lowe's runs internally; it is, however, the number most independent and regional home renovation retailers actually see on their own invoices.
| Search metric (WordStream 2025) | Home & Home Improvement | All-industry average | Gap |
|---|---|---|---|
| Average cost per lead | USD 90.92 | USD 70.11 | +30% |
| Average click-through rate | 6.37% | 6.66% | Slightly below average |
| CPC trend, share of advertisers rising | 75% | n/a | Doors & windows up 46%+ YoY |
| CVR trend across 16 subcategories | Down 14.96% YoY | Up 6.84% YoY (all industries) | Category moving opposite the overall trend |
What the holiday calendar does and does not do for this category
The National Retail Federation projected November-December 2025 holiday retail sales would surpass USD 1 trillion for the first time, up 3.7% to 4.2% over 2024. Trade coverage of that same forecast specifically noted that home furnishings and home-category retail were not expecting much of a bump from the record total, since holiday budgets concentrate in gifting categories rather than durable home-improvement purchases. A Google Ads calendar built around Black Friday/Cyber Monday demand curves - the pattern that works for apparel or electronics - is the wrong shape for a renovation retailer whose Search demand tracks moving, weather and Pro-project seasons instead.
Where the account's real seasonal peak sits
Unlike gift-led retail, a home renovation retailer's Google Ads calendar should track project seasons rather than the holiday shopping calendar. HIRI's own contractor sentiment data - cited alongside the LIRA-style demand backdrop that shapes this category - shows Pro-channel activity accelerating through spring and summer building seasons, while the NRF's own holiday framing (built around gifting) explicitly excludes the kind of durable-goods, Pro-driven demand this account runs on. A media plan that copies an apparel or electronics brand's Q4-weighted Google Ads budget will systematically under-fund the spring and early-summer weeks when this category's actual search volume peaks, then over-spend into a holiday period the National Retail Federation's own coverage says this category does not meaningfully benefit from.
The practical fix is a budget curve built from the account's own historical search volume by month, not from a retail-wide seasonal template - the single most common Google Ads planning mistake we see brought over from a general ecommerce playbook into this category.
Building the budget split
The practical read: Shopping/PMax is where the auction just got temporarily less crowded and where the product feed is 90% of the performance lever, which argues for feed-quality investment ahead of creative investment. Search is where the category carries a structural 30% CPL premium over the all-industry average and where conversion rate is moving the wrong direction even as CTR holds - arguing for tighter negative-keyword and landing-page work rather than simply raising bids. Treating both halves with the same playbook is the most common budgeting mistake we see in this category.
Our growth marketing practice builds separate Shopping-feed and Search-intent playbooks for retail and Pro-facing home improvement brands; see also our guide to what Google Ads actually costs when planning next year's split, and our data and analytics practice if the two halves of the account still report through one blended dashboard today.
Frequently Asked Questions
Is Performance Max or standard Shopping the bigger spend driver now?
PMax, by a wide margin. Tinuiti's Q4 2025 Digital Ads Benchmark Report, covering its managed advertiser base, found Performance Max accounted for 62% of retailer spending on Google Shopping ad listings in the quarter, down from 69% a year earlier but up from a low of 53% in Q1 2025. PMax also generated 61% of Google Shopping ad sales in the quarter, tracking closely with its share of spend.
What does a search click actually cost in this category right now?
WordStream's 2025 Google Ads Benchmarks, covering over 16,000 US campaigns from April 2024 through March 2025, put the Home & Home Improvement category's average cost per lead at USD 90.92, roughly 30% above the USD 70.11 all-industry average, with an average click-through rate of 6.37%. Its Home Services PDF, based on 3,200-plus LocaliQ campaigns, separately shows CPC rising for 75% of home services accounts, with Doors & Window Sales among the categories up more than 46% year on year.
Is Google Shopping getting more or less competitive for home improvement retailers?
More, but with a twist: less competition from one specific rival. Tinuiti reports Google Shopping spend up 16% year over year in Q4 2025 with Shopping CPC actually falling 1% year over year, largely because Amazon exited nearly all US Google Shopping auctions after July 2025, opening space that Target and, briefly, Walmart moved to fill. No single retailer has fully replaced Amazon's prior share, which is a real, if temporary, opening for mid-size home improvement advertisers bidding in the same auctions.
Did holiday 2025 spending actually help home improvement retailers?
Only modestly. The National Retail Federation projected total November-December 2025 holiday retail sales would surpass USD 1 trillion for the first time, up 3.7% to 4.2% over 2024 - but trade coverage citing that forecast specifically flagged home furnishings and home-category retail as not expecting much of a lift, since holiday spending concentrates in gifting categories rather than durable home-improvement purchases. Google Ads budgets timed to holiday demand curves need a different seasonal shape in this category than in gift-led retail.
Should a home renovation retailer run PMax and standard Shopping together, or pick one?
The available account-level research says most advertisers are choosing PMax as the default and running multiple PMax campaigns rather than one. Independent analysis of 4,000-plus PMax retail campaigns across 500-plus advertiser accounts found the typical account runs 3 to 7 PMax campaigns, roughly double the count from PMax's 2022 rollout, and that 90% of PMax cost typically comes from feed-based (Shopping) assets rather than the other inventory PMax can serve into.
Sources
Tinuiti - Digital Ads Benchmark Report, Q4 2025
Smarter Ecommerce - The State of Performance Max Campaigns 2025
WordStream - 2025 Google Ads Benchmarks
WordStream - Home Services Search Ads Benchmarks 2025
National Retail Federation - 2025 holiday sales forecast
Business of Home - Holiday spending forecast vs. home retail category