



Table of contents

Eighty-four percent of contractors cannot state their cost per lead by marketing source, and 60% to 80% of HVAC leads arrive by phone — which means most heating and ventilation marketing budgets are allocated on a number nobody can verify. The contractors who fix it report 20% to 35% higher marketing ROI on identical spend. Here is the 2026 attribution data.
Key Takeaways
- 84% of contractors cannot report cost per lead by source; 41% have no single source of truth for CPL by channel.
- 73% of home service owners review marketing numbers monthly or less.
- 60%-80% of leads come by phone; dynamic number insertion runs at 85%-92% accuracy.
- Call tracking costs $30-$215/month and recovers 15%-25% of LSA charges through disputes.
- Tracking spend to closed jobs delivers 20%-35% higher marketing ROI; clear attribution cuts waste 15%-30%.
- Without Conversions API, 30%-50% of Meta conversions go untracked.
- Identity errors collapsed measured ROI by ~70% in LiveRamp simulations — $1.50 read as $0.43.
- Top-quartile HVAC firms answer 91%+ of calls versus a 68% industry average.
HVAC Attribution Benchmarks at a Glance
The table consolidates contractor call-tracking research, 2026 dashboard benchmarks across 1,200 contractors and home service operations data.
| Attribution metric | 2026 figure | What it means |
|---|---|---|
| Contractors who cannot state CPL by source | 84% | Budget decisions made blind |
| No single source of truth for CPL | 41% | Multiple conflicting reports |
| Owners reviewing numbers monthly or less | 73% | Three weeks of bleed before anyone notices |
| Share of leads arriving by phone | 60% - 80% | Forms-only tracking misses most demand |
| Dynamic number insertion accuracy | 85% - 92% | Good enough for channel decisions |
| LSA charges recovered via disputes | 15% - 25% | $600-$1,000/month on $4,000 spend |
| ROI lift from closed-job tracking | 20% - 35% | Same budget, better allocation |
| Waste reduction from clear attribution | 15% - 30% | Gartner marketing analytics |
| CAC reduction from weekly review | 15% - 25% | Within one quarter |
| Website visitor-to-contact rate | 4% - 7% | 93%-96% leave unidentified |
The last row sets the ceiling on what any attribution stack can see. Between 93% and 96% of website visitors leave without identifying themselves, so attribution is always a story about the minority who convert — which is why the useful goal is comparable channel data, not perfect truth.
1. What Bad Attribution Actually Costs
The clearest illustration in the research is a contractor who ran 90 days of call tracking and found Facebook producing calls at $38 each closing at 6% while Google search produced calls at $112 closing at 38%. Cheap channel, expensive customers. He shifted budget and booked revenue grew 23% on the same total spend.
| Scenario | Cost per lead | Close rate | True cost per customer |
|---|---|---|---|
| Looks cheap | $50 | 8% | $625 |
| Looks expensive | $150 | 40% | $375 |
| Facebook (tracked case) | $38 | 6% | $633 |
| Google search (tracked case) | $112 | 38% | $295 |
| Angi (platform-reported) | - | 12% of booked jobs claimed | Overstated |
| Angi (tracked reality) | - | 4% of booked jobs | $3,200/month reallocated |
In the Angi case, six weeks of clean data showed the platform delivering 4% of booked jobs against the 12% it reported. The owner cut the spend and CAC dropped 18% the next quarter. This is the pattern attribution exists to catch: platforms self-report generously, and only booked-job data at the source level corrects them.
2. Cost per Booked Job by Channel
Cost per lead is a vanity metric in this trade. Built on Tenth's benchmarks report cost per booked job, split by quartile — the only view that supports a budget decision.

| Channel | Top 25% cost per booked job | Industry average |
|---|---|---|
| Google Business Profile (organic) | $18 - $45 | $25 - $70 |
| Direct SEO traffic | $30 - $75 | $50 - $130 |
| Google Local Services Ads | $95 - $185 | $140 - $280 |
| Google Ads | $180 - $340 | $280 - $520 |
| Direct mail | $190 - $380 | $300 - $600 |
| Angi / aggregators | $220 - $480 | $380 - $900 |
The top-quartile advantage is not cheaper clicks. It is answer rate and booking rate: 91%+ call answer rates versus a 68% average, and 62% to 70% booking on answered calls versus 38% to 45%. The worked example is stark — a company with a 90% answer rate and 65% booking rate turns a $140 LSA call into a $240 cost per booked job, while a 68% answer rate and 40% booking rate turns the same call into $514. Attribution surfaces that gap; nothing else does.
3. Close Rates Are the Missing Multiplier
Channel close-rate benchmarks explain why blended CPL reporting misleads so reliably.
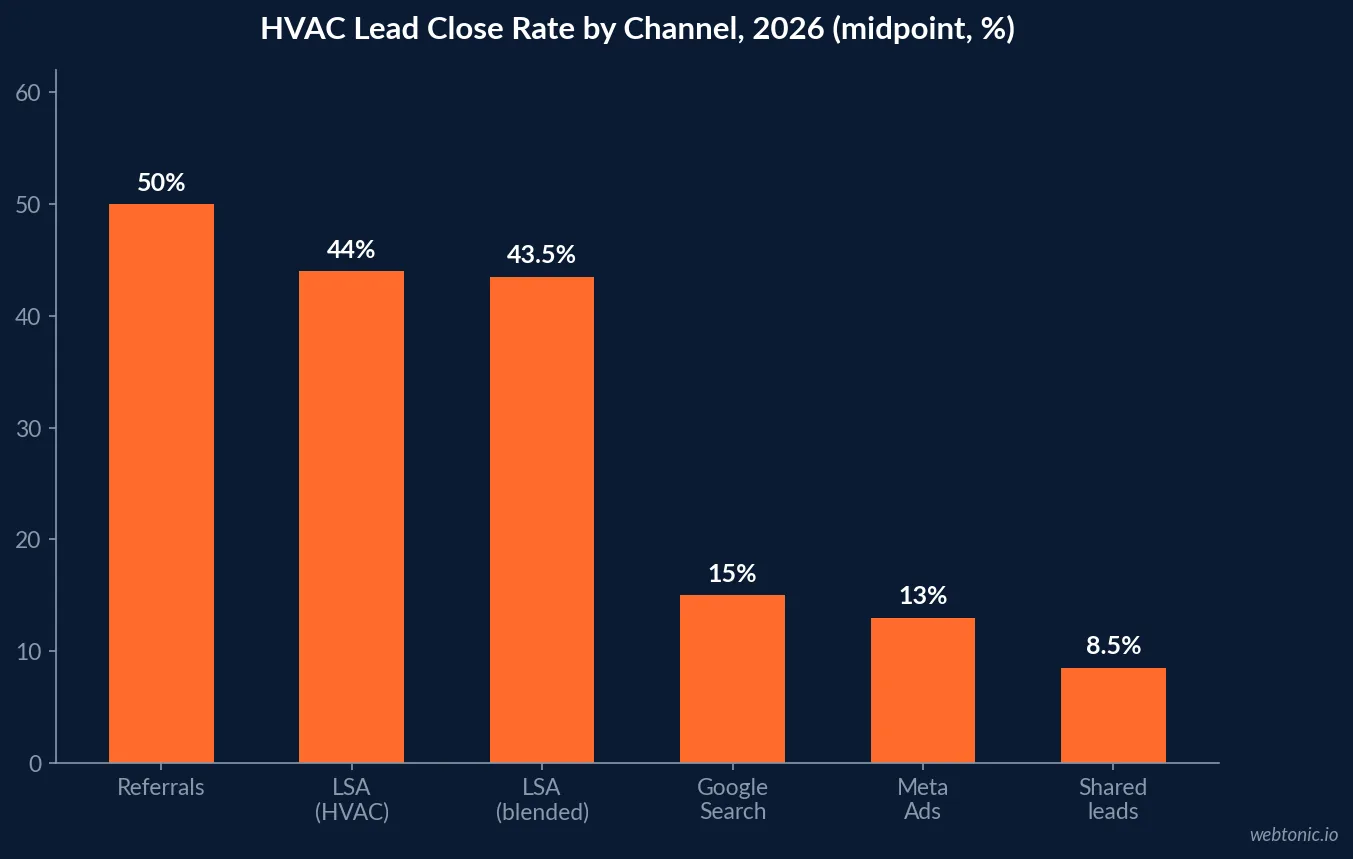
| Channel | Close rate | Note |
|---|---|---|
| Referral leads | 40% - 60% | Highest of any channel |
| Google LSA (blended) | 43.5% | 888 contractors, $6.72M tracked spend |
| Google LSA, HVAC specifically | 44% | February 2026 data |
| LSA emergency calls | 50% - 60% | Peak intent |
| Google Search Ads | 12% - 18% | Comparison shopping |
| Meta Ads (blended) | 8% - 18% | Replacement funnel 10%-18% |
| Angi / HomeAdvisor shared leads | 5% - 12% | 3-5 contractors per lead |
| Phone leads overall | 46% conversion | 37% close on the first call |
A channel report without close rates cannot distinguish a 44% LSA booking rate from an 8% shared-lead rate, which is exactly how aggregator budgets survive. Bottom-quartile HVAC firms spend 14% to 22% of budget on aggregators; top performers spend 4% to 8% or nothing.
4. The Call Tracking Layer
Because most demand arrives by phone, the call-tracking subscription is the foundation of the whole stack. Platform pricing in 2026:
| Platform | Price range | Best fit |
|---|---|---|
| WhatConverts | $30 - $159/month | Attribution-first, single-truck to mid-size |
| CallTrackingMetrics | $39 - $499/month | $5M+ shops with a dispatch team |
| CallRail | $55 - $215/month | Default for $1M-$10M contractors |
| Conversation intelligence add-on | +$60 - $110/month | Lifts booked-rate visibility 30%-50% |
| Invoca | $1,000+/month | $50M+ groups and franchise systems |
| Looker Studio connectors | $24 - $199/month | Supermetrics, PorterMetrics, Coupler.io |
Payback usually arrives inside 30 days through LSA disputes alone. One documented plumbing operator spending $3,200/month on LSAs pulled 60 days of recordings, disputed 41 leads, won 32, and recovered $2,180 in credits. Conversation intelligence adds AI transcription and keyword scoring, and the aggregate sentiment trend doubles as a leading indicator of CSR performance — if 40% of calls are tagged negative on Tuesday and 12% on Wednesday, something operational changed.
5. Signal Loss and Identity Error
Attribution degrades even when it is implemented. A LiveRamp study ran simulations that quantify how badly.
| Signal loss scenario | Effect on measurement | Takeaway |
|---|---|---|
| 50% identity precision | $1.50 ROI measured as $0.43 | ~70% collapse; campaign gets cancelled |
| 25% true lift | Measured at 6.8% | About a 73% understatement |
| Random 20% impression loss | Ranking preserved | Random loss is survivable |
| Frequency-dependent loss (26.9%) | Ranking preserved | Still survivable |
| Loss concentrated among converters | Rankings reverse at ~1% loss | Biased loss is fatal |
| Reached-only RCT design | Drifted to $0.91 | Inherits identity graph errors |
| Meta iOS without CAPI | 30%-50% untracked | CAPI recovers the same 30%-50% |
The pattern that matters for contractors: random data loss is tolerable, biased data loss is not. Missing conversions cluster exactly where privacy controls and broken pixels sit — among the people who converted — which is the scenario that reverses channel rankings at roughly 1% aggregate loss. Add the platform-level context that 67.4% of marketers rank proving incremental ROI as their top challenge and the case for offline conversion import becomes an operational priority, not a nice-to-have.
6. Offline Conversion Import Is the HVAC Answer
The mechanism that closes the loop is well documented. Google's GCLID explainer shows the click identifier stored in browser local storage with a 90-day expiry, then matched back to a booked job.
| Data source | Import window per run | Note |
|---|---|---|
| Cloud Storage, S3, HTTP, SFTP, Sheets | Up to 90 days | Every run |
| Salesforce and HubSpot | 14 days first run, then deltas | Incremental after setup |
| BigQuery, Snowflake, Redshift, SQL | Last 14 days every run | Regardless of run history |
| GCLID local-storage expiry | 90 days | Longer cycles need CRM capture |
| Google Ads API offline import | Closed to new adopters from 15 Jun 2026 | Migrate to Data Manager |
Two deadlines matter. The Google Ads API stopped accepting new offline conversion import adopters from 15 June 2026, pushing new implementations to Data Manager, and linked-account changes take 24 to 48 hours to propagate before import options appear. Also note the 90-day GCLID window against commercial HVAC cycles that run far longer — for those deals the identifier has to live in the CRM, not the browser.
7. Speed to Lead Is an Attribution Problem
Response time distorts channel data before any model is applied, because a slow response converts a good lead into a lost one and the channel takes the blame.
| Response metric | Figure | Consequence |
|---|---|---|
| Customers hiring the first responder | 78% | Speed outranks channel quality |
| Contractors responding within 5 minutes | 12% | The gap is the opportunity |
| Inquiries receiving no response | 27% | Paid leads, zero attribution value |
| Conversion drop, 5 to 10 minutes | 10x | Attribution windows are minutes wide |
| Top-quartile first response time | Under 5 minutes | Industry average 47 minutes |
| Leads lost to delayed follow-up | 35% - 42% | Charged to the channel, caused by ops |
| Paid leads lost within 90 seconds | 40% - 60% | Including 2-hour callbacks |
The lead-response research quantifies the mechanism: an $87 Local Services lead converts at 12% when the callback is 2+ hours late versus far higher on immediate answer. Any dashboard that reports channel CPL without median response time will systematically blame media for a CSR problem.
8. Building the Join Key
Most $1M-$5M shops end up using phone number as the join key, because it survives the call-to-CRM-to-invoicing handoff better than email or name. Five components make the chain work:
- Call tracking with DNI at 85%-92% accuracy, per source not per campaign.
- A CSR script that captures and records source on every call.
- One CRM lead-source field that persists to closed-won, never overwritten.
- Revenue at the job level, not estimate level — 78% is the average HVAC quote-to-invoice conversion rate.
- 90 minutes of initial setup, or the dashboard stays 60% "Unknown" permanently.
Two adoption headwinds are worth naming: 51% of US small businesses still manage customer relationships in spreadsheets or email, and 76% of CRM features go unused by small businesses that adopt a platform. The attribution stack that works in this trade is small and disciplined, not comprehensive. Our data intelligence work almost always starts by shrinking the stack.
9. What Attribution Is Worth in Dollars
Applied to a mid-size operator, the ranges compound rather than overlap.
| Lever | Documented effect | On a $12,000/month budget |
|---|---|---|
| Closed-job tracking vs click tracking | +20% - 35% ROI | $2,400 - $4,200 equivalent |
| Clear attribution model | -15% - 30% wasted spend | $1,800 - $3,600 recovered |
| Weekly vs monthly review | -15% - 25% blended CAC | Within one quarter |
| LSA dispute recovery | 15% - 25% of LSA charges | $600 - $1,000/month at $4,000 LSA |
| CAPI implementation | +30% - 50% tracked conversions | Restores Meta optimisation signal |
| Reallocating aggregator budget | 14%-22% to 4%-8% of budget | $1,200 - $1,700/month freed |
Against those figures, a $105-$165/month CallRail subscription plus $50-$80 in connector costs is the highest-return line item in an HVAC marketing budget. Contractors reviewing weekly reallocate budget within 7 days of a CPL spike versus 28+ days for monthly reviewers — and CPL on a paid campaign can swing 40% in three days.
10. What the Data Recommends
- Install call tracking before anything else. 60%-80% of leads are calls; without it every number is a guess.
- Report cost per booked job, never cost per lead. The $50-at-8% versus $150-at-40% inversion is the whole game.
- Dispute LSA charges monthly. 15%-25% recovery is documented and repeatable.
- Implement Conversions API and offline conversion import. 30%-50% of Meta conversions are otherwise invisible.
- Track median first-response time as a standing KPI. 78% of customers hire the first responder.
- Use phone number as the join key and protect one CRM lead-source field.
- Review weekly, act on 30-day trends. A 40% three-day CPL swing is usually noise.
- Audit aggregator contribution with your own data. Platform-reported 12% has been measured at 4%.
Attribution in this trade is not a modelling exercise. It is plumbing: a tracking number, a CSR script, one CRM field and a weekly review. The contractors who build it recover 15% to 30% of wasted spend and grow booked revenue on flat budgets. For the reporting layer that sits on top, see our data intelligence work; for the demand side, our Google Ads strategy guide and growth marketing approach, or talk to us.
Frequently Asked Questions
How many HVAC contractors actually know their cost per lead by channel?
Very few. Industry reporting puts 84% of contractors unable to state their cost per lead by marketing source, and a 2026 benchmark of 1,200 contractors found 41% have no single source of truth for CPL by channel while 73% review marketing numbers monthly or less. The practical consequence is that budget decisions get made on gut feel: a $50 lead closing at 8% costs $625 per customer while a $150 lead closing at 40% costs $375, and without source-level attribution the cheaper lead looks like the better one.
Why is call tracking non-negotiable in HVAC attribution?
Because 60% to 80% of home service leads arrive by phone rather than by form, so without call tracking every other number on the report is an estimate. Dynamic number insertion swaps the displayed number per traffic source at roughly 85% to 92% accuracy on the major platforms, which is what separates a $72 Performance Max call from a $149 non-branded search call instead of reporting one blended $104 figure. Base subscriptions run $30 to $215 per month, and contractors who attribute calls to source recover 15% to 25% of Local Services Ads charges through Google disputes.
What does good attribution actually earn a contractor?
Contractors who track ad spend through to closed jobs report 20% to 35% higher marketing ROI than those who track clicks alone, and companies with clear attribution models reduce wasted ad spend by 15% to 30% according to Gartner marketing analytics research. Shops moving from monthly to weekly dashboard review typically cut blended customer acquisition cost 15% to 25% within a quarter. On a $12,000 monthly budget that range is $1,800 to $3,600 per month of recovered spend.
How much measurement signal is actually being lost?
Enough to reverse channel rankings. Meta conversions go untracked at a 30% to 50% rate on iOS without a Conversions API implementation, and installing CAPI lifts trackable conversions by the same 30% to 50%. A LiveRamp study found that poor identity precision collapsed measured ROI by roughly 70% in simulation — a truly $1.50 return read as $0.43 — and that when missing impressions concentrate among converters, channel rankings reverse at a data loss of roughly 1%. Random 20% impression loss preserved the ranking; biased loss destroyed it.
Which attribution model should an HVAC contractor use?
Start with source-to-booked-job reporting rather than a formal multi-touch model. The binding constraint is not model sophistication, it is data completeness: a phone-number join key that survives the call-to-CRM-to-invoicing handoff, a CSR script that captures source, and one CRM field that persists to closed-won. Once revenue is attributable at the booked-job level, first-touch and last-touch views are usually enough to reallocate budget, because the decisions being made are channel-level rather than creative-level.
Sources
PipelineOn — Contractor Call Tracking 2026
PipelineOn — Contractor Marketing Dashboard
PPC Land — LiveRamp Identity Error Study
PPC Land — GCLID and Offline Conversion Imports
CustomerFlows — Home Service Business Statistics
Elev8 Operations — Contractor Marketing Statistics 2026
Built on Tenth — HVAC Marketing Benchmarks 2026
RYN Digital — HVAC Marketing Statistics 2026
CoreiBytes — Contractor Lead Response Data
ZipDo — HVAC Marketing Statistics
Search Engine Roundtable — Google Ads Conversion Measurement Update


