Table of contents
Health and wellness is the most technically demanding category on the open web. It is the most AI-summarised — AI Overviews appear on roughly 89% of healthcare queries — the most scrutinised under quality guidelines, and the most mobile-dependent. Yet only 51.3% of origins pass all three Core Web Vitals on mobile. Here is the 2026 technical baseline, and where the return on fixing it actually comes from.
Key Takeaways
- 51.3% of origins pass all three Core Web Vitals on mobile; 67.8% pass on desktop (June 2026 CrUX).
- The median site is 408ms slower on mobile, and mobile INP is roughly 2.5x worse than desktop.
- AI Overviews show on ~89% of healthcare queries, cutting top-result CTR by 58–61%.
- Only about 1,100 of 5,000 audited sites pass the Rich Results Test with zero errors.
- Valid schema pages are cited 3.1x more often in AI Overviews.
- Every 100ms of added latency costs roughly 3.5% of conversions.
The 2026 Technical Baseline
Start with the field data rather than lab scores. Just Analytics' Chrome UX Report analysis gives the cleanest read on where real sites sit.
| Metric | Mobile pass rate | Desktop pass rate | Gap |
|---|---|---|---|
| Largest Contentful Paint (LCP) | 63.7% | 78.4% | 14.7 pts |
| Interaction to Next Paint (INP) | 71.2% | 89.1% | 17.9 pts |
| Cumulative Layout Shift (CLS) | 78.9% | 82.3% | 3.4 pts |
| All three thresholds | 51.3% | 67.8% | 16.5 pts |
| WordPress origins, all three | 47.3% | — | 4.8M origins measured |
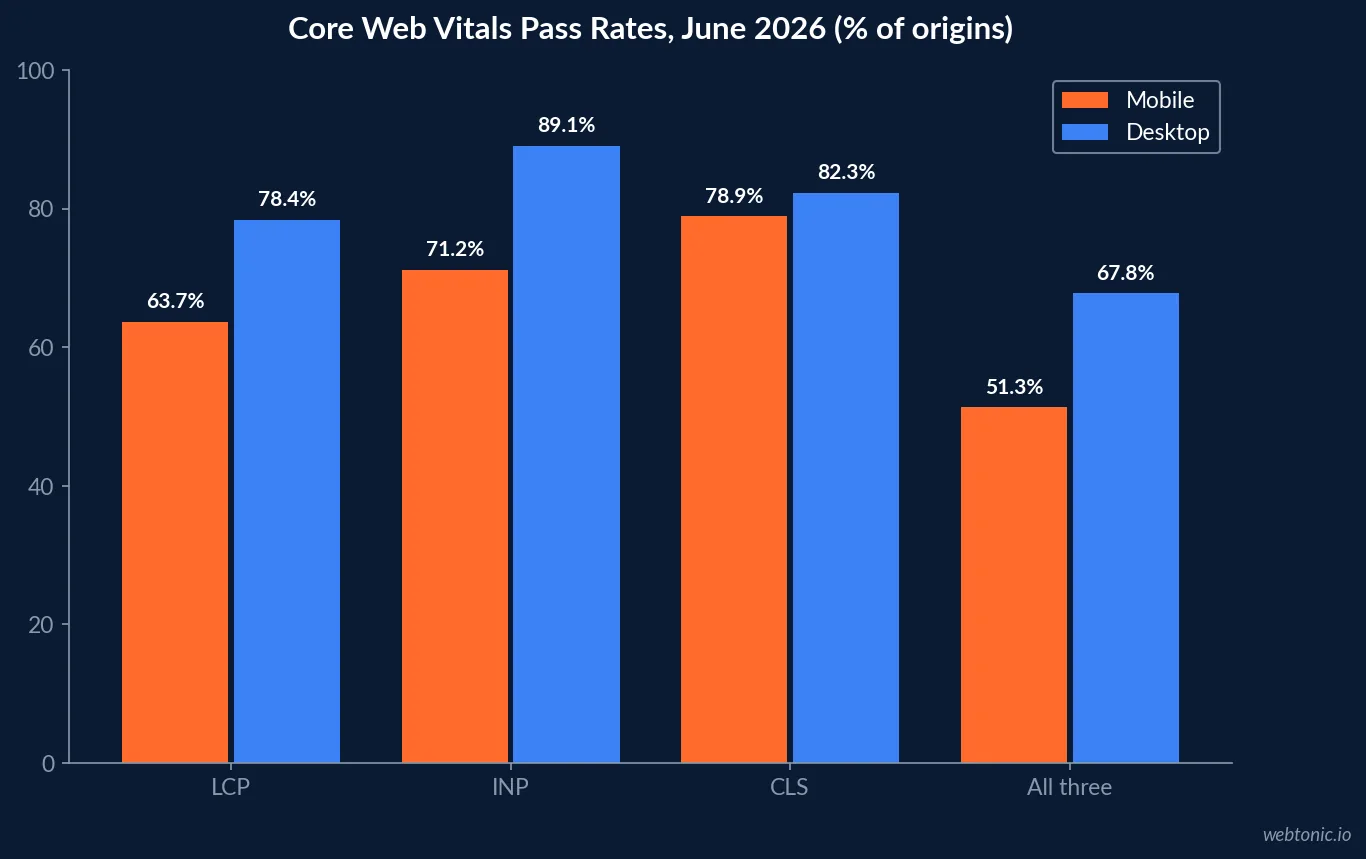
A parallel dataset from PageSpeed Matters, covering 13.75 million origins in May 2026, is slightly harsher: 49.1% mobile and 58.0% desktop passing all three. SearchLab puts the combined figure at roughly 42%. Treat the honest answer as "somewhere between two-fifths and half the web," and note that all three sources agree the mobile experience is the failure point.
1. The Mobile Penalty Is Bigger Than Most Audits Show
Wellness traffic is overwhelmingly mobile, which makes the device gap the headline finding rather than a footnote. PageSpeed Matters reports that 97% of sites are slower on mobile than desktop, that the median site is 408 milliseconds slower, and that median INP is 188ms on mobile against 76ms on desktop — a factor of roughly 2.5x on the interactivity metric Google now uses.
Why this matters commercially rather than editorially: mobile is where the transaction happens for supplements, bookings and programme signups. A desktop-tested site that passes and a mobile field experience that fails will show up as a conversion-rate problem long before it shows up as a ranking problem.
2. How Much Does Speed Actually Move Rankings?
Less than the industry implies. PageSpeed Matters found that page-one results pass Core Web Vitals 47.6% of the time versus 44.2% on page two — a gap of just over three points, widening to roughly 7.6 points among competitive sites. At position one, only 49.2% of results pass. In other words, half the pages ranking first for their query fail the metrics the industry treats as a ranking prerequisite.
The correct conclusion is not that performance work is optional. It is that performance is a tiebreaker for visibility and a primary driver of revenue. Those are different business cases, and conflating them is why so many wellness performance projects get defunded after the ranking needle barely moves.
3. The Conversion Case, Which Is the Stronger One
Shopify's enterprise analysis quantifies it directly: every 100 milliseconds of added load time costs roughly 3.5% of conversions, and every 32 milliseconds of added interaction delay costs about 1.5%. Independent commerce data puts sites loading under 2.5 seconds at a 2.4% conversion rate versus 1.0% for sites at five to six seconds — a 58% relative decline.
| Load time band | Typical conversion rate | Relative to sub-2.5s |
|---|---|---|
| Under 2.5 seconds | 2.4% | Baseline |
| 2.5 – 4 seconds | ~1.7% | -29% |
| 4 – 5 seconds | ~1.3% | -46% |
| 5 – 6 seconds | 1.0% | -58% |
For a wellness store doing 200,000 monthly sessions at a £60 average order value, moving from the five-second band to the sub-2.5-second band is worth more than most content programmes — which is the framing we use in data intelligence engagements when a technical backlog needs a budget owner.
4. Crawl and Index Reality
Crawlix's 2026 issue-frequency data shows how widely distributed the problem is: Core Web Vitals failures appear on 91% of sites at least once, and 34% of all crawled URLs fail at least one Core Web Vitals threshold. Site-level frequency and URL-level severity are different problems, and most audits only report the first.
Authority Specialist's category audit adds the wellness-specific picture. Across large JavaScript-heavy commerce domains, fewer than 45% of pages pass all three Core Web Vitals, with LCP the dominant failure. Of 34 audited health and wellness retailers, top performers captured 42% to 68% of category organic traffic. For medical practices, organic search drives 54% to 68% of new-patient sessions — which is why technical debt in this category compounds into a patient-acquisition problem.
5. Structured Data: Widely Deployed, Rarely Valid
This is the gap with the clearest arbitrage in 2026. Presenc reports schema.org markup on roughly 51% of web pages, with JSON-LD accounting for about 70% of structured-data implementations. But Digital Applied's audit of 5,000 sites found only about 1,100 passing the Rich Results Test with zero errors — a roughly 49-point gap between deployment and validation.
Authority Specialist puts the same finding in category terms: fewer than 40% of eligible pages carry correct structured data. And the payoff is now measurable in AI surfaces — Presenc reports AI Overview citations 3.1x higher on schema-valid pages. Schema long-tail concentration is also extreme: analysis of 5,545 schema types found 76.9% appear on fewer than 1,000 domains, so the handful of types that matter for wellness are worth getting exactly right.
| Schema type | Wellness application | Priority |
|---|---|---|
| Product + Offer + AggregateRating | Supplements, devices, functional food | Critical for commerce |
| FAQPage | Ingredient, dosage and safety questions | High — feeds AI answers directly |
| MedicalWebPage / MedicalCondition | Educational and condition content | High for YMYL credibility |
| Organization + Person (author) | Expert reviewer and author identity | Critical for E-E-A-T signals |
| LocalBusiness / MedicalClinic | Clinics, studios, practitioner locations | Critical for local visibility |
| BreadcrumbList | Category and taxonomy navigation | Moderate but cheap to ship |
6. AI Overviews Have Rewritten the Health SERP
No other category has been reshaped this much. RankVed, citing BrightEdge tracking from late 2025, reports AI Overviews on roughly 89% of healthcare queries, with organic click-through dropping about 61% when one appears. Broader tracking reported by HubSpot puts AI Overviews on 48% of all tracked queries as of February 2026, and Ahrefs-based analysis measured, as summarised by AEO Vision, the top-ranking page's CTR penalty rising from 34.5% in April 2025 to roughly 58% by December 2025.
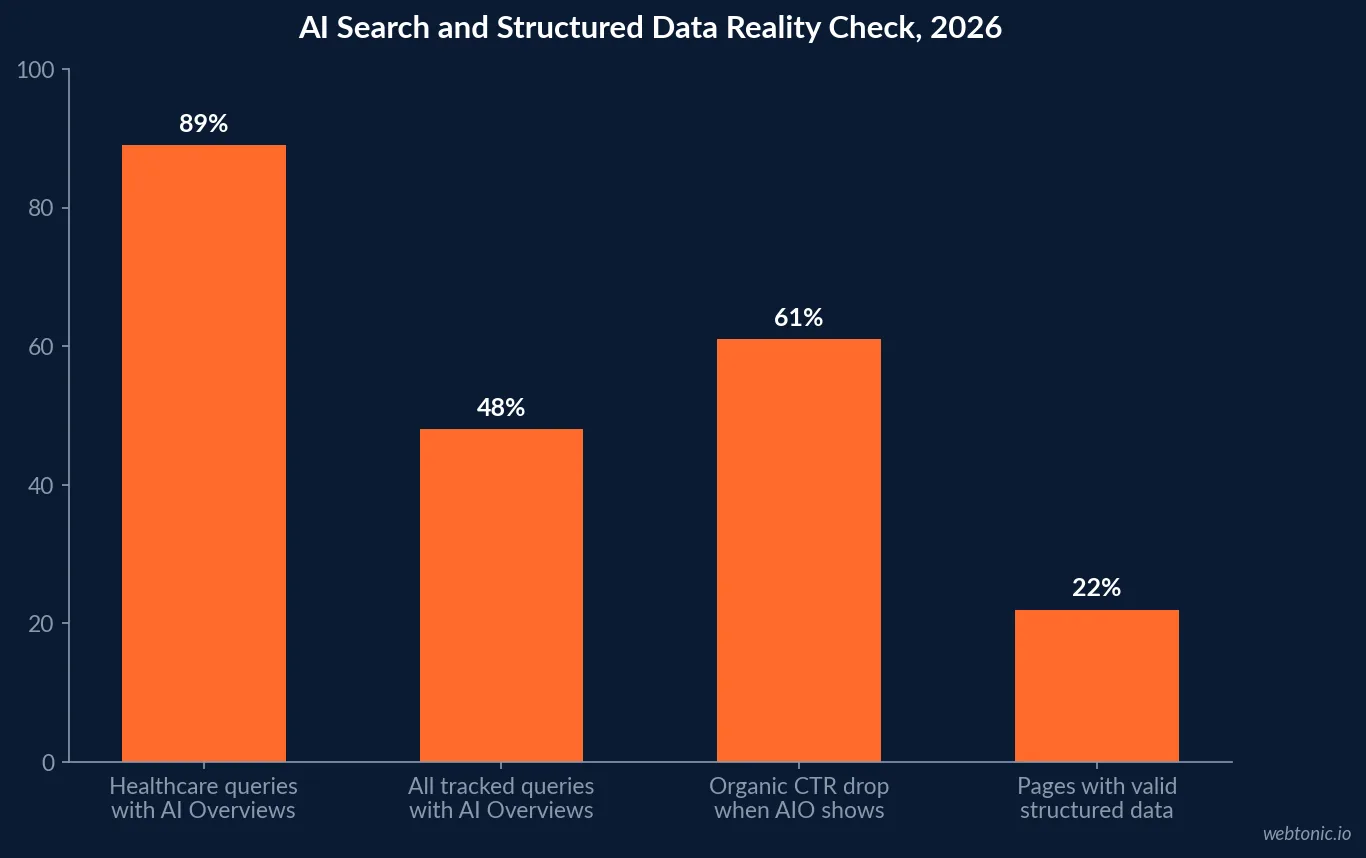
Two implications follow, and they pull in the same direction. First, ranking first is no longer the objective in this category — being cited is, which puts valid structured data, clear entity markup and extractable answer formatting on the critical path. Second, non-branded informational traffic will keep eroding, so the pages worth technical investment are the transactional, local and comparison templates where a click is still required to complete the task.
7. What the May 2026 Core Update Punished
Webserv's analysis of the May 2026 core update found healthcare among the hardest-hit sectors, with two specific patterns absorbing most of the damage: templated location pages spun across dozens of cities with only the place name changed, and thin YMYL content published without identifiable expert review. Neither is a "technical" issue in the crawl sense, but both are technical in origin — they are what templating at scale produces without an editorial gate.
The counter-example is structural rather than anecdotal. Authority Specialist's medical-practice dataset shows organic search driving 54% to 68% of new-patient sessions for practices that maintain genuinely differentiated location and service pages, while templated estates cluster far below that band. Denser sourcing and identifiable expert review are simultaneously a quality signal, an E-E-A-T signal and an AI-citation signal — one change serving three systems.
8. A Technical Priority Order for Wellness Sites
| Priority | Work item | Evidence base |
|---|---|---|
| 1 | Fix mobile LCP on template pages | 63.7% mobile LCP pass rate; 100ms costs 3.5% of conversions |
| 2 | Validate all structured data against Rich Results Test | Only ~1,100 of 5,000 sites error-free; 3.1x AI citation lift |
| 3 | Reduce mobile INP on interactive elements | Mobile INP ~2.5x worse than desktop |
| 4 | De-duplicate and enrich templated location pages | May 2026 core update targeted exactly this |
| 5 | Add author and reviewer entity markup | Fewer than 40% of eligible pages have correct markup |
| 6 | Restructure content for extractability | AI Overviews on ~89% of healthcare queries |
| 7 | Audit crawl waste at URL level, not site level | 34% of crawled URLs fail at least one CWV threshold |
The sequencing logic is deliberate: items one and three pay for themselves in conversion rate regardless of what Google does, item two buys the AI-visibility upside, and items four to six protect against the quality-update risk that has already cost this category the most traffic.
9. Measuring Technical Work When Clicks Are Disappearing
The hardest part of technical SEO in 2026 is proving it worked. With AI Overviews on the majority of health queries and top-result CTR down roughly 58% to 61% where they appear, ranking-position dashboards now systematically overstate health while impression-to-click ratios understate performance. The reporting frame that survives contact with this environment tracks four things in parallel:
- Field Core Web Vitals by template, not site-wide averages — the failures are concentrated in a handful of templates.
- Rich-result and AI-citation appearances, treating citation share as a first-class KPI alongside position.
- Conversion rate by load-time band, which converts milliseconds into revenue language a CFO accepts.
- Branded search and direct sessions, which capture the demand AI answers create but do not pass through as organic clicks.
Teams that need the underlying build work rather than the diagnosis can see how we sequence it in growth marketing programmes, and our reference points for paid-versus-organic tradeoffs sit in our Google Ads strategy guide. The underlying judgement for 2026 is simple: in a category where half the web fails on mobile and nine in ten queries return an AI answer, technical quality has stopped being a hygiene item and become the distribution mechanism itself.
Frequently Asked Questions
What share of websites pass Core Web Vitals in 2026?
Chrome UX Report data for June 2026 shows 51.3% of origins passing all three Core Web Vitals on mobile and 67.8% on desktop. Individually, mobile pass rates are 63.7% for LCP, 71.2% for INP and 78.9% for CLS. A separate May 2026 analysis of 13.75 million origins put the combined mobile figure at 49.1% and desktop at 58.0%, so roughly half the web still fails on phones.
Do Core Web Vitals actually affect health and wellness rankings?
The correlation is real but small. Page-one results pass Core Web Vitals 47.6% of the time versus 44.2% on page two, and even at position one only 49.2% of results pass. Speed is a tiebreaker rather than a primary ranking force — but it is a large conversion force, which is where the return sits.
How much traffic do AI Overviews take from health queries?
AI Overviews appear on roughly 89% of healthcare-related queries according to BrightEdge tracking, against about 48% of all tracked queries as of February 2026. When an AI Overview appears, organic click-through rate for the top-ranking page falls by roughly 58–61%. Health is the most AI-summarised category on the web.
Does structured data still matter for wellness sites in 2026?
More than before, because it feeds AI answers. Schema.org markup appears on about 51% of web pages and JSON-LD accounts for roughly 70% of structured-data implementations, yet in a 5,000-site audit only about 1,100 passed the Rich Results Test without errors. Pages with valid schema were cited about 3.1x more often in AI Overviews than pages without.
What technical issues hit health and wellness sites hardest?
Three: mobile performance, because the median site is 408 milliseconds slower on mobile than desktop and mobile INP runs about 2.5x worse; templated location pages with thin content, which the May 2026 core update penalised heavily in YMYL categories; and invalid structured data, since fewer than 40% of eligible pages on large sites carry correct markup.
Sources
PageSpeed Matters — Core Web Vitals Pass Rates
Just Analytics — Core Web Vitals Statistics 2026
SearchLab — Technical SEO Statistics 2026
Authority Specialist — Health & Wellness Store SEO Statistics
Crawlix — 2026 Technical SEO Issues Aggregate
RankVed — YMYL in Healthcare SEO
Digital Applied — Schema Markup Adoption, 5K Site Audit
Presenc — State of Schema.org for AI 2026
Shopify — Site speed and conversion
Webserv — May 2026 core update analysis
AEO Vision — AI Overviews & GEO Statistics 2026
Authority Specialist — Medical Practice SEO Statistics