



Table of contents

Median CAC payback is 16 months, while companies rate their own ability to demonstrate ROI at 4.2 out of 7. That combination - a slow payback clock and a weak measurement muscle - is why growth advisory engagements get judged on feeling rather than arithmetic.
Key Takeaways
- Median B2B SaaS CAC payback is 16 months, improved from 18 the prior year.
- The first quartile repays in 10 months, the fourth in 24.
- Top-quartile companies repay acquisition cost in six months or less.
- Fastest-growing companies post 10-month payback against 18 for slower growers.
- Companies rate demonstrating ROI from technology at 4.2 out of 7.
- Generating ROI scores 4.5, so proof lags performance.
- Marketing spend growth is 1.7% over twelve months, the lowest since 2021.
- Marketing budgets are 9.0% of revenue and 9.6% of firm budgets.
- High-growth professional services firms report 39.5% profitability.
- They allocate 12.0% of revenue to marketing against 5.0% for no-growth firms.
- Fractional advisory rates average USD 180 per hour at about nine hours a week.
- Retainer billing on project-shaped work can cost four to five times more.
The payback benchmark set
There is no dataset measuring the return on advice. There are good datasets measuring the economics advice is supposed to improve, and those are what an engagement should be priced and judged against. Benchmarkit's calendar-2025 benchmarking study is the most usable reference on the payback period question.
| Benchmark | 2026 reading | Source and population |
|---|---|---|
| Median CAC payback period | 16 months | Benchmarkit CY-2025, B2B SaaS |
| First-quartile payback | 10 months | Benchmarkit CY-2025 |
| Fourth-quartile payback | 24 months | Benchmarkit CY-2025 |
| Top-quartile payback | 6 months or less | Benchmarkit CY-2025 |
| Fastest growers' payback | 10 months | Against 18 for 11-20% growers |
| Marketing budget share of revenue | 9.0% | The CMO Survey 2026 |
| High-growth firm profitability | 39.5% | Hinge High Growth Study 2026 |
Payback improved, and the spread is the point
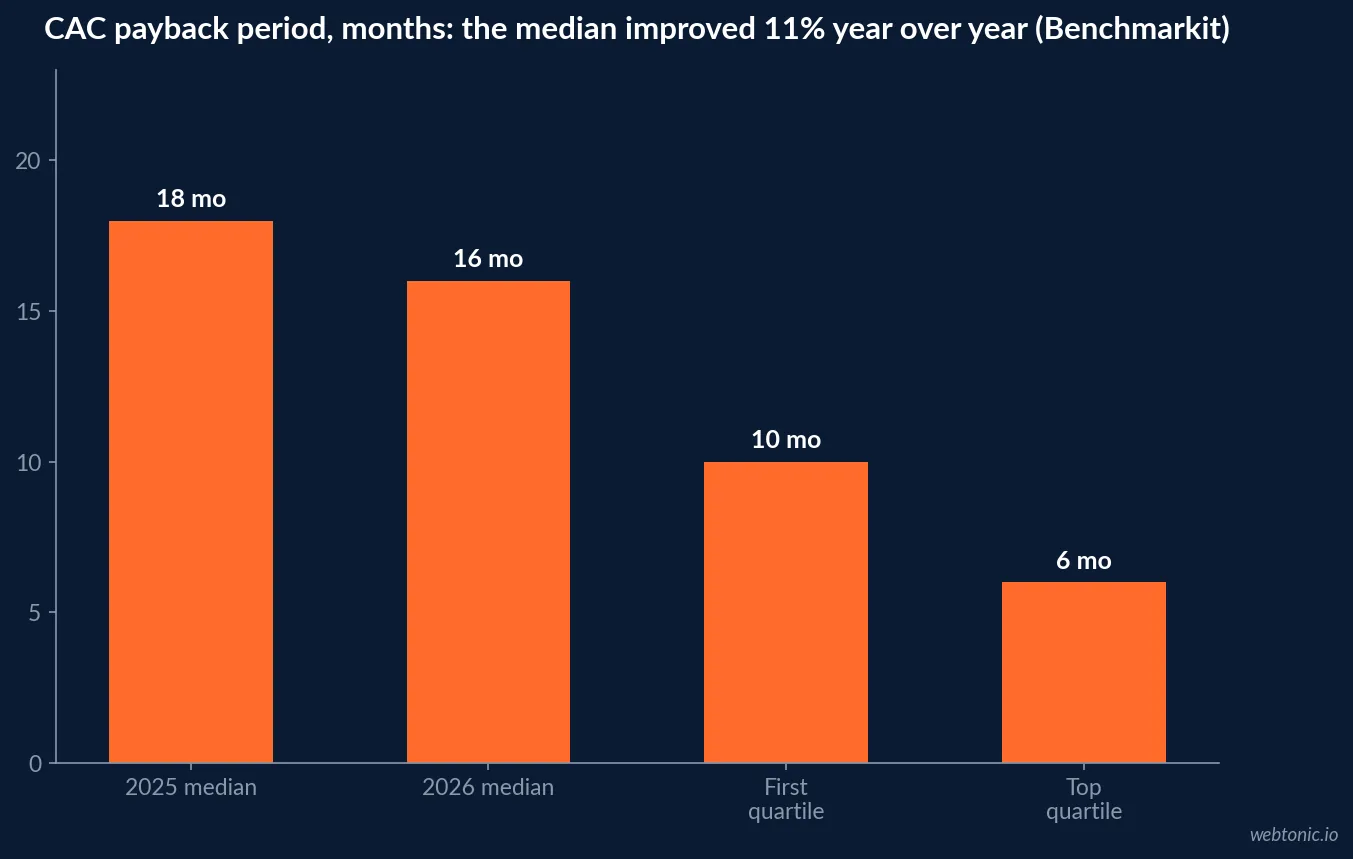
The headline movement is positive: median CAC payback improved from 18 months to 16, an 11% year-over-year gain. The spread underneath it is more useful for a revenue growth plan. The first quartile repays in 10 months while the fourth needs 24, and the top quartile recovers acquisition cost inside six months. Growth rate tracks that spread closely - the fastest-growing companies report 10-month payback against 18 months for companies growing 11-20%.
Two conclusions follow. First, a payback figure without a quartile is meaningless, because a 16-month median hides a 4x range. Second, payback is a growth constraint before it is an efficiency metric: a company repaying in 24 months cannot fund the same acquisition velocity as one repaying in ten, whatever its ambition.
The proof problem, measured
The CMO Survey's 2026 report asked leaders to rate marketing technology activities on a seven-point scale and no activity scored above 5. The relevant pair for any ROI conversation: generating ROI from marketing technologies scored 4.5 while demonstrating that ROI scored 4.2, a persistent measurement and attribution gap. Selecting vendors scored highest at 4.9, and hiring at 3.7 and training at 3.9 scored lowest.
This is the practical reason advisory engagements so often start with measurement. If a company cannot demonstrate the return on tools it already owns, it will not be able to evaluate the advice it is about to buy either - and the engagement ends in a negotiation about feelings. Fixing the baseline first is cheaper than arguing about attribution later, which is exactly where our data and analytics work starts.
| Capability rated | Score (1-7) | What it means for ROI claims |
|---|---|---|
| Selecting the right vendor | 4.9 | Buying is the strongest muscle |
| Generating ROI from technology | 4.5 | Performance outruns proof |
| Demonstrating ROI from technology | 4.2 | Attribution is the weak link |
| Training people | 3.9 | Capability gap caps returns |
| Hiring people | 3.7 | Lowest-rated activity in the survey |
The four-input payback calculation
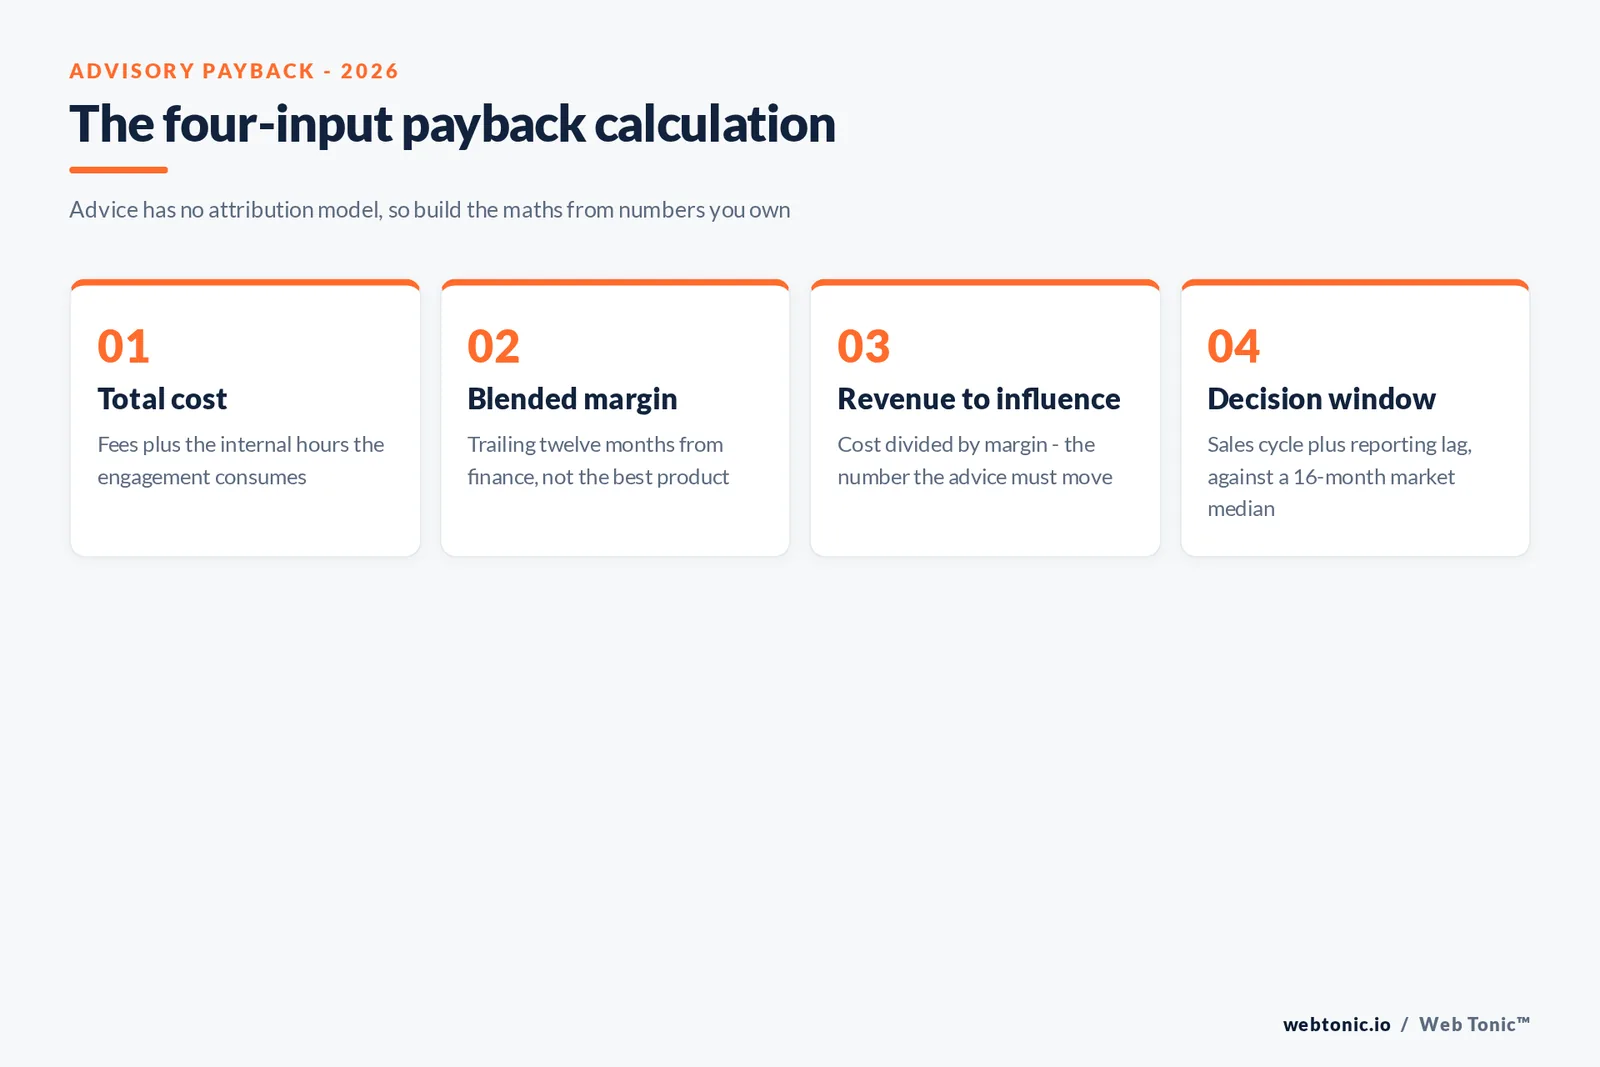
Because advice has no attribution model of its own, the calculation has to be built from numbers the company already owns. Total engagement cost including internal time. Real blended gross margin, not the headline figure. The incremental revenue implied by dividing one by the other. And a decision window matched to the sales cycle - with a 16-month median payback in the wider market, a 90-day review of a growth plan measures noise.
| Input | Where the number comes from | Common error |
|---|---|---|
| Total engagement cost | Fees plus internal hours consumed | Counting fees only |
| Blended gross margin | Finance, trailing twelve months | Using the best product's margin |
| Implied revenue to influence | Cost divided by margin | Comparing to total revenue |
| Decision window | Sales cycle plus reporting lag | Defaulting to a quarter |
| Counterfactual | Written before the start date | Reconstructed afterwards |
What the cost side looks like in 2026
Published third-party ranges set the denominator. GoFractional's rate data puts average fractional CMO rates at USD 180 per hour, median USD 175, with a middle band of USD 130 to 220 on engagements averaging nine hours a week, roughly 468 hours a year. Fractional Pulse reports retainers of USD 5,000 to 25,000 a month, initial terms of six to twelve months with 30-day notice, and projects running four to 24 weeks, with loaded hourly equivalents of USD 200 to 500 on retainers against USD 300 to 700 on project work.
The structural warning in that data matters more than the rates: paying retainer rates for project-shaped work can cost four to five times more, with a worked example of USD 180,000 against USD 40,000 for equivalent output. A diagnosis is project-shaped by definition. Buying it on a twelve-month retainer is the most common way a payback calculation is lost before the work starts.
| Cost structure | Published range | Payback consequence |
|---|---|---|
| Hourly advisory | USD 130-220 per hour typical band | Cheapest for defined diagnosis |
| Monthly retainer | USD 5,000-25,000 per month | Needs continuous work to justify |
| Project engagement | 4-24 weeks typical duration | Cleanest payback arithmetic |
| Retainer used for project work | 4-5x the project cost | Destroys the calculation |
| Equity-only compensation | Fails on ongoing scope | No cash payback to compute |
Pricing models change who carries the risk
Consulting Success's fee study of roughly 1,000 consultants found 30% pricing project-based, 29% hourly, 16% on monthly retainer, 15% on value and 10% on day rates, with 39% having never tried value-based pricing and 79% wanting to raise their fees. Only 38% earn USD 10,000 or more a month.
For a buyer, the model is a risk statement. Hourly and day rates put delivery risk on you. Project pricing shares it. Value pricing - used by 15% of the market - shifts it to the seller but requires an agreed baseline, which loops back to the measurement problem: you cannot price on value you cannot measure.
| Pricing model | Share of consultants using it | Who carries delivery risk |
|---|---|---|
| Project-based | 30% | Shared, if the scope is written |
| Hourly | 29% | The buyer |
| Monthly retainer | 16% | The buyer, continuously |
| Value-based | 15% | The seller, if a baseline exists |
| Day rate | 10% | The buyer |
The context that limits any return
Two figures cap what an engagement can deliver in 2026. The CMO Survey reports marketing spend growth of 1.7% over the past twelve months, the lowest since 2021, with budgets at 9.0% of revenue and 9.6% of overall firm budgets, and 53.1% of executives cutting costs first when under pressure - marketing taking the cut 45.4% of the time. Meanwhile 70.6% of leaders respond to executive pressure by shifting toward short-term impact.
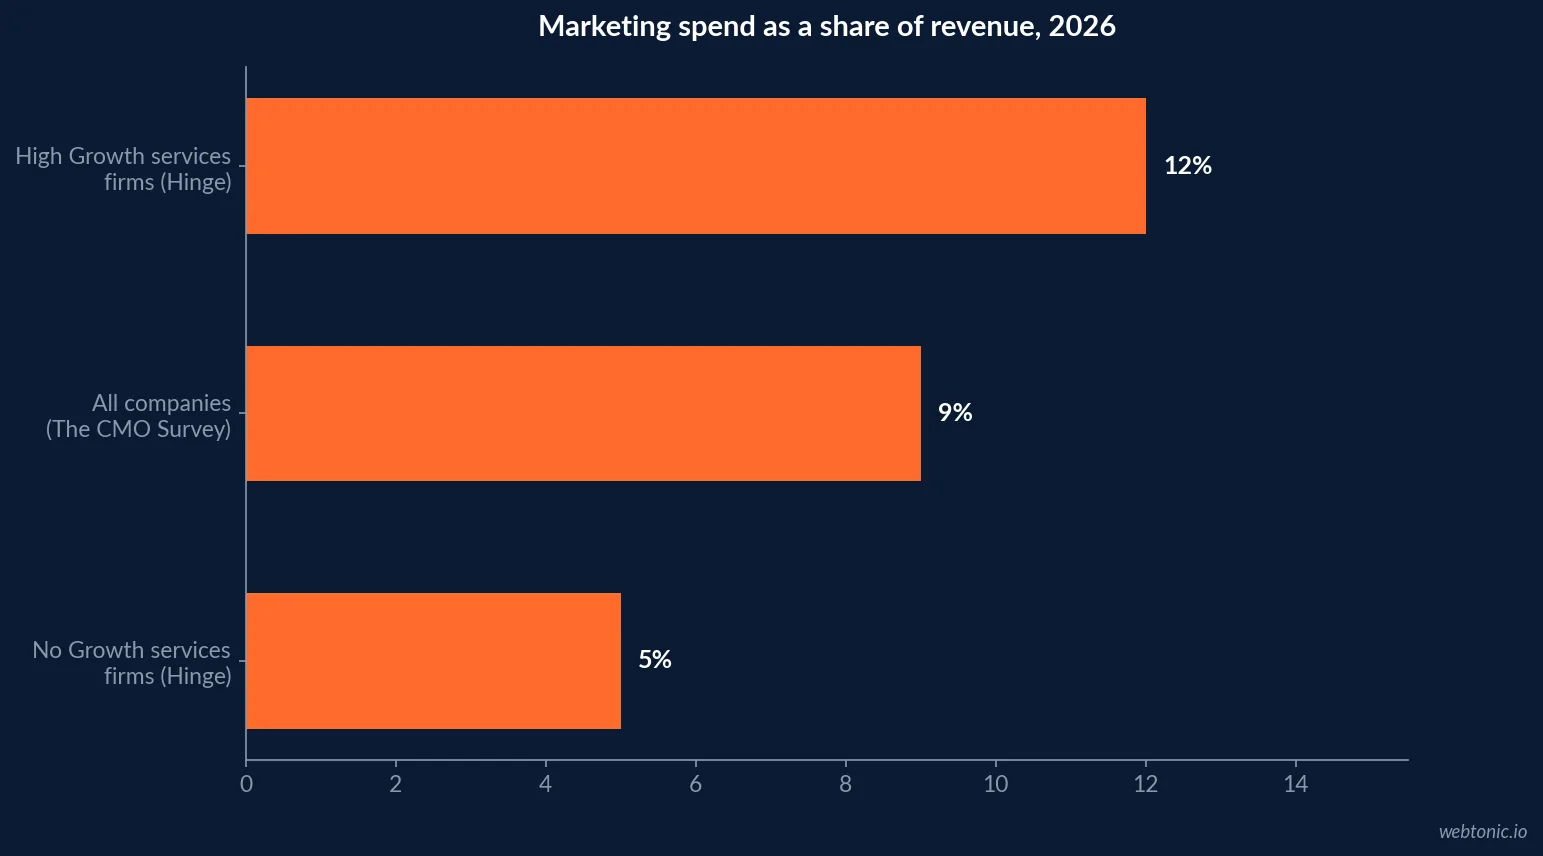
Against that, the Hinge Research Institute's High Growth Study 2026 shows what the upper end looks like: high-growth professional services firms posting 36.6% median growth and 39.5% profitability while allocating 12.0% of revenue to marketing, against 5.0% for no-growth firms. A plan built on a 5% budget inside a flat spending envelope has a mathematical ceiling no advice removes.
The scorecard to write into the engagement
Three clocks, agreed before the start date. At 90 days, the deliverables exist or they do not: a documented plan, an agreed measurement baseline and a decision log. At two quarters, the leading indicators move or they do not: qualified pipeline created, win rate against named competitors, blended acquisition cost. At twelve months, the economics are compared to the external set - payback against the 16-month median, profitability against 39.5%, marketing spend against 12.0% of revenue.
That structure will not prove causation, and it should not pretend to. It does make renewal a decision rather than a habit, which is the single highest-value clause in an advisory agreement. If you want an outside read on where your payback sits against these benchmarks, our growth marketing team works this way by default and you can get in touch to compare numbers.
| Clock | What is measured | Benchmark to compare against |
|---|---|---|
| 90 days | Plan, baseline, decision log | Deliverables exist or they do not |
| Two quarters | Qualified pipeline, win rate, blended CAC | Own trailing twelve months |
| Twelve months | CAC payback, profitability, spend share | 16 months, 39.5%, 12.0% |
Related reading
- AI Marketing Advisory Statistics: ROI and Payback
- Growth Advisory / Growth Consulting: how to choose a provider
- Growth Advisory / Growth Consulting: how to measure it
- Marketing Strategy Consulting services at Web Tonic
Frequently Asked Questions
How do you calculate the payback period on a growth advisory engagement?
Four inputs, no attribution model required. Take the total cost of the engagement including internal time, divide by your real blended gross margin to get the incremental revenue the advice has to influence, then set a decision window that matches your own sales cycle rather than a default 90 days. Fourth, write the counterfactual down before you start: what you would have done without the engagement. Without that baseline, month six becomes a debate rather than a review.
What is a realistic payback benchmark to compare against?
Benchmarkit's calendar-2025 B2B SaaS benchmarking study puts median CAC payback at 16 months, with a first quartile of 10 months, a fourth quartile of 24 months and a top quartile repaying acquisition cost in six months or less. Median payback improved from 18 months the prior year, an 11% gain, and the fastest-growing companies posted 10 months against 18 for those growing 11-20%. Those are software economics - a services firm should recompute on its own margin and use the quartile structure rather than the absolute months.
Can consulting ROI actually be proven?
Not causally, and no credible study claims otherwise. What the 2026 data does show is that companies are weak at proving marketing ROI in general: The CMO Survey rates the ability to demonstrate ROI from marketing technologies at 4.2 on a seven-point scale against 4.5 for generating it, and no technology activity in the survey scores above 5. The honest framing for an advisory engagement is a decision record - what changed, when, and what the numbers did afterwards - not an attributed revenue figure.
What does the cost side of the calculation look like?
Published third-party ranges give the shape. GoFractional puts average fractional CMO rates at USD 180 per hour, with a median of USD 175 and a middle band of USD 130 to 220, on engagements averaging about nine hours a week or 468 hours a year. Fractional Pulse reports retainers of USD 5,000 to 25,000 a month with initial terms of six to twelve months, and loaded hourly equivalents of USD 200 to 500 on retainers against 300 to 700 on project work. Diagnosis-only scopes sit at the short, project-shaped end.
Which KPIs prove an advisory engagement worked?
Split them by clock. Inside 90 days, the deliverables themselves: a documented plan, an agreed measurement baseline and a decision log. Inside two quarters, leading indicators - qualified pipeline created, win rate against named competitors, blended acquisition cost. At twelve months, the economics: CAC payback against the 16-month median, profitability against the 39.5% that high-growth professional services firms report, and marketing spend as a share of revenue against the 12.0% those firms allocate.
Sources
Benchmarkit - B2B SaaS Performance Metrics Benchmarks (CY-2025)
The CMO Survey - Highlights and Insights Report 2026
Hinge Research Institute - High Growth Study 2026
GoFractional - Fractional CMO rates
Fractional Pulse - Fractional executive engagement models compared (2026)
Consulting Success - Consulting fees study of nearly 1,000 consultants
The Business Research Company - Management Consulting Services Market Report
Sagefrog - 2026 B2B Marketing Mix Report


