



Table of contents

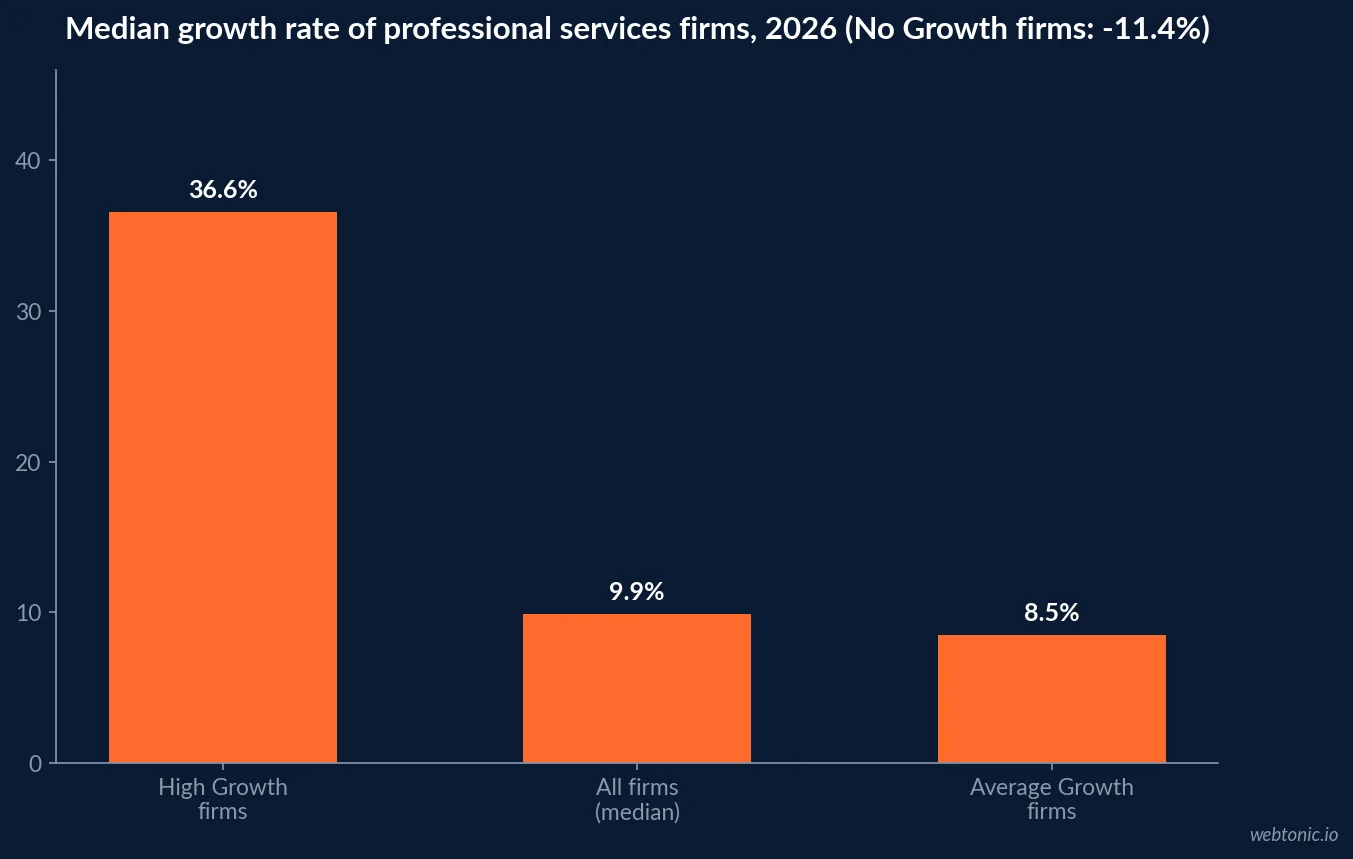
Median growth across professional services firms has fallen to 9.9%, the lowest recorded since 2018, while the high-growth cohort posted 36.6%. That spread is the entire case for growth advisory work - and it is also the benchmark set any engagement should be judged against.
Key Takeaways
- Median growth for professional services firms is 9.9% in 2026, the lowest since 2018.
- High Growth firms posted a median growth rate of 36.6%, more than four times the average.
- Average Growth firms grew 8.5% and No Growth firms contracted 11.4%.
- High Growth firms report 39.5% median profitability, against 29.6% and 20.3%.
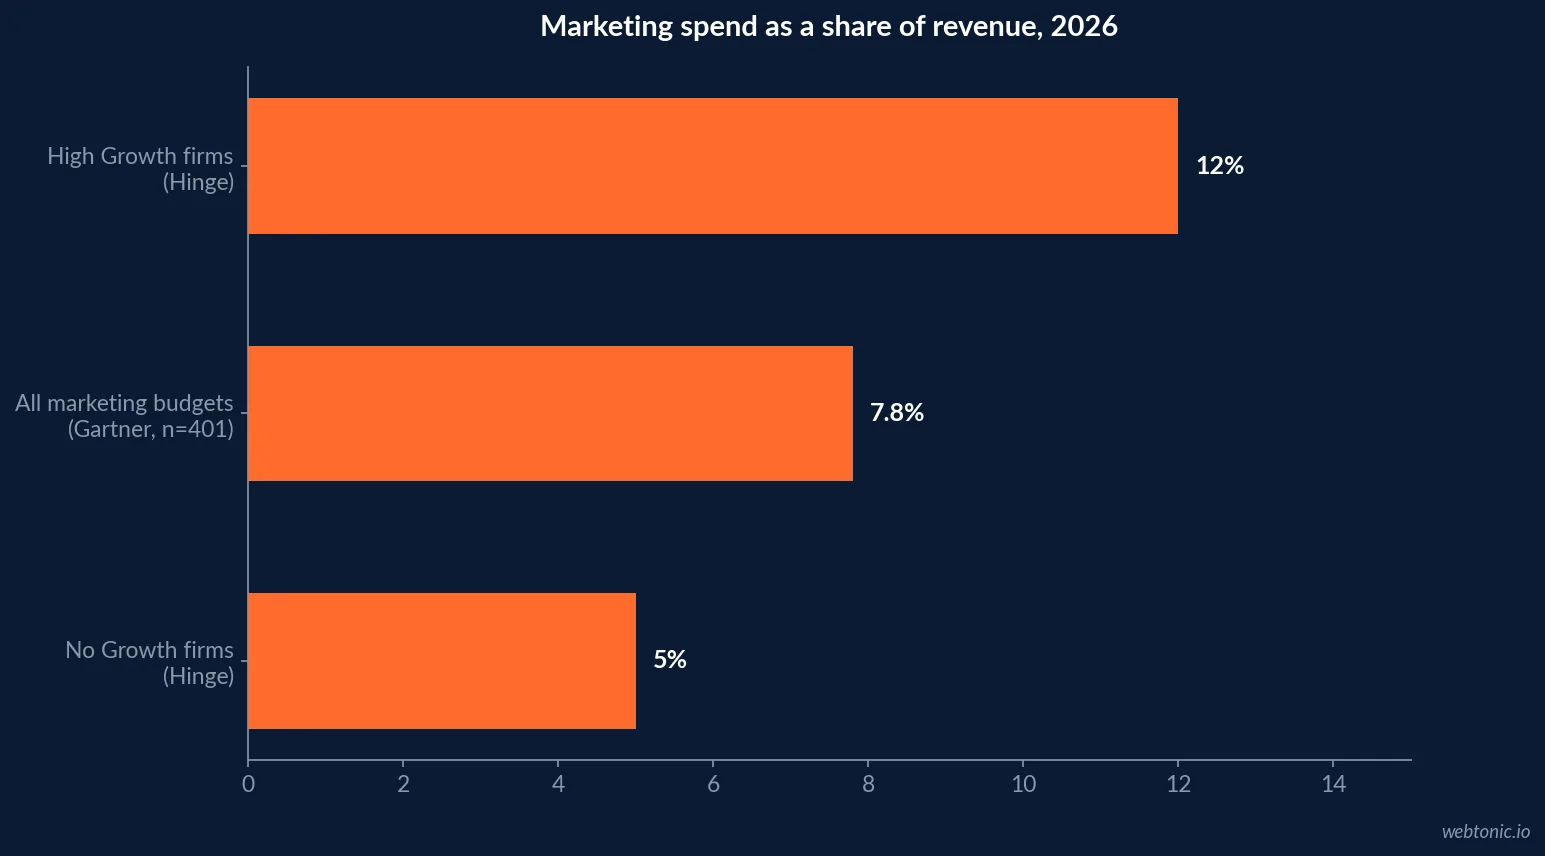
- They allocate 12.0% of revenue to marketing, against 5.0% for No Growth firms.
- Referrals still generate 39.5% of leads, nearly double the next largest source.
- Sales and direct outreach account for 23.5% of leads.
- Nearly one-third of firms say AI is actively disrupting their business model.
- 80% of High Growth firms conduct some form of structured research; one in five conduct none.
- Median B2B SaaS CAC payback is 16 months, improved from 18 the prior year.
- Marketing budgets sit at 7.8% of revenue in Gartner's 2026 survey of 401 leaders.
- The management consulting market reached USD 1,063.77 billion in 2025, growing 4.5% into 2026.
The growth benchmark set for 2026
Every figure below is traceable to a named study with a stated population. Where a source measures software companies rather than services firms, that is stated, because the two do not share economics.
| Benchmark | 2026 figure | Source and population |
|---|---|---|
| Median growth, all firms | 9.9% | Hinge High Growth Study 2026, professional services |
| High Growth firm median growth | 36.6% | Hinge High Growth Study 2026 |
| Average Growth firm growth | 8.5% | Hinge High Growth Study 2026 |
| No Growth firm growth | -11.4% | Hinge High Growth Study 2026 |
| High Growth profitability | 39.5% | Hinge High Growth Study 2026 |
| Marketing spend, High Growth | 12.0% of revenue | Hinge High Growth Study 2026 |
| Median CAC payback | 16 months | Benchmarkit CY-2025, B2B SaaS |
| Marketing budget share | 7.8% of revenue | Gartner 2026 CMO Spend Survey, n=401 |
What separates the top cohort
The Hinge Research Institute's High Growth Study 2026, the eleventh annual edition of the study, defines High Growth firms as those achieving at least 20% compound annual growth. That cohort posted a median growth rate of 36.6% against 8.5% for average-growth firms, an over fourfold gap, while No Growth firms contracted 11.4%.
Profitability follows the same split: 39.5% median profitability for High Growth firms, 29.6% for average growth and 20.3% for no growth. Two years earlier the leaders sat near 27% and the average near 23%, so the efficiency gap widened rather than converged - which is the strongest argument in the dataset that the growth difference is operational rather than cyclical.
| Cohort | Median growth | Median profitability | Marketing spend |
|---|---|---|---|
| High Growth | 36.6% | 39.5% | 12.0% of revenue |
| Average Growth | 8.5% | 29.6% | Between the two extremes |
| No Growth | -11.4% | 20.3% | 5.0% of revenue |
| All firms (median) | 9.9% | Not stated separately | Not stated separately |
The spending threshold has moved
High Growth firms allocate 12.0% of revenue to marketing, against 5.0% for No Growth firms. The leaders held steady at 10.0% in both the 2024 and 2025 studies, so this is a 20% jump in one year and it suggests the entry threshold for competitive growth spending has risen rather than that leaders simply spend freely.
Context matters here. Gartner's 2026 CMO Spend Survey, fielded among 401 marketing leaders at mostly large organisations, puts overall marketing budgets at 7.8% of revenue with 15.3% of that going to AI while only about 30% feel ready to scale it. A services firm budgeting 5% is not running a lean growth plan - it is running a maintenance plan, and no advisory engagement changes that arithmetic.
Where growth actually comes from
The lead-source data is the least fashionable finding in the study and the most useful. Referrals account for 39.5% of leads at High Growth firms, nearly double the next largest category, with sales and direct outreach contributing 23.5%. Digital channels matter, but they operate on top of a referral engine rather than instead of it.
Research behaviour splits the cohorts too. 80% of High Growth firms conduct at least some structured research, with 46.1% doing competitive research and 45.2% running client satisfaction and marketplace research, while one in five firms conduct no research at all. Notably, SEO and keyword research fell from 33.5% to 27.0% year over year, which is worth watching as AI answers absorb more zero-click searches - a shift we track closely in our data and analytics work.
| Lead source | Share of leads at High Growth firms | What it implies for the plan |
|---|---|---|
| Referrals | 39.5% | Relationship systems outrank campaign volume |
| Sales and direct outreach | 23.5% | Outbound is still a primary engine, not a legacy channel |
| Other digital and content sources | Remainder, fragmented | No single digital channel dominates |
| Competitive research conducted | 46.1% of firms | Positioning work is a measurable input |
| No research at all | 20% of firms | The clearest self-inflicted growth ceiling |
The KPI set to write into an engagement
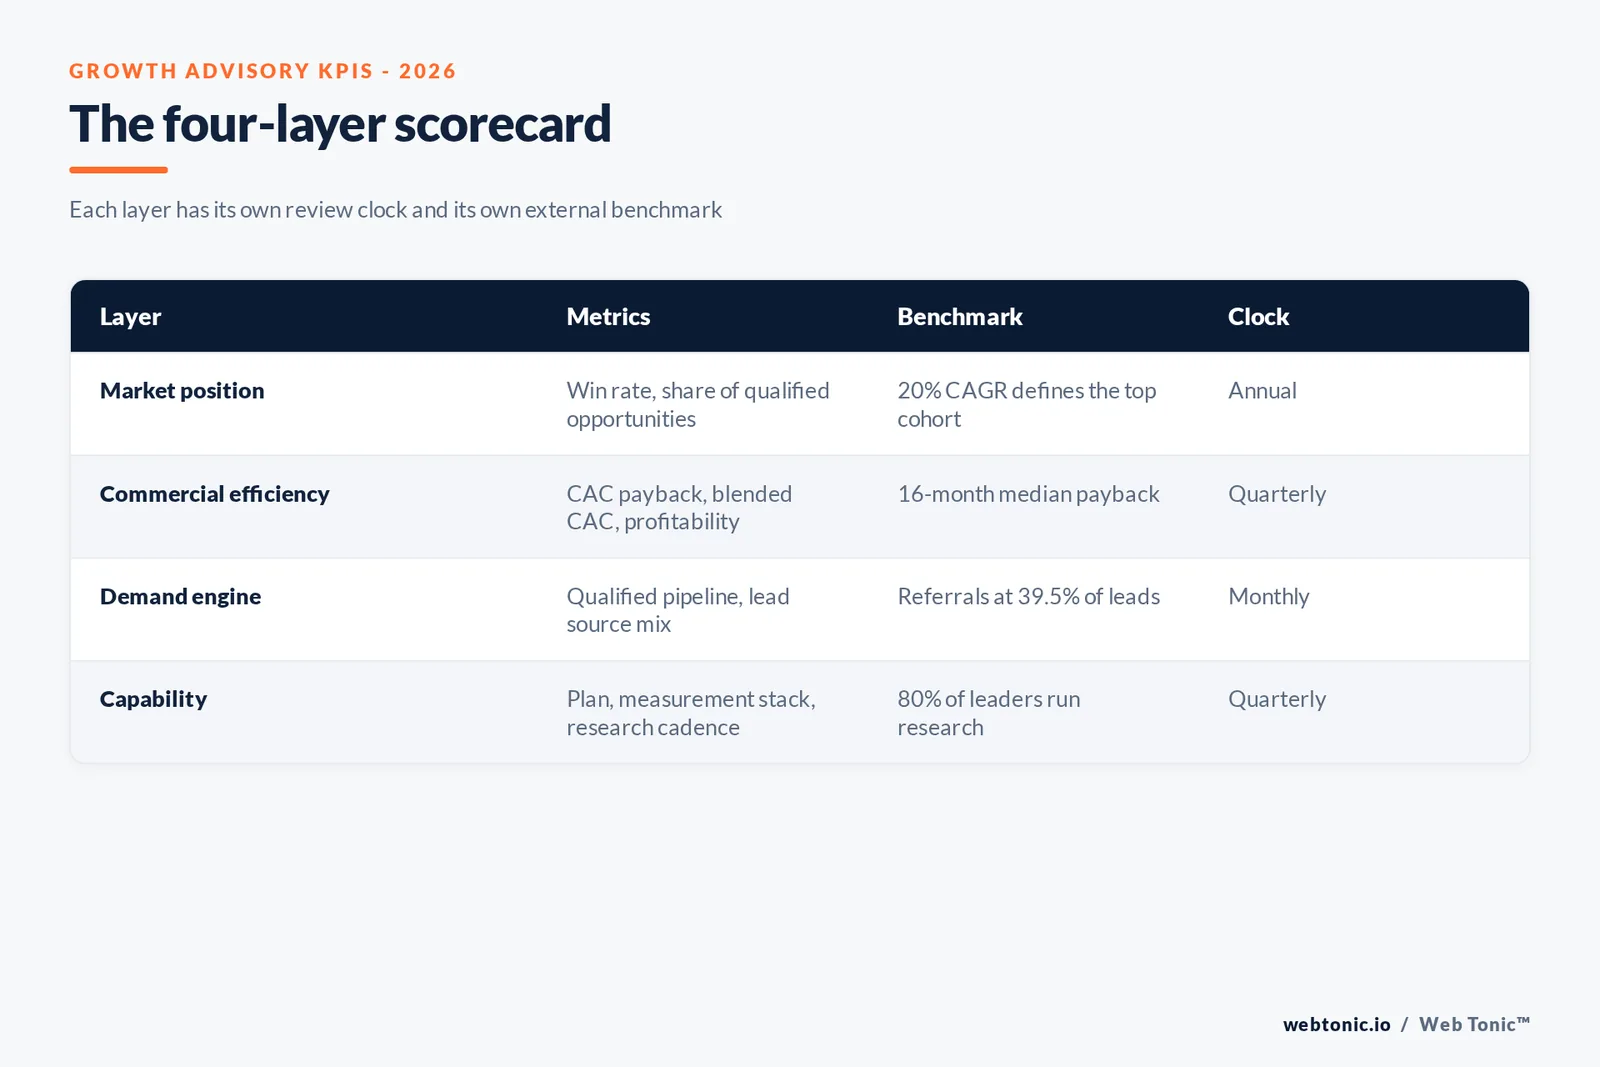
Because no dataset measures growth advisory outcomes directly, the scorecard has to be built from benchmarks that do exist. Four layers, each with its own review clock, keep the engagement honest without pretending revenue can be attributed inside a quarter.
| Layer | Metrics | Benchmark to compare against | Review clock |
|---|---|---|---|
| Market position | Win rate, share of qualified opportunities | 20% compound growth defines the top cohort | Annual |
| Commercial efficiency | CAC payback, blended CAC, profitability | 16-month median payback; 39.5% profitability | Quarterly |
| Demand engine | Qualified pipeline created, lead source mix | Referrals at 39.5% of leads | Monthly |
| Capability | Documented plan, measurement stack, research cadence | 80% of leaders run structured research | Quarterly |
Borrowing efficiency benchmarks carefully
Benchmarkit's calendar-2025 operating benchmarks put the median CAC payback at 16 months, with a first quartile of 10 months and a fourth quartile of 24, and the top quartile repaying acquisition cost in six months or less. Median payback improved from 18 months to 16 months, an 11% year-over-year gain, and the fastest-growing companies post a 10-month median against 18 months for those growing 11-20%.
Those are software numbers from a software sample. A services business with a six-week sales cycle should compute its own payback on its own gross margin, then use the quartile structure - not the absolute months - to judge where it sits. The same discipline applies to paid channels, which is why we benchmark creative and paid media against a client's own history before any external comparison.
The market context behind the demand
The advisory market itself is growing slowly rather than explosively. The Business Research Company's management consulting services report sizes the market at USD 1,063.77 billion in 2025, growing to USD 1,111.35 billion in 2026 at a 4.5% growth rate, and forecasts USD 1,407.09 billion by 2030 at a 6.1% compound rate.
Inside that market, buyers are consolidating. The CMO Survey's 2026 edition finds companies spending almost 60% of growth budgets on market penetration - selling more of what exists to customers they already have - and economic pessimism at its highest level since mid-2020. Advisory work sold as expansion strategy is being bought as penetration and efficiency work, and briefs should be written accordingly.
| Market signal | 2026 reading | Implication for an engagement brief |
|---|---|---|
| Consulting market growth | 4.5% into 2026 | Demand is steady, not booming |
| Budget focus | ~60% on market penetration | Expansion strategy is a harder internal sell |
| AI disruption reported | Nearly one-third of firms | Operating model questions now sit in scope |
| Marketing spend growth | 1.7% over 12 months | Plans must fit a flat envelope |
| Research skipped entirely | 20% of firms | Diagnosis is often the missing first phase |
The capability gap behind most stalled plans
The CMO Survey's 2026 edition puts a number on something advisory engagements meet constantly: marketing training budgets have fallen to 3.8% of marketing spending, down from a pre-pandemic high of 5.8%, and headcount growth has slowed by more than 50% from last year's rate. The most cited capability gap in the survey is not a missing skill but inadequate resourcing - not enough people, time or budget to make existing capabilities work.
The same survey finds marketers spending roughly 68% of their time managing the present against 32% preparing for the future, a ratio unchanged since 2019, and 70.6% responding to executive pressure by shifting toward short-term impact. A growth plan that assumes new hires and long-horizon attention is being written for a company that does not exist. Sequencing matters more than ambition: fix the measurement, then the offer, then the channels.
| Constraint | 2026 reading | Consequence for the roadmap |
|---|---|---|
| Training budget | 3.8% of marketing spend | Capability has to be bought, not developed |
| Headcount growth | Slowed by over 50% | Plans must fit the current team |
| Time on the present | 68% of marketing time | Long-horizon work needs protected slots |
| Short-term pressure response | 70.6% of leaders | Quick wins buy the room for structural work |
| Return to established strategies | 47.1% of leaders | Novel channels face internal resistance |
How to use these benchmarks without misreading them
Three rules. Match the population: Hinge measures professional services firms, Benchmarkit measures B2B software, Gartner surveys mostly large marketing organisations. Separate correlation from cause - high-growth firms spend more on marketing and research, but the study does not prove the spending produced the growth. And date every figure, because the payback and spending benchmarks both moved materially in a single year.
Used that way, the benchmark set does the one thing an advisory engagement most needs at the start: it tells you whether the problem is the offer, the pricing, the ICP or simply the size of the budget. That diagnosis is where our growth marketing team begins, and you can get in touch if you want a second opinion on where your numbers sit against this set.
Frequently Asked Questions
What growth rate counts as good in 2026?
The Hinge Research Institute's High Growth Study 2026 puts the median growth rate across professional services firms at 9.9%, the lowest recorded since 2018. High Growth firms - defined as those with at least 20% compound annual growth - posted a median of 36.6%, against 8.5% for average-growth firms and -11.4% for no-growth firms. So single-digit growth is the market, not a failure, and anything above 20% compound is genuinely top-decile behaviour rather than a rounding difference.
What KPIs should a growth advisory engagement be measured on?
Four layers, each on its own clock. Market position, reviewed annually: share of qualified opportunities and win rate against named competitors. Commercial efficiency, reviewed quarterly: CAC payback, blended acquisition cost and profitability against the 39.5% median that high-growth firms achieve. Demand engine, reviewed monthly: qualified pipeline created and lead source mix, since referrals still account for 39.5% of leads at high-growth firms. Capability, reviewed quarterly: the documented plan, measurement stack and research cadence the company keeps afterwards.
How much should a growing company spend on marketing?
High Growth firms allocated 12.0% of revenue to marketing in the 2026 study, against 5.0% for No Growth firms - a gap that widened from the 10.0% high-growth figure held in 2024 and 2025. Gartner's 2026 CMO Spend Survey, covering 401 mostly large marketing organisations, puts overall marketing budgets at 7.8% of revenue. The practical reading is that the entry threshold for competitive growth spending has risen, and a 5% budget is a maintenance budget.
Does growth consulting actually change outcomes?
There is no controlled study proving a causal effect, and any consultancy quoting one is quoting its own case studies. What the data supports is correlation between specific behaviours and growth: high-growth firms spend more than double on marketing, employ roughly triple the business development staff in the mid-market, and 80% conduct some form of structured research while one in five conduct none. Those are the behaviours worth buying advice about.
What is a realistic CAC payback target?
Benchmarkit's calendar-2025 B2B SaaS benchmarks put the median CAC payback at 16 months, with a first quartile of 10 months, a fourth quartile of 24 and a top quartile achieving six months or less. Median payback improved from 18 months the year before. Those are software economics; a services firm with shorter cycles and different gross margins should recompute the target on its own numbers rather than inherit the benchmark.
Sources
Hinge Research Institute - High Growth Study 2026
Benchmarkit - B2B SaaS Performance Metrics Benchmarks (CY-2025)
The CMO Survey - Highlights and Insights Report 2026
Gartner 2026 CMO Spend Survey (Business Wire release)
The Business Research Company - Management Consulting Services Market Report
Spencer Stuart - CMO Tenure 2026 Snapshot


