



Table of contents

Martech has fallen to 19.4% of marketing budgets, a five-year low, while AI now runs 24.2% of marketing activities. Adoption is accelerating and tooling budgets are shrinking at the same time, which is the central tension any growth advisory engagement now walks into.
Key Takeaways
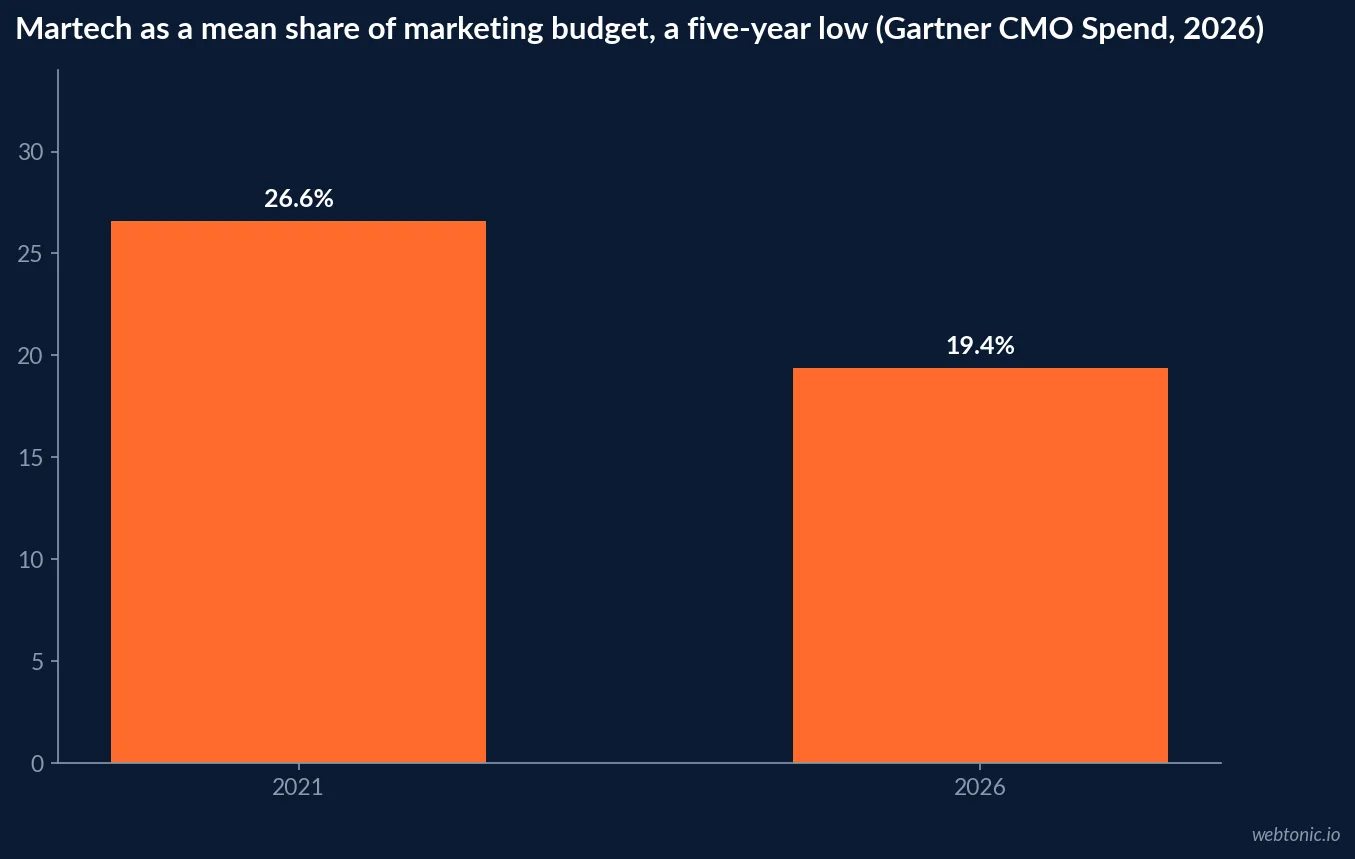
- Martech is 19.4% of marketing budgets in 2026, down from 26.6% in 2021.
- 62% of 401 surveyed marketing leaders still plan to invest more in technology.
- 56% increased their consumption-based martech allocation; only 9% cut it.
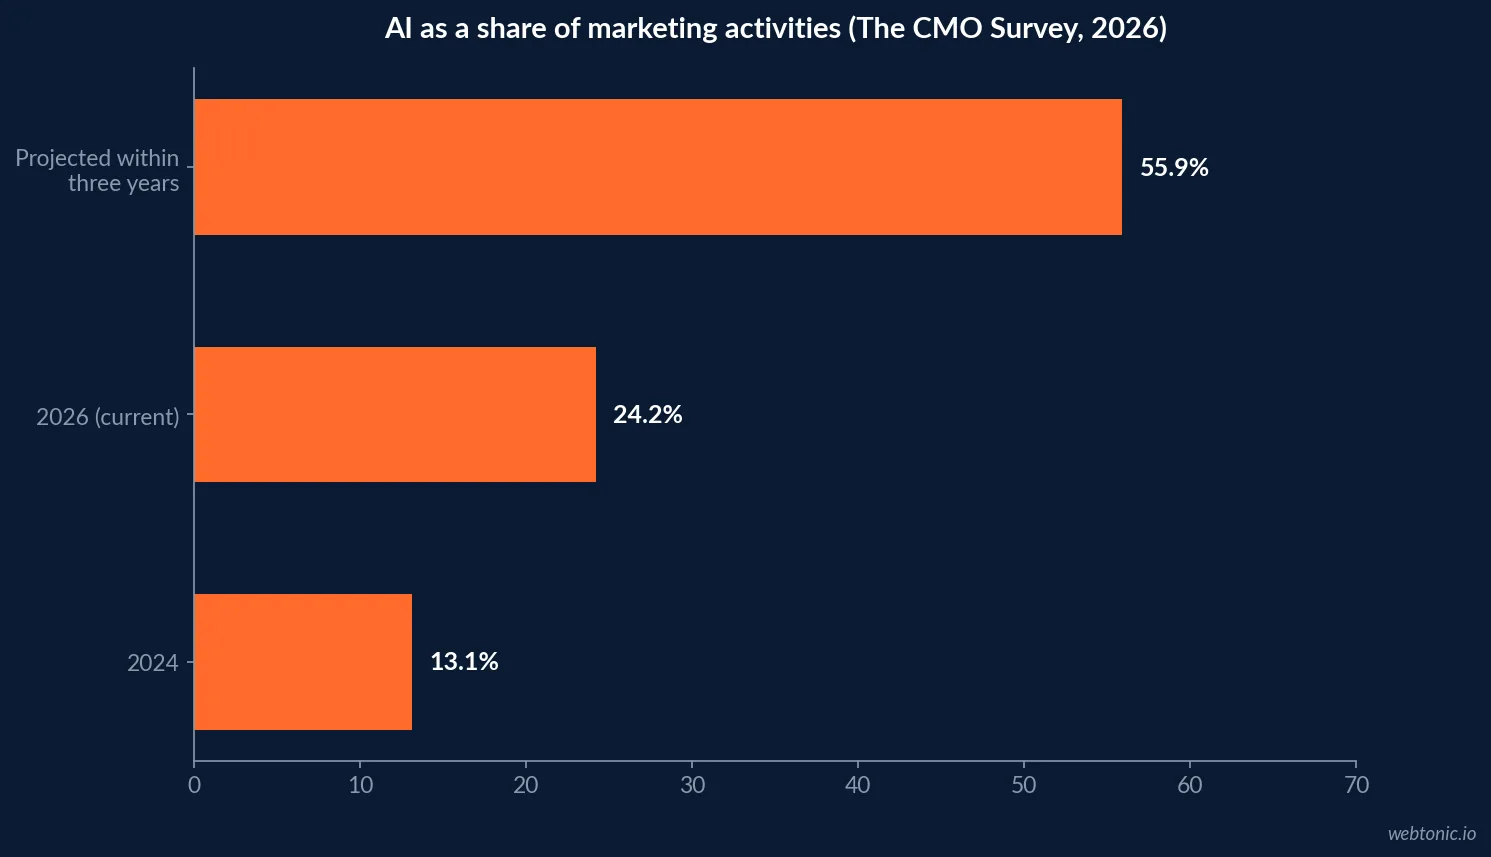
- AI runs 24.2% of marketing activities, up from 13.1% in 2024.
- Generative AI use grew 220%, from 7.0% to 22.4% of activities.
- Leaders project AI at 55.9% of marketing activities within three years.
- 41.5% of companies already practise Generative Engine Optimization.
- No marketing technology activity scores above 5 on a 7-point scale.
- Demonstrating ROI from martech scores 4.2; generating it scores 4.5.
- Hiring (3.7) and training (3.9) are the weakest martech activities.
- 22.3% of marketers name inadequate resourcing as their biggest capability gap.
- 68% of small business owners expect to raise marketing budgets in 2026.
Tooling budgets are shrinking while usage grows
According to reporting on the 2026 Gartner CMO Spend Survey, which covered 401 marketing leaders, the mean share of marketing budget allocated to martech has reached a five-year low of 19.4%, down from 26.6% in 2021 - even though 62% of those leaders plan to invest more in marketing technology.
The mechanism is pricing, not retreat. 56% of respondents increased the share of their martech budget spent on consumption-based models while 9% decreased it, and 41% have implemented or are implementing real-time usage controls with 24% overhauling systems specifically to cut consumption. Only 9% of CMOs rate their internal processes as fully optimised to scale AI, with a further 21% considered mature.
| Tooling signal | 2026 reading | Comparison |
|---|---|---|
| Martech share of marketing budget | 19.4% | 26.6% in 2021 |
| Leaders planning to invest more in tech | 62% | Of 401 respondents |
| Increased consumption-based allocation | 56% | 9% decreased it |
| Real-time usage controls in place | 41% | 24% overhauling systems |
| Processes fully optimised to scale AI | 9% | 21% rated mature |
| Total marketing budget | 7.8% of revenue | Gartner 2026, n=401 |
Adoption is real, and it is mostly AI
The CMO Survey's 2026 report puts AI at 24.2% of marketing activities, up from 13.1% in 2024, with generative AI growing 220% from 7.0% to 22.4% over the same period and companies projecting 55.9% of activities within three years.
Breadth matters as much as volume: content creation at 73.9%, content personalisation at 65.4%, automation at 48.9%, data analysis at 46.3% and targeting at 45.2% all show strong adoption growth since 2023, and 41.5% of companies already work on Generative Engine Optimization. That last number is the one to watch, because it is a brand-new line item competing for the same shrinking tooling budget - and it is why our data and analytics work now treats AI answer visibility as a measured channel rather than an experiment.
| AI application | Share of companies using it | Budget implication |
|---|---|---|
| Content creation | 73.9% | Volume rises, review capacity does not |
| Content personalisation | 65.4% | Depends on data governance quality |
| Automation | 48.9% | Displaces workflow tooling spend |
| Data analysis | 46.3% | Competes with analyst headcount |
| Targeting | 45.2% | Increasingly bundled into ad platforms |
| Generative Engine Optimization | 41.5% | New line item, no legacy budget |
Where adoption stalls: the execution scores
The same survey asked leaders to rate marketing technology activities from one to seven. No activity scored above 5, and scores have not improved in two years. Companies are strongest on vendor selection at 4.9 and technology mix decisions at 4.8, and weakest on hiring at 3.7 and training at 3.9. In between sits the gap that matters commercially: generating ROI from marketing technologies scores 4.5 while demonstrating it scores 4.2.
That two-tenths gap is a measurement problem masquerading as a technology problem. It is also the most common reason an advisory engagement starts with attribution and reporting rather than with strategy: nothing else can be argued until the numbers are agreed.
| Marketing technology activity | 2026 score (1-7) | 2024 score |
|---|---|---|
| Selecting the right vendor | 4.9 | 4.9 |
| Selecting the right mix of technologies | 4.8 | 4.9 |
| Integrating technologies into the funnel | 4.8 | 4.6 |
| Leveraging data for tactical decisions | 4.8 | 4.6 |
| Generating ROI from technologies | 4.5 | 4.5 |
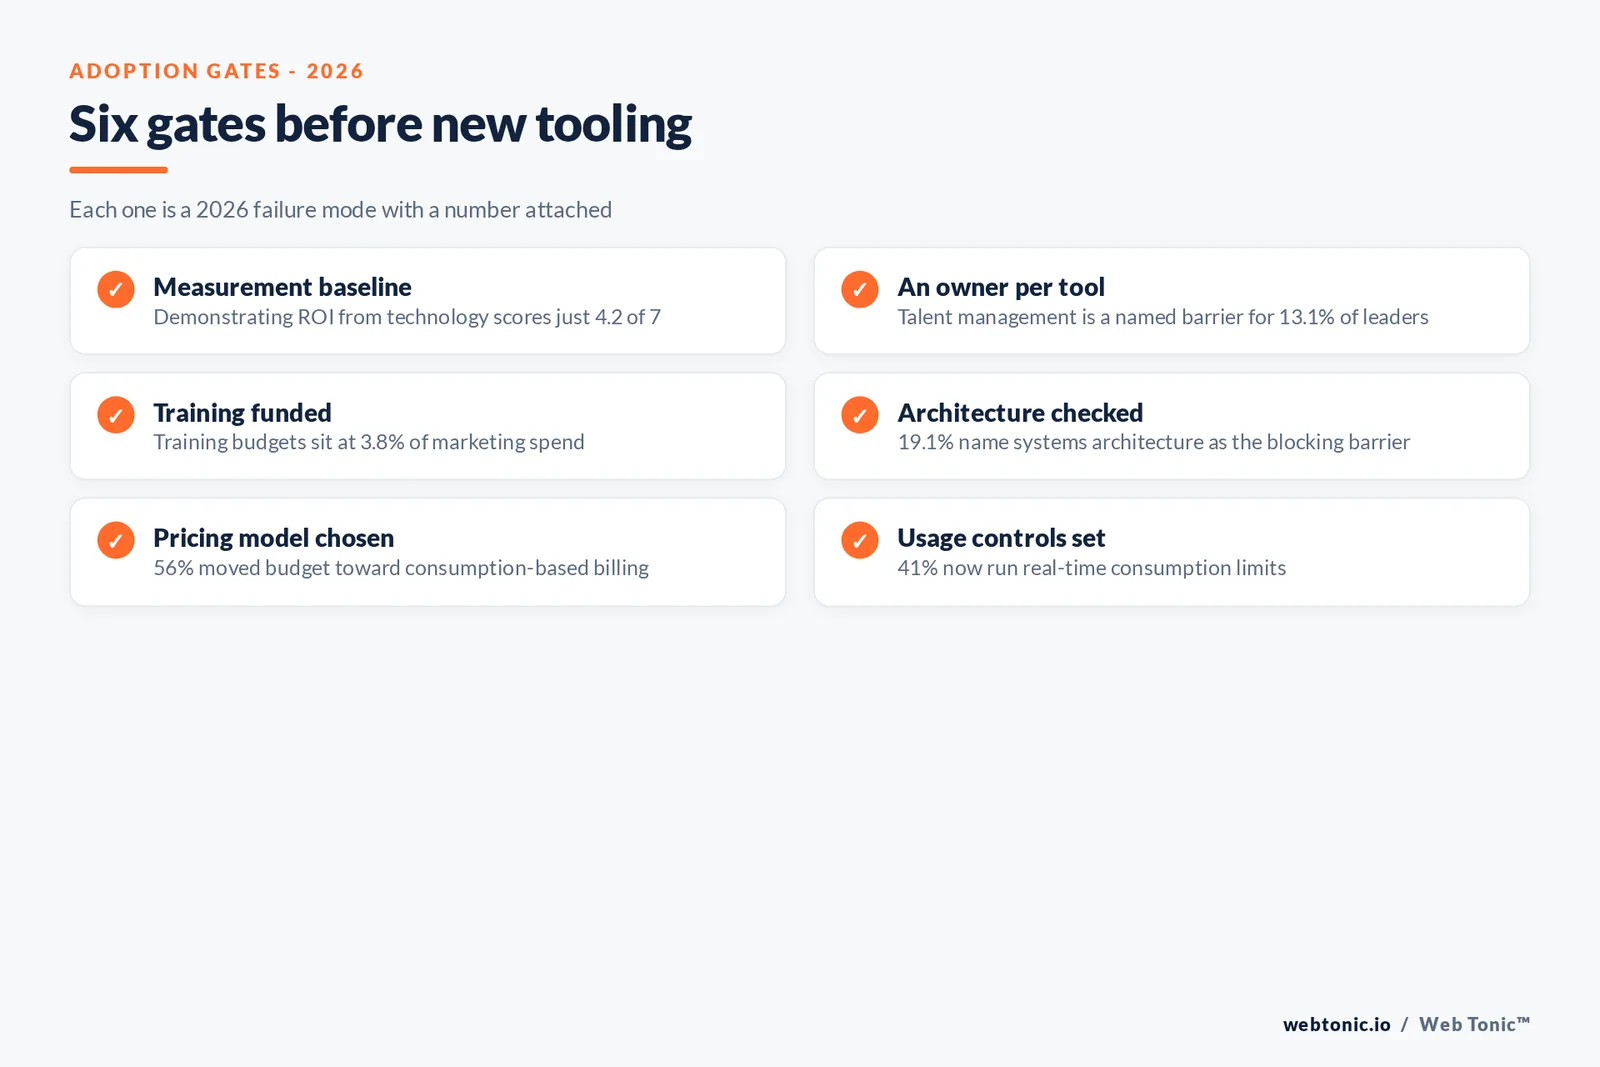
| Demonstrating ROI from technologies | 4.2 | Below the generating score |
| Training people to use technologies | 3.9 | Weakest with hiring |
The constraint is people, not software
Asked to name their biggest capability gap, 22.3% of marketers pointed at inadequate resourcing - existing capabilities without the people, time or budget to function - ahead of any specific missing skill. AI-related capability gaps across analytics, demand generation, generative AI, GEO and bots were cited by a combined 35.7% of leaders.
The funding side confirms it. Training and development budgets stand at 3.8% of marketing spend, down from a pre-pandemic high of 5.8%, and marketing headcount growth has slowed by more than 50% from the prior year. Named technology barriers follow the same pattern: systems architecture at 19.1%, bandwidth and focus at 14.1%, talent management at 13.1%.
| Barrier or gap | Share citing it | What it changes in a roadmap |
|---|---|---|
| Inadequate resourcing | 22.3% | Sequence fewer initiatives, finish them |
| AI capability gaps (combined) | 35.7% | Buy the skill before buying the tool |
| Systems architecture | 19.1% | Integration work precedes new purchases |
| Bandwidth, time and focus | 14.1% | Protect slots or nothing ships |
| Talent management | 13.1% | Training budget is 3.8% of spend |
Adoption by company stage
Stage changes both the tooling question and the advisory question. Smaller companies lean hardest on building capability internally - the CMO Survey shows companies under USD 10 million in revenue putting 64.1% of emphasis on building rather than partnering - while the intent to spend is rising at the bottom of the market. The Q1 2026 Small Business Now report found 68% of small business owners expecting marketing budgets to rise and 74% expecting to spend more of their own time on marketing, with inflation the top concern at 41% against 19% naming weak customer spending.
On the supply side, the Fractional Work Report records 149% year-over-year growth in demand for fractional operators, with marketing at 20% of demand and 64% of practitioners serving several clients at once. Advisory capacity is arriving fastest exactly where internal capacity is thinnest.
| Company stage | Dominant capability approach | Typical first advisory purchase |
|---|---|---|
| Under USD 10M revenue | 64.1% emphasis on building | Diagnosis and measurement setup |
| USD 10-99M revenue | Build-heavy with selective partners | Channel strategy and hiring plan |
| USD 100-999M revenue | Mixed build and partner | Operating model and attribution |
| USD 1B+ revenue | Partnering rises with scale | Specialist and transformation work |
Does an operating system change adoption?
Framework adoption has thinner evidence than tooling adoption, with one notable exception. TrueSpace's propensity-matched, Gallup-validated study of 305 companies found firms running EOS with a professional implementer grew 2.8 times faster than the control group. It is vendor-published and framework-specific, so the useful reading is narrow: structured operating cadence correlates with growth.
The adjacent finding from The CMO Survey is that 71% of leaders call developing agility key to their organisation's success, with a further 25% calling it moderately important. Cadence and clarity are being bought as much as capability.
What content and channel data adds
Tooling adoption sits on top of a content operation that has largely stopped debating whether it needs a plan. The Content Marketing Institute's 2026 B2B research found 97% of marketers reporting they have a content strategy, with only 3% saying they do not - but among those with one, only 13% say effectiveness improved significantly, 48% somewhat and 30% stayed flat.
HubSpot's 2026 State of Marketing report adds the sentiment layer: 61% of marketers believe marketing is in its biggest disruption in 20 years because of AI, with 80% using AI for content creation and 75% for media production. Near-universal strategy documents, flat effectiveness and near-universal AI use is a combination that produces volume without differentiation, which is why creative quality is becoming the scarce input rather than production capacity.
| Content and channel signal | 2026 reading | Reading for an engagement |
|---|---|---|
| Marketers with a content strategy | 97% | Existence of a plan proves nothing |
| Strategy effectiveness improved significantly | 13% | Effectiveness is the real gap |
| Strategy effectiveness flat | 30% | Audit before adding channels |
| Marketers using AI for content | 80% | Differentiation moves to point of view |
| Marketing in biggest disruption in 20 years | 61% | Change management is in scope |
How to sequence adoption without wasting budget
The data points at one order. Fix measurement first, because demonstrating ROI scores lowest of the activities that matter and every later argument depends on it. Fund capability second, since resourcing at 22.3% is the top gap and training sits at 3.8% of spend. Only then buy or expand tooling, and prefer consumption pricing with usage controls, as 41% of organisations now do.
Used that way, the shrinking tooling share stops looking like austerity and starts looking like discipline. If you want an outside read on which of those three stages your team is actually in, our growth marketing team runs that diagnosis first and you can get in touch to compare your numbers against this set.
Related reading
- AI Marketing Advisory Statistics: Adoption and Tooling
- Growth Advisory Tooling and Template Checklist
- Marketing KPI Scorecard Statistics: Adoption and Tooling
- Marketing Strategy Consulting services at Web Tonic
Frequently Asked Questions
How much of the marketing budget goes to tools in 2026?
Less than at any point in five years. Gartner's 2026 CMO Spend Survey of 401 marketing leaders puts the mean share of marketing budget allocated to martech at 19.4%, down from 26.6% in 2021, even though 62% of those leaders still plan to invest more in technology overall. The reconciliation is pricing: 56% of respondents increased the portion of their martech budget on consumption-based models while only 9% decreased it, so more usage is being bought for a smaller committed share.
Are teams actually using what they buy?
Not to the level the spending implies. The CMO Survey's 2026 edition rated marketing technology activities on a seven-point scale and found no activity above 5. Vendor selection scored 4.9 and mix decisions 4.8, but generating ROI from those technologies scored 4.5 and demonstrating it 4.2. Hiring (3.7) and training (3.9) were the weakest of all, which is the clearest signal that the bottleneck is capability rather than software.
How fast is AI adoption moving inside marketing teams?
Fast, and from a low base. The CMO Survey records AI running 24.2% of marketing activities in 2026, up from 13.1% in 2024, with generative AI specifically growing 220% from 7.0% to 22.4%. Leaders project 55.9% of marketing activities within three years. Generative Engine Optimization - getting content cited in AI answers - is already in use at 41.5% of companies, a capability that did not appear in earlier editions of the survey at all.
What blocks adoption most often?
Resourcing, not skill. The CMO Survey's most cited capability gap is inadequate resourcing, named by 22.3% of marketers, meaning existing capabilities lack the people, time or budget to function. Named technology barriers follow the same shape: systems architecture at 19.1%, bandwidth and focus at 14.1% and talent management at 13.1%. Training budgets sit at 3.8% of marketing spend, down from a pre-pandemic 5.8%, so the build strategy most companies claim is not funded.
Does adopting a formal operating system help?
There is one reasonably rigorous data point. TrueSpace ran a Gallup-validated, propensity-matched study of 305 companies and found those running EOS with a professional implementer grew 2.8 times faster than the control group. It is vendor-published research on a specific framework and a modest sample, so treat it as directional evidence that operating discipline correlates with growth, not proof that any one system causes it.
Sources
The CMO Survey - Highlights and Insights Report 2026
Chief Marketer - 2026 Gartner CMO Spend Survey martech findings
Gartner 2026 CMO Spend Survey (Business Wire release)
HubSpot - 2026 State of Marketing
Content Marketing Institute - B2B Content and Marketing Trends 2026
Constant Contact Research - Small Business Now, Q1 2026
EOS Worldwide - TrueSpace study of 305 companies
Fractional Jobs - Fractional Work Report
Hinge Research Institute - High Growth Study 2026


