



Table of contents

Only 52% of calls to a home-services business are answered by a person, and construction firms are one of the nine sub-industries in that 2026 dataset - so before a general contractor or remodeler argues about channel mix, the call-handling layer is usually the bigger leak.
Key Takeaways
- 52% of home-services calls are answered by a person (Invoca 2026).
- Answer rate climbs to 65% for calls over 15 seconds.
- Answer rate reaches 73% for calls over 30 seconds.
- Only 38% of digital-driven calls are real leads.
- 45% of qualified leads convert on the call itself.
- 55% of home-services businesses never ask a lead to book.
- 66% of consumers have hung up after being placed on hold (Invoca 2025).
- NAHB's Remodeling Market Index read 61 in Q2 2026, above the 50 break-even mark.
- The index has held in the low 60s for four straight quarters.
- Harvard's JCHS LIRA projects growth slowing to 0.5% by Q2 2027.
- 2026 planned median renovation spend fell to USD 15,000, down 25%.
- The 2025 actual median spend held at USD 20,000.
- The planned 90th percentile spend is USD 80,000 for 2026.
- The 2025 90th percentile spend reached USD 150,000.
- Home and Home Improvement carries a USD 8.33 average Google Ads CPC.
- That is the 2nd-highest CPC of any tracked industry.
- Construction firms cut 4.7 hours a week using AI tools (Houzz).
- That is worth an estimated USD 244,000 a year per firm in productivity.
The tracking problem sits before the CRM, not inside it
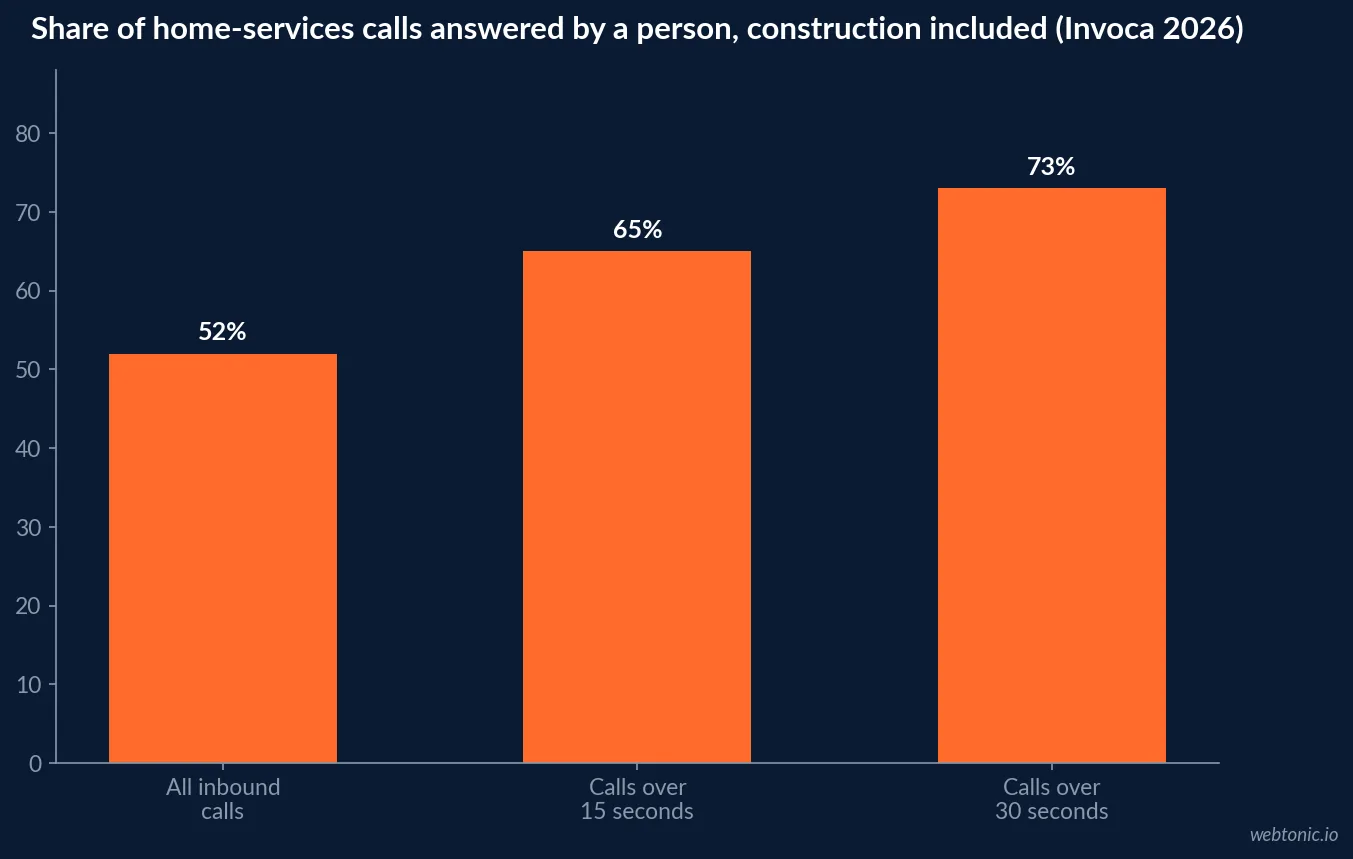
Invoca's 2026 Home Services Lead Conversion Benchmarks Report, built from anonymized calls across carpeting, construction, doors & windows, home security, HVAC, lawn & trees, pest control, plumbing and restoration, found that 52% of all inbound calls to a home-services business are answered by a person. Filter for calls lasting over 15 seconds - which removes misdials and immediate hang-ups - and the answer rate rises to 65%. Past 30 seconds it reaches 73%. Construction is named explicitly among the sub-industries, so this is not a generic services proxy; it is the segment general contractors and remodelers sit in.
Every dollar of media spend that drives a call which never gets picked up shows up as wasted budget in your ad platform's own reporting, because the platform recorded a conversion the instant the phone rang - answered or not.
| Call-handling benchmark (2026) | Figure | Source | What it flags |
|---|---|---|---|
| All inbound calls answered | 52% | Invoca 2026 | Baseline answer rate across home services |
| Calls over 15 seconds answered | 65% | Invoca 2026 | Filters out misdials and quick hang-ups |
| Calls over 30 seconds answered | 73% | Invoca 2026 | A cleaner read on real staffing coverage |
| Digital-driven calls that are leads | 38% | Invoca 2026 | Volume is not the same as opportunity |
| Qualified leads that convert on the call | 45% | Invoca 2026 | Where the close actually happens |
| Businesses that never ask a lead to book | 55% | Invoca 2026 | A conversion gap, not a media gap |
What "answered" is hiding: hold time and follow-up speed
Answer rate alone understates the leak. Invoca's 2025 Home Services Buyer Experience Report found 66% of consumers have hung up after being placed on hold for too long, and a homeowner who hangs up becomes the next company's booked job, not a re-attempt on yours. Web-form leads leak the same way: a quote request submitted at 9 p.m. that sits until the morning queue has usually already been answered by two competitors first.
None of this shows up as a tracking failure in most dashboards - it shows up as a rising cost per booked job and a falling ROAS with no obvious cause, because the ad platform still counts the ring as a conversion.
| What the number hides | Reported metric looks fine | What is actually happening | Fix layer |
|---|---|---|---|
| Answered call, long hold | Call marked "connected" | 66% of callers hang up on long holds | Route/queue tracking |
| Web form submitted | Lead counted at submission | Overnight leads go cold before follow-up | Speed-to-lead alerting |
| Call answered, no ask | Call marked "qualified" | 55% of firms never ask the lead to book | CRM close-step tagging |
| High call volume | Spend looks efficient | Only 38% of calls are real leads | Call-outcome tagging, not volume |
Reading the demand cycle: RMI says now, LIRA says next year
The NAHB Remodeling Market Index (RMI), a quarterly survey of NAHB remodeler members, read 61 in Q2 2026 - down one point from Q1 but well above the 50 break-even threshold, and the index has held in the low 60s for roughly a year. That is a present-tense sentiment read: contractors are still busy.
The Harvard Joint Center for Housing Studies (JCHS) Leading Indicator of Remodeling Activity (LIRA) tells a slower-moving story: year-over-year growth in national home improvement and repair spending is projected to decelerate to just 0.5% by the second quarter of 2027, continuing a multi-quarter slowdown. Neither figure is wrong - RMI is a sentiment snapshot, LIRA is a 12-month spending trajectory - and a tracking stack that only watches one of them is watching half the cycle.
| Demand indicator (2026) | Reading | Source | Time horizon |
|---|---|---|---|
| NAHB Remodeling Market Index, Q2 2026 | 61 (above 50 break-even) | NAHB | Current-quarter sentiment |
| NAHB RMI trend | Held low 60s for ~4 quarters | NAHB | Trailing 12 months |
| JCHS LIRA growth projection | Decelerating toward 0.5% | Harvard JCHS | Through Q2 2027 |
| Home & Home Improvement Google Ads CPC | USD 8.33, 2nd-highest tracked | WordStream by LocaliQ | 12-month rolling |
Budgets are splitting into two tiers, not shrinking evenly
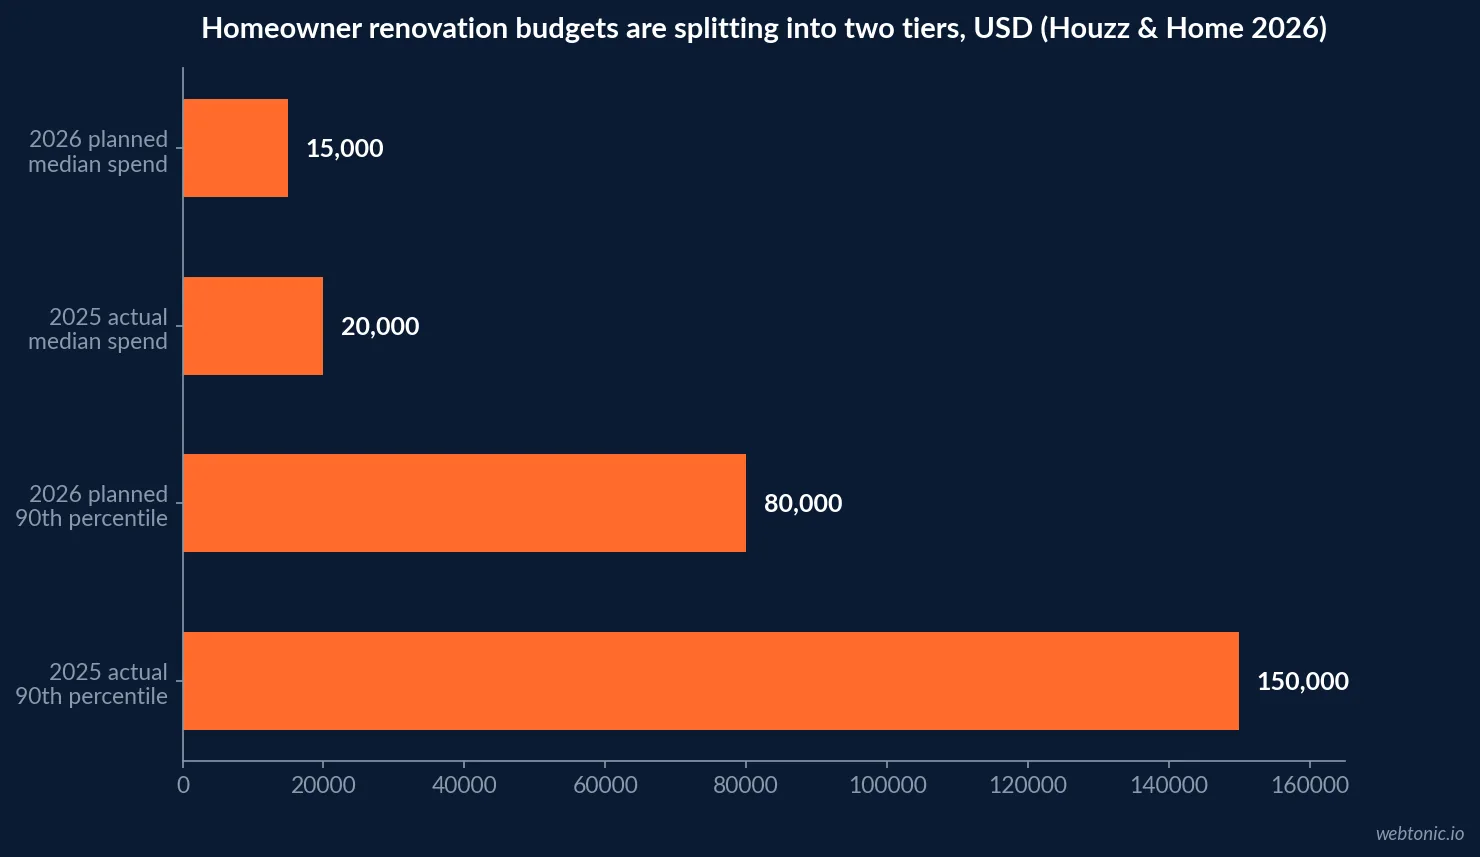
The 2026 U.S. Houzz & Home Renovation Trends Study puts planned median renovation spend for 2026 at USD 15,000, a 25% drop from the USD 20,000 actual median homeowners spent in 2025. The high end held up far better: the planned 90th percentile for 2026 is USD 80,000, only slightly below the USD 85,000 planned a year earlier, and 2025's actual top-decile projects reached USD 150,000, up from USD 140,000 in 2024.
Tracked against a single blended CPA target, that split reads as "leads are getting worse." Tracked by job-value tier, it reads correctly: smaller, budget-conscious jobs are pulling the median down while large remodels keep funding the top of the funnel. A tracking stack that tags lead value at intake, not just at close, catches this before the media plan does.
| Renovation budget tier | 2025 actual | 2026 planned | Change | Source |
|---|---|---|---|---|
| Median project spend | USD 20,000 | USD 15,000 | -25% | Houzz & Home 2026 |
| 90th percentile spend | USD 150,000 | USD 80,000 (2026 plan)* | See note | Houzz & Home 2026 |
| 90th percentile, planned Y/Y | USD 85,000 (2025 plan) | USD 80,000 (2026 plan) | -6% | Houzz & Home 2026 |
*Houzz reports both an actual 2025 spend figure and a separately surveyed "planned spend" figure for each year; the two 90th-percentile lines above are not the same measure and should not be subtracted from each other - both are shown so the trend is auditable against the source PDF.
Where AI is already changing the reporting layer
The 2026 U.S. Houzz State of AI in Construction & Design survey of 601 U.S. construction and design businesses found that firms using AI save 4.7 hours a week on average, translating to an estimated USD 244,000 in annual productivity gains per construction firm. Sales and marketing is the top AI use case for construction firms at 64%, ahead of planning and design at 61% and project and client management at 59%.
For tracking specifically, that shows up as faster tagging of call outcomes and lead sources rather than a new metric - the underlying call and spend data still has to come from a call-tracking platform, not from the AI layer sitting on top of it.
| AI use case (construction firms, 2026) | Adoption | Source | Tracking implication |
|---|---|---|---|
| Sales and marketing | 64% | Houzz State of AI 2026 | Fastest-growing use case year over year |
| Social media content creation | 74% | Houzz State of AI 2026 | More creative volume to attribute |
| Pre-project visuals | 70% (up from 42%) | Houzz State of AI 2026 | New asset type entering ad tests |
| Overall AI adoption for daily tasks | 41% of firms | Houzz State of AI 2026 | Up 7 points year over year |
What to build before the next budget cycle
Three moves, in order: tag every call by duration threshold so answer rate is measured at 15 and 30 seconds, not just "connected"; separate lead volume from lead qualification so a 38% qualification rate is visible to whoever owns the media budget; and benchmark spend against both RMI's current-quarter read and LIRA's trailing trajectory, not one or the other. None of this requires new spend - it requires the call and CRM data that is usually already being collected but not cross-referenced.
If the attribution layer is the gap, our data and analytics practice builds it before the media plan changes, our growth marketing practice can reset the channel mix once the data is trustworthy, and our breakdown of what paid search actually costs is a useful cross-check once the tracking is in place.
Why the composite index still matters more than any single lead source
The Q2 2026 NAHB RMI report is built from 212 remodeler responses nationally, and NAHB has published it as a quarterly read since well before this data set began, which is what makes the "above 50 for 24 consecutive quarters" framing in NAHB's own February 2026 release meaningful: it is a trend line, not a single snapshot. A tracking stack that only watches this quarter's lead volume against last quarter's has no way to tell whether a dip is company-specific (a staffing or answer-rate problem, per the Invoca data above) or industry-wide (a genuine demand slowdown the RMI would also show).
Practically, that means pairing the call-and-lead data above with a quarterly check against NAHB's published RMI release, not just an internal month-over-month CRM report. A lead-volume drop that coincides with an RMI drop is a market story; a lead-volume drop against a flat or rising RMI is a marketing or call-handling story, and the fix is entirely different in each case.
Frequently Asked Questions
What share of calls to a general contracting or remodeling business actually get answered?
Invoca's 2026 Home Services Lead Conversion Benchmarks Report, which tracks construction among nine sub-industries, found 52% of all inbound calls are answered by a person. Filtering out misdials and quick hang-ups (calls under 15 seconds) lifts that to 65%, and calls over 30 seconds reach 73%. Whichever cut you use, a meaningful share of paid-for calls never reach anyone.
How much of that traffic is actually a lead worth tracking?
Invoca's 2026 data puts it at 38%: just over a third of calls generated by digital marketing are real job opportunities once you strip out wrong numbers, spam and existing-customer service calls. Of those leads, 45% convert on the call itself, and separately Invoca reports 55% of home services businesses never explicitly ask the lead to book or buy - a conversion step, not a tracking one, but one your CRM should be flagging as missed.
Is remodeling demand growing or slowing right now?
Both are true depending on the window. NAHB's Remodeling Market Index sat at 61 in Q2 2026 - down one point from Q1 but comfortably above the 50 break-even line, and it has held in the low 60s for a year. Harvard's Joint Center for Housing Studies (JCHS) Leading Indicator of Remodeling Activity (LIRA) points the other way for the medium term, projecting renovation and repair spending growth to decelerate toward just 0.5% by Q2 2027. Track both: RMI reads current contractor sentiment, LIRA reads the multi-quarter glide path.
Why did homeowner renovation budgets drop in the 2026 numbers?
The 2026 U.S. Houzz & Home Renovation Trends Study found planned median renovation spend at USD 15,000 for 2026, a 25% drop from the USD 20,000 actual median homeowners spent in 2025. The high end held up better - the planned 90th percentile is USD 80,000 against USD 85,000 the year before - which means the budget compression is concentrated in smaller, first-time jobs, not the whole funnel.
What should a tracking stack for this industry actually measure?
At minimum: call answer rate split by duration threshold, lead qualification rate (not just call volume), cost per lead by channel against NAHB's own market-condition read, and job value against the Houzz spend tiers so a lean project and a full remodel are not scored on the same target CPA. Our data and analytics practice builds that stack before the ad spend, not after.
Sources
Invoca - Home Services Lead Conversion Benchmarks Report 2026
Invoca - Home Services Buyer Experience Report 2026
Invoca - Why home services brands pay to generate demand they never convert
NAHB - Remodeling Market Index (RMI)
Harvard Joint Center for Housing Studies - Leading Indicator of Remodeling Activity (LIRA)
Houzz - 2026 U.S. Houzz & Home Renovation Trends Study
Houzz - 2026 U.S. Houzz State of AI: Construction & Design Industry
WordStream by LocaliQ - Search Advertising Benchmarks by Industry 2026


