



Table of contents
The average sales funnel converts just 3–5% of visitors into customers, which means up to 97% of your marketing spend can leak away at friction points you may not even see. Funnel optimization is the systematic process of identifying and fixing those leaks so more prospects complete the journey from awareness to purchase.
Key Takeaways
- B2B funnels convert 1–5% end-to-end, while B2C and ecommerce funnels land between 5–15% (Kirro, 2026 benchmarks).
- A/B testing landing pages improves conversions by 10–37% on average, making it the single highest-ROI optimization tactic (MarketingLTB).
- Cart abandonment sits at 70.19% across industries, representing the largest single drop-off point in ecommerce funnels (Baymard Institute).
- Conversion rates dropped 6.1% year over year despite 13.2% more ad spend — proving that traffic volume cannot compensate for funnel leaks (Contentsquare, 2025).
- Data-driven funnel redesigns can lift ecommerce revenue by 47% and ROAS by 156% within 90 days (Eyal Dror case study).
- Top-performing landing pages convert at 5.31%+ (90th percentile) versus 2.35% median, with the gap driven by copy, value props, and friction reduction (DollarPocket).
What Is Funnel Optimization and Why It Matters
Funnel optimization is the practice of analyzing each stage of your conversion funnel — from initial awareness through consideration to final purchase — and systematically removing barriers that cause drop-offs. Unlike simply driving more traffic, optimization focuses on converting a higher percentage of your existing audience into paying customers. Agencies that specialize in growth marketing typically build funnel optimization into their core methodology.
The concept applies to every business model and every product service category. A SaaS company optimizes its trial-to-paid funnel. An ecommerce store tightens its browse-to-checkout flow. A B2B consultancy refines its lead-to-proposal pipeline. The stages differ, but the methodology — measure, hypothesize, test, iterate — stays constant.
Why does it matter now more than ever? According to Contentsquare's 2025 benchmarks, overall conversion rates dropped 6.1% year over year even though digital ad spend rose 13.2%. Companies are spending more to attract visitors but losing more of them at every stage. Funnel optimization is the only lever that reverses that equation without increasing budget.
Understanding the Conversion Funnel Stages
Before you can optimize, you need a clear map of your funnel stages and the data each one generates. Most funnels follow a four-stage model — awareness, interest, decision, and action — though the specific steps depend on your sales cycle length and product service complexity.
| Stage | User Intent | Key Metric | Typical Benchmark |
|---|---|---|---|
| Awareness | Discovering your brand | Impressions → Click-through rate | 1.5–3.5% CTR (search), 0.5–1.2% (display) |
| Interest | Evaluating your offer | Landing page → Lead/signup | 3.2% median, 9.7% top quartile |
| Decision | Comparing options | Lead → Opportunity (or Add-to-cart) | 38–55% MQL-to-SQL (B2B) |
| Action | Completing the purchase | Checkout → Purchase | 29.81% cart-to-purchase (inverse of 70.19% abandon) |
Each stage has its own conversion rates and friction points. The key insight from Prospeo's 2026 B2B benchmark data is that different industries see wildly different stage-by-stage rates — financial services close at 8.3% end-to-end while cybersecurity averages 4.2%. Knowing your industry baseline tells you where your conversion funnel underperforms relative to peers — and where your funnel optimization efforts will yield the highest return.
Identifying Funnel Drop-Offs With Data
The first step in any funnel optimization process is pinpointing exactly where users exit. Raw data from Google Analytics funnel exploration reports, heatmap tools like Hotjar, and session recordings reveal the specific pages, forms, or checkout steps causing friction.
Common drop-off patterns include:
- Landing page bounce rates above 60% — usually caused by message mismatch between ad copy and page content, slow load times (every 1-second delay cuts conversions by 7%), or unclear value propositions.
- Form abandonment above 70% — triggered by asking for too much information, lacking progress indicators, or requiring account creation before purchase.
- Cart abandonment at 70.19% — driven by unexpected shipping costs (48% of abandoners cite this), forced account creation, and lengthy checkout processes (Baymard Institute).
- MQL-to-SQL leakage — often a lead scoring or sales handoff problem rather than a marketing issue, where qualified leads are contacted too late or with irrelevant messaging.
Tracking user behavior through these funnel drop-offs in real time is essential. Modern funnel optimization tools like Usermaven, Amplitude, and Mixpanel let you build custom funnels with any sequence of events, then segment by audience attributes — device, traffic source, geography — to isolate exactly which user segments experience the worst friction.

Funnel Optimization Strategies That Drive Results
Once you have identified your drop-offs, the following optimization strategies address the most common friction points at each stage. The key is prioritizing by impact — fix the stage with the largest absolute leak first.
Top-of-Funnel: Attracting the Right Audience
Driving the wrong traffic is the costliest funnel mistake. Before optimizing downstream, verify that your ad targeting, keyword strategy, and content actually align with your ideal customer profile. Audience quality improvements at the top often cascade into better conversion rates throughout the entire funnel.
Actionable tactics:
- Audit search terms and negative keyword lists weekly to filter low-intent traffic
- Align ad messaging with landing page headlines — message match alone can lift conversions 20–40%
- Use lookalike audiences built from your highest-LTV customers rather than all converters
Mid-Funnel: Nurturing Interest Into Intent
The mid-funnel is where most B2B leads stall. According to Delverise's 2026 benchmarks, only 38–55% of MQLs convert to SQLs across industries. The fix is almost always better segmentation and more relevant follow-up content.
Best practices for mid-funnel optimization include:
- Implementing behavioral email sequences triggered by specific page visits or content downloads
- Creating comparison pages and case studies that address objections specific to each customer segment
- Shortening the sales cycle by offering demos, free trials, or instant access to resources
Bottom-of-Funnel: Reducing Checkout and Conversion Friction
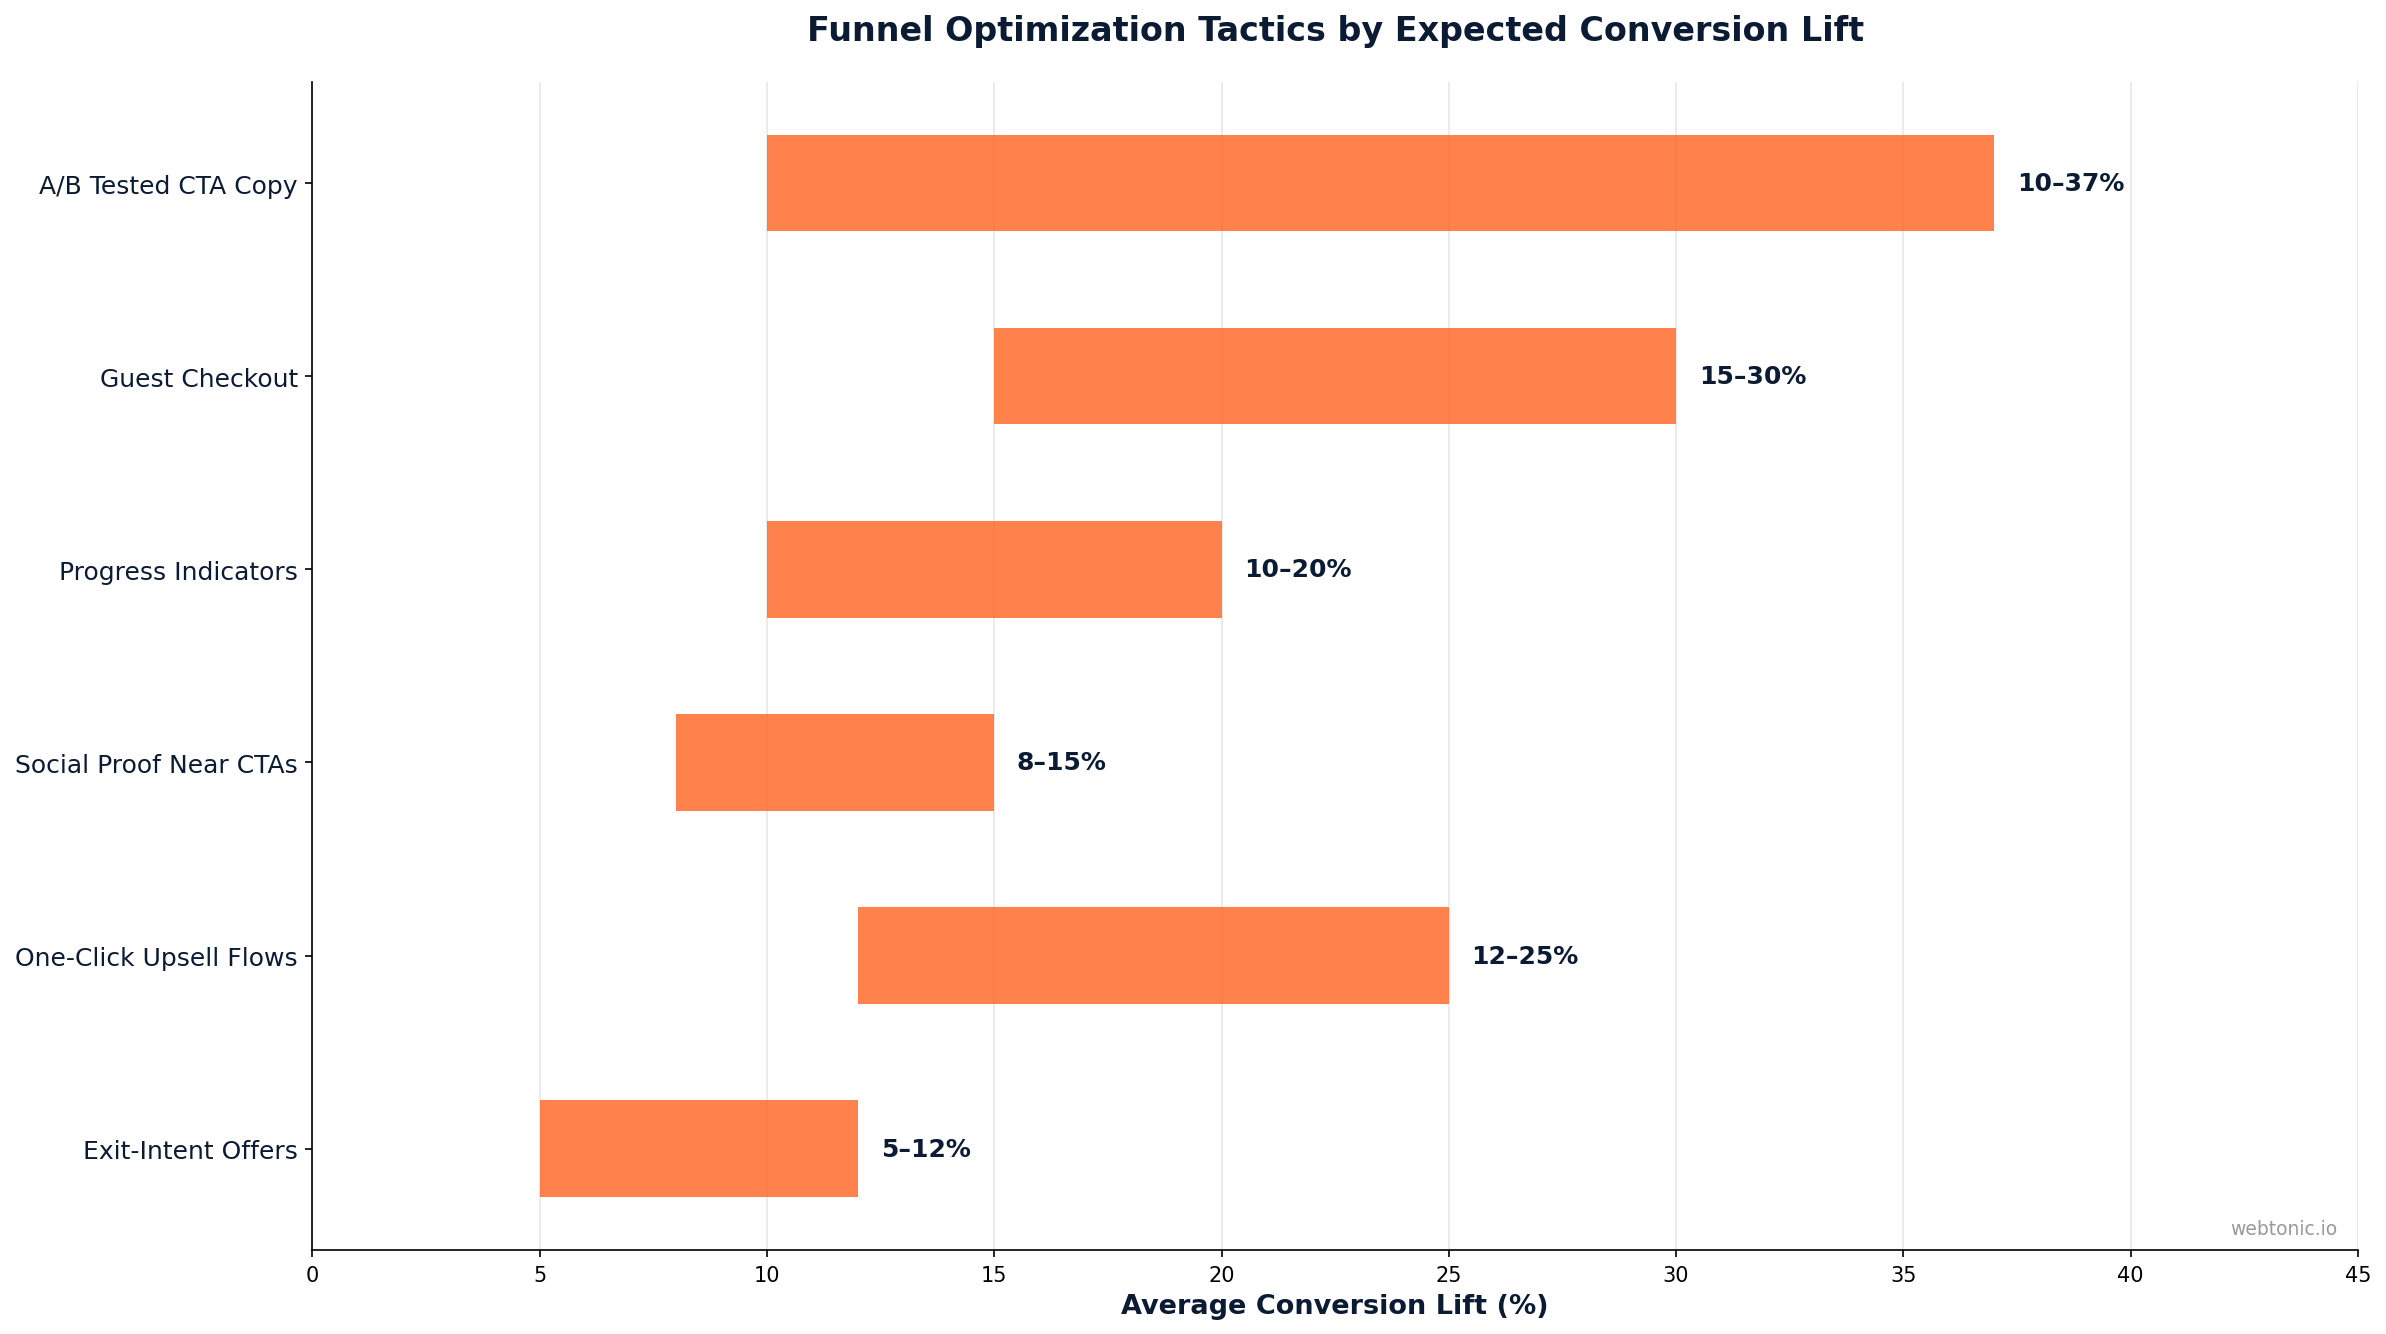
The bottom of the funnel is where conversion rate optimization delivers the fastest ROI. Small changes to checkout flows, CTA placement, and form design compound into significant revenue gains for every product service you sell. According to VWO's 2026 research, top-performing funnels consistently implement:
| Tactic | Average Conversion Lift | Implementation Complexity |
|---|---|---|
| Guest checkout option | +15–30% cart completion | Low |
| Progress indicators on forms | +10–20% form completion | Low |
| Social proof near CTAs | +8–15% click-through | Low |
| One-click upsell flows | +12–25% AOV increase | Medium |
| Exit-intent offers | +5–12% recovery rate | Low |
| A/B tested CTA copy | +10–37% conversion | Low |
Funnel Optimization Tools Worth Considering
The right tools make the difference between guessing and knowing. Your funnel optimization stack should cover four core capabilities: analytics, testing, personalization, and session insights.
- Analytics: Google Analytics 4 (free funnel explorations), Amplitude (product analytics with cohort funnels), Mixpanel (event-based funnel tracking)
- A/B Testing: VWO (visual editor + server-side), Optimizely (enterprise experimentation), DollarPocket (conversion benchmark reports)
- Session Insights: Hotjar (heatmaps + recordings), FullStory (digital experience intelligence), Usermaven (privacy-focused funnel analytics)
- Personalization: Unbounce (AI-powered landing page builder), Dynamic Yield (real-time personalization), HubSpot (CRM-integrated marketing automation)
The critical capability most teams underutilize is funnel segmentation — splitting your funnel by traffic source, device, or audience cohort. Aggregate funnel views mask the real story. Teams with strong data intelligence practices segment routinely. A mobile funnel might convert at 1.2% while desktop converts at 4.8%, making mobile the clear optimization priority. Tools like Amplitude and GA4 handle this natively.
Measuring Funnel Optimization Success
Effective measurement requires tracking both micro-conversions (stage-by-stage progression) and macro-conversions (end-to-end rate). The following KPIs form a complete funnel optimization dashboard:
- Stage conversion rate — Percentage of users advancing from one stage to the next. The most granular and actionable metric.
- End-to-end conversion rate — Overall visitor-to-customer percentage. Industry benchmarks: 3–10% (Kirro, 2026).
- Time-to-conversion — How long the average customer journey takes. Shorter cycles usually correlate with higher conversion rates.
- Cost per acquisition (CPA) — Total marketing + sales cost divided by conversions. Funnel optimization should reduce CPA, not just increase volume.
- Revenue per visitor (RPV) — Revenue divided by total visitors. This captures both conversion rate and AOV improvements simultaneously.
Track these metrics on a weekly cadence and benchmark against your own historical data rather than industry averages alone. As MarketerHire notes, the difference between median (3.2%) and top-quartile (9.7%) landing page performance is not traffic quality — it is funnel execution.
Funnel Analysis: Tracking User Behavior at Every Stage
Effective funnel analysis goes beyond surface-level metrics. It requires mapping user behavior patterns at each funnel stage — from top funnel (TOFU) awareness touchpoints through mid-funnel consideration to bottom funnel (BOFU) conversion actions like making a purchase or signing up for a service.
The best funnel optimization tools — including Google Analytics, Hotjar, and Amplitude — let you track real time user flows and identify exactly where potential customers disengage. When your conversion funnel optimization strategy is grounded in actual user behavior data rather than assumptions, every change you make compounds into measurable revenue gains.
Start by setting up Google Analytics funnel exploration reports that track each stage of your conversion funnel. Layer on heatmaps and session recordings to understand the why behind each drop-off. This combination of quantitative and qualitative data is what separates reactive troubleshooting from proactive sales funnel optimization.
Key behaviors to monitor in your funnel analysis:
- CTA click-through rates — Average CTA click rates of 2–5% are considered healthy. Are your calls-to-action compelling enough to move users from one stage to the next?
- Engagement depth — Do visitors consume enough content before reaching decision points? Pages with over 3 minutes average session duration typically convert at double the rate of quick-bounce pages. Low customer engagement at the top funnel often predicts poor downstream conversion rates.
- Page-level drop-offs — Which specific pages in the customer journey lose the most potential customers?
- LTV correlation — Do customers acquired through certain funnel paths have higher lifetime value than others? Optimize for LTV-weighted conversions, not just volume.
Companies like Netflix and Unbounce have demonstrated that systematic funnel optimization based on behavioral data outperforms intuition-based changes by a wide margin. Unbounce's own platform exists because conversion rate optimization at the landing page stage — a critical funnel stage — delivers outsized returns when done right.
Aligning Sales and Marketing for Full-Funnel Performance
One of the most overlooked aspects of funnel optimization is the disconnect between sales and marketing teams. When sales marketing alignment breaks down, the customer journey becomes fragmented — marketing generates leads that sales considers unqualified, and sales feedback never reaches the marketing team to improve targeting.
A unified funnel optimization process requires both teams to agree on:
- Lead scoring criteria — companies with mature scoring see 50% more sales-ready leads at 33% lower cost — that define when a potential customer is ready for sales outreach
- Shared KPIs that span the entire conversion funnel — not just marketing-owned top-of-funnel metrics or sales-owned close rates
- Feedback loops where sales insights about customer objections inform marketing content and audience targeting
- A shared view of the customer journey with attribution that tracks the impact of every touchpoint on downstream conversion rates
When sales marketing alignment is strong, every product service offering in your funnel benefits from consistent messaging that matches customer expectations. This consistency alone can reduce funnel drop-offs by 15–25% at the MQL-to-SQL handoff — the stage where most B2B funnels hemorrhage potential customers.
Common Funnel Optimization Mistakes to Avoid
Even experienced marketing teams make these errors when they begin optimizing their conversion funnel. Avoid these pitfalls to keep your sales funnel optimization efforts on track and your conversion rate trending upward:
- Optimizing the wrong stage first. Teams often polish the bottom of the funnel (checkout) while ignoring massive drop-offs at the top (landing page). Always fix the biggest leak first — the one with the largest absolute volume of lost users.
- Running too many tests simultaneously. Overlapping A/B tests contaminate results. Run one test per stage, measure to statistical significance (typically 95%), then move on. A dedicated performance creative team can help run structured test programs.
- Ignoring mobile funnels. Mobile traffic often exceeds 60% of total visits but converts at half the desktop rate. Treat mobile as a separate funnel with its own optimization strategies.
- Chasing vanity metrics. Page views and session duration mean nothing if they do not correlate with downstream conversion rates. Focus on metrics that directly tie to revenue.
- Skipping qualitative data. Analytics tells you where people drop off. Session recordings and customer interviews tell you why. Both are required for effective funnel optimization. Explore more optimization insights on the Web Tonic blog.
Building a Data-Driven Funnel Optimization Process
A structured process prevents ad-hoc optimization from creating more problems than it solves. The following framework, proven in a documented case study that achieved 47% revenue lift and 156% ROAS improvement in 90 days, gives you a repeatable system:
- Map your current funnel — Document every step from first touch to final conversion, including micro-conversions like email signups, content downloads, and cart additions.
- Instrument tracking — Ensure every stage transition fires an event in your analytics platform. Use GA4 funnel explorations or Amplitude funnels to visualize drop-offs.
- Benchmark and prioritize — Compare each stage against industry benchmarks (see table above). Calculate the absolute number of lost users at each point. Prioritize by volume × expected improvement.
- Hypothesize and test — Formulate specific hypotheses ("Adding social proof above the CTA will reduce bounce rate by 15%"). Run A/B tests with clear success criteria.
- Iterate and scale — Winners get implemented permanently. Losers get documented. Move to the next highest-impact opportunity. Repeat monthly.
The companies that win at funnel optimization treat it as a continuous process, not a one-time project. Each round of testing generates new data that informs the next round, creating a compounding improvement loop that steadily raises conversion rates across every funnel stage. The best practices outlined above — combined with disciplined funnel analysis and tight sales marketing alignment — form a complete conversion funnel optimization playbook that scales with your business.

Frequently Asked Questions
What is funnel optimization?
Funnel optimization is the systematic process of analyzing your conversion funnel — the path visitors take from first interaction to becoming paying customers — and improving the conversion rates at each stage. It involves identifying drop-offs, testing changes, and iterating based on data to maximize the percentage of users who complete desired actions.
What is a good conversion rate for a sales funnel?
A good end-to-end sales funnel conversion rate is 3–10%, though this varies significantly by industry and business model. B2B funnels typically convert 1–5% from first touch to closed deal, while B2C and ecommerce funnels average 5–15%. The top 10% of landing pages convert at 5.31% or higher, compared to the 2.35% median.
Which funnel stage should I optimize first?
Start with the stage that has the largest absolute number of drop-offs, not the lowest percentage rate. If 10,000 visitors bounce from your landing page but only 200 abandon checkout, the landing page is your highest-impact optimization target — even though checkout abandonment has a higher percentage rate.
How long does funnel optimization take to show results?
Individual A/B tests typically reach statistical significance within 2–4 weeks, depending on traffic volume. A comprehensive funnel optimization program usually shows measurable improvements within 30–60 days, with compounding gains over 90 days. The case study cited above achieved 47% revenue lift within 90 days through systematic, data-driven testing.
What tools do I need for funnel optimization?
At minimum, you need an analytics platform (Google Analytics 4 is free), an A/B testing tool (VWO or Optimizely), and a session insight tool (Hotjar or FullStory). Advanced teams add personalization engines and CRM-integrated marketing automation to tailor the funnel experience to different audience segments to maximize customer engagement throughout the customer journey.
Sources
kirro.io/funnel-conversion-rate-benchmarks
kirro.io/conversion-funnel-optimization
vwo.com/blog/what-is-a-good-funnel-conversion-rate
marketerhire.com/blog/conversion-funnel-optimization
prospeo.io/s/b2b-conversion-rates
delverise.com/blog/b2b-sales-funnel-conversion-rates-benchmarks-2026
marketingltb.com/blog/statistics/sales-funnel-statistics
eyaldror.com/blogs/how-we-used-data-driven-funnels-to-boost-e-commerce
usermaven.com/funnels
support.google.com/analytics/answer/9216061


