



Table of contents
"Avoid ad fatigue" is not a frequency cap - it is a slogan. Platform research from Meta, Nielsen and the IPA all point to a specific range where incremental response starts to bend, and 2026 streaming-ad-load data is making that ceiling harder to control from the advertiser's side alone. This page collects where the actual numbers sit, by platform and objective.
Key Takeaways
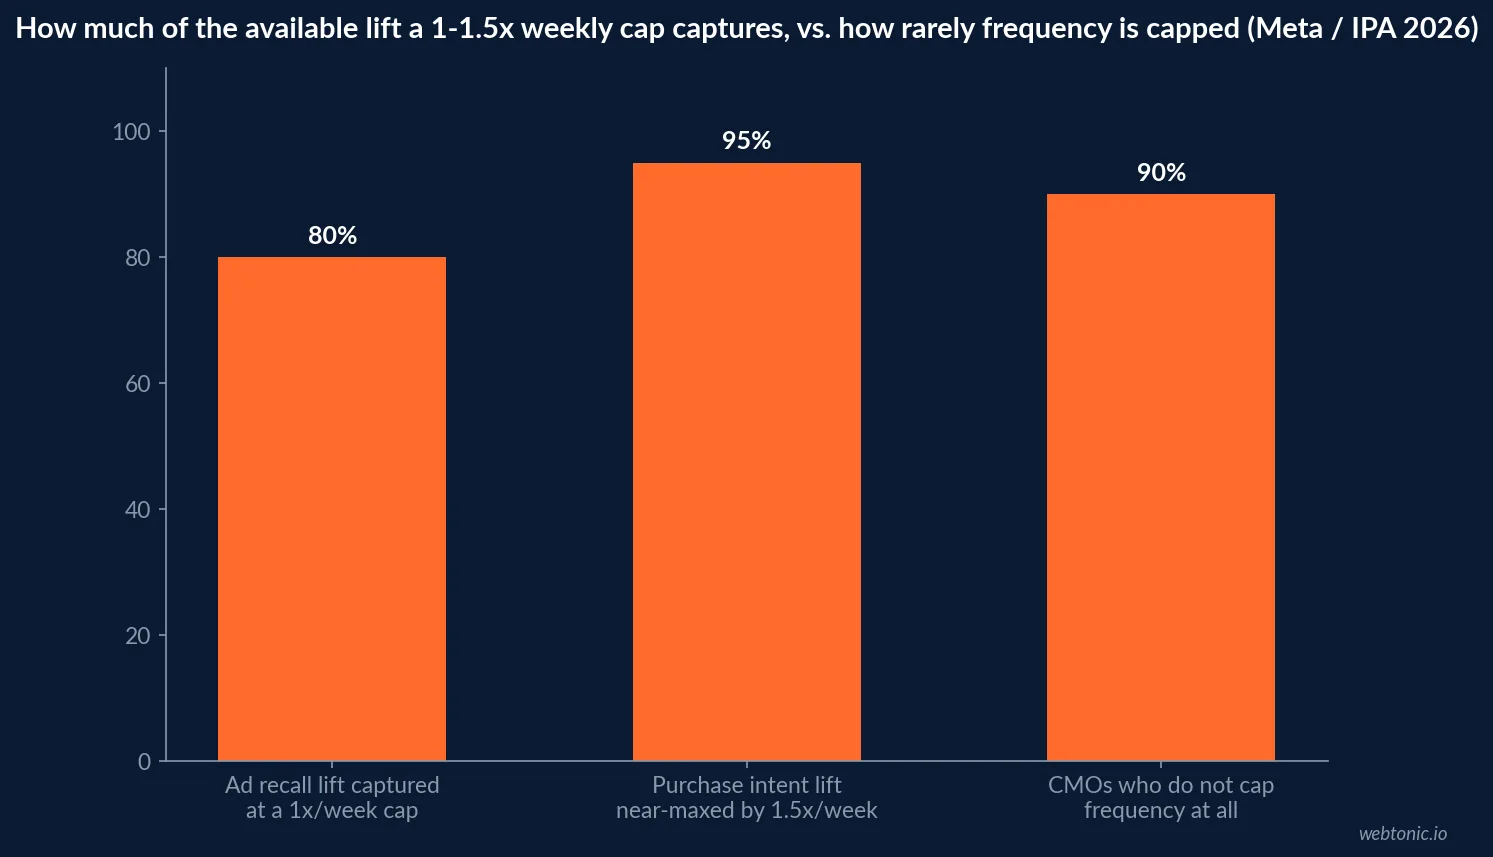
- A frequency cap of 1 per week captures about 80% of ad-recall lift on Meta.
- Purchase-intent lift keeps rising until nearly 1.5 exposures per week.
- Meta's brand-building guidance recommends 2 or more exposures per week for long-term goals.
- CTR decline is commonly reported above roughly 3.5 frequency in a 7-day window.
- Conversion-rate and cost damage is clearer above frequency 5.
- Fewer than half of CMOs surveyed maximize reach before adding frequency, per the IPA.
- Roughly nine in ten CMOs don't cap frequency at all, per the same 2026 IPA report.
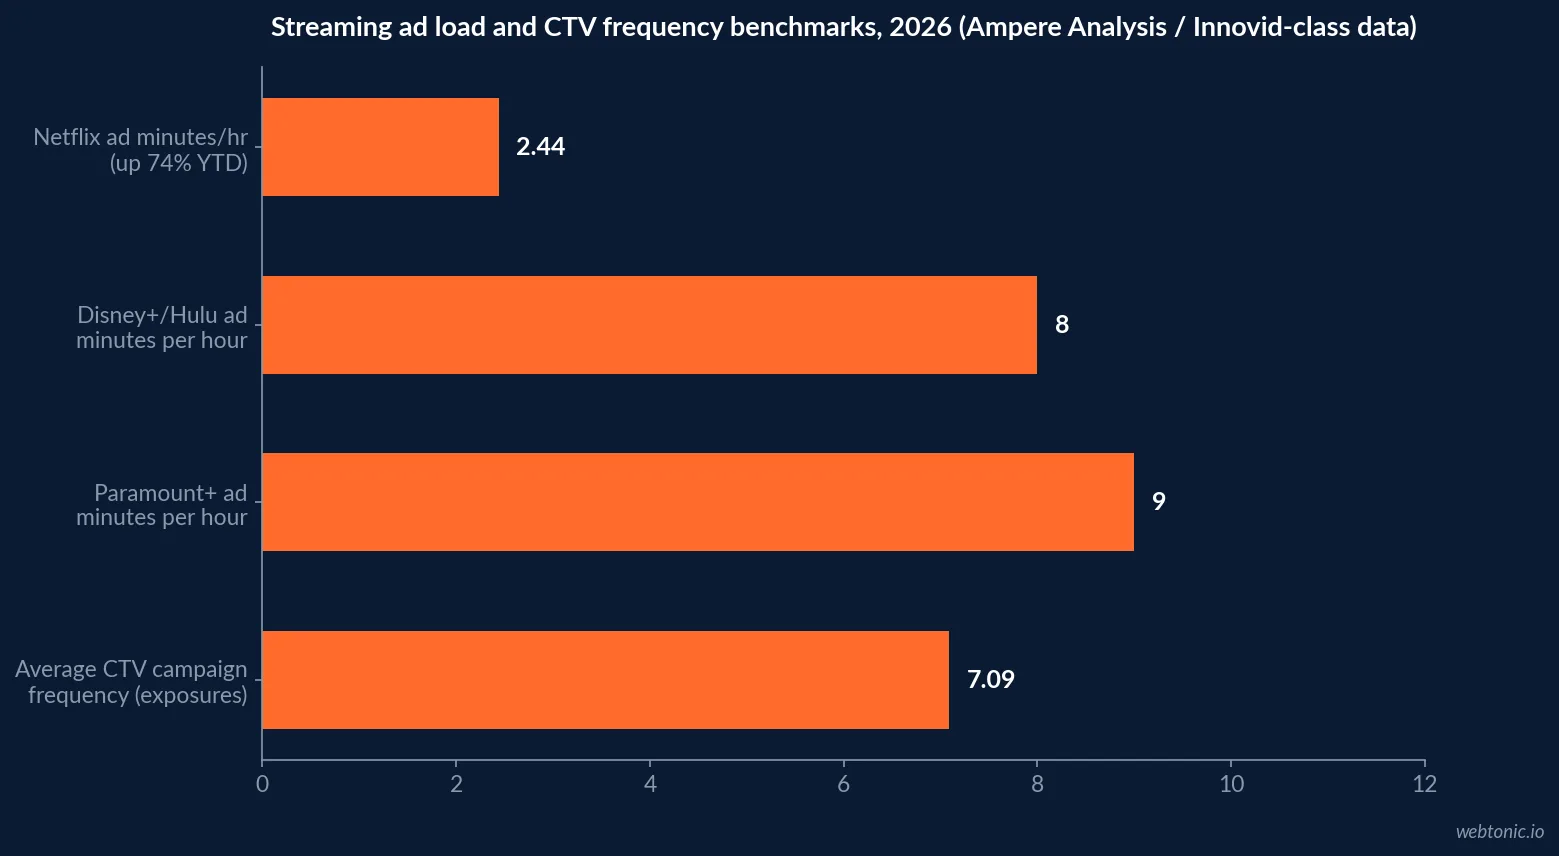
- US streaming ad loads rose 18% between January and August 2026, per Ampere Analysis.
- Netflix's ad minutes per hour rose 74% over the same period.
- Average CTV campaign frequency was measured at 7.09 exposures in a recent benchmark.
- Google Ads frames frequency capping as advertiser-set, not a fixed platform number.
- Common practitioner anchors run 2 to 3 exposures/week for Display, 3 to 5 for video recall.
- Layering CTV on linear can lift unique reach by up to 32%, reducing repeat exposure.
- Nielsen research finds reach delivers more ROI than added frequency once flattening starts.
Where Meta's own research says the recall curve bends
Meta for Business's effective-frequency research is the most-cited source behind most published Meta frequency caps: it found that a cap of roughly 1 exposure per week captures about 80% of total available ad-recall lift, while lift in purchase intent kept climbing until close to 1.5 exposures per week before slowing meaningfully. Meta's broader guidance on digital advertising's role in long-term brand growth separately recommends aiming for a frequency of two or more exposures per week for campaigns built around brand-building rather than short-term recall, which is a materially different target than the 1x recall figure.
The gap between those two numbers is the most common source of confusion in frequency-cap settings: a recall-optimized campaign and a brand-building campaign are optimizing for different curves, and copying one campaign's cap onto the other objective produces either wasted spend or under-exposure.
| Meta frequency benchmark | Exposure level | What it optimizes for | Source |
|---|---|---|---|
| Recall lift capture point | ~1x per week | 80% of available recall lift | Meta for Business |
| Purchase intent lift ceiling | ~1.5x per week | Near-maximal purchase intent lift | Meta for Business |
| Brand-building recommendation | 2x+ per week | Long-term sales through brand-building | Meta for Business |
| Reported CTR decline threshold | ~3.5x in 7 days | Signals creative fatigue setting in | Practitioner analyses of Meta data |
| Reported conversion/cost damage threshold | ~5x in 7 days | Materially worse cost efficiency | Practitioner analyses of Meta data |
What the IPA's 2026 effectiveness research says about capping frequency at all
The IPA's 2026 "Go Big or Go Home" report, written by Les Binet and Will Davis, is blunt about the gap between effectiveness evidence and practitioner behavior: fewer than half of surveyed CMOs actually maximize reach before layering on frequency, and roughly nine in ten do not cap frequency at all. That runs against the IPA's long-standing effectiveness evidence, built over more than a decade of Databank analysis, that reach against a broader audience typically delivers more incremental value than repeated exposure to an audience already reached - once a campaign's reach curve has started flattening, the marginal exposure is buying frequency, not audience.
Nielsen's own reach-efficiency research reaches a similar conclusion from a different data source: it found that campaigns without deliberate reach management see average frequency climb from four or fewer exposures on smaller campaigns to six or more once impression volume scales past 15 million, without a proportional gain in unique audience reached.
| Effectiveness finding (2026) | Figure | Source |
|---|---|---|
| CMOs who maximize reach before frequency | Under half | IPA, Binet & Davis |
| CMOs who don't cap frequency at all | ~90% | IPA, Binet & Davis |
| Frequency at under 15M impressions | 4 or fewer, typical | Nielsen reach-efficiency research |
| Frequency once campaigns exceed 15M impressions | 6 or more, typical | Nielsen reach-efficiency research |
| Share of marketing budget IPA/Medialab estimate misallocated to activation | 30%-40% | IPA / Gartner 2025 cited in report |
Streaming ad load is raising exposure risk from the platform side
Frequency management is not only an advertiser setting anymore. Ampere Analysis data, reported via Android Authority, found that average ad loads across major US streaming services rose 18% between January and August 2026, with Netflix's measured ad minutes per hour up 74% over the same window even while remaining the lowest-load service in the comparison. Paramount+ now runs roughly nine ad minutes an hour, with Disney+ and Hulu in the 7.5-to-8.5-minute range.
A separate CTV benchmark referencing Innovid's 2025 measurement put average campaign frequency at 7.09 exposures across a footprint of more than 95 million US households, well above the 1x-to-2x range Meta's research ties to maximal recall lift. As overall platform ad load rises, an advertiser's own frequency cap controls only their share of exposure - the household's total ad exposure across every advertiser on that platform keeps climbing regardless.
Where Google Ads leaves the number up to the advertiser
Google Ads Help documents frequency capping as a setting the advertiser configures at the campaign, ad group or ad level for Display and video campaigns, and explicitly notes that only viewable impressions count toward the cap for Display - it does not publish one universal recommended number. Practitioner guidance built on top of that framework commonly anchors 2 to 3 exposures per week for Display and Demand Gen campaigns, and 3 to 5 per week for video campaigns built around recall, then adjusts from the account's own frequency-distribution reporting after roughly two weeks of delivery data.
The practical difference from Meta's framework is that Google Ads treats the cap as a delivery control to be tuned per account, while Meta publishes a specific researched curve advertisers can start from directly - meaning a Google Display cap benefits more from an early testing window than a Meta cap does.
| Platform / format | Common 2026 frequency anchor | Basis |
|---|---|---|
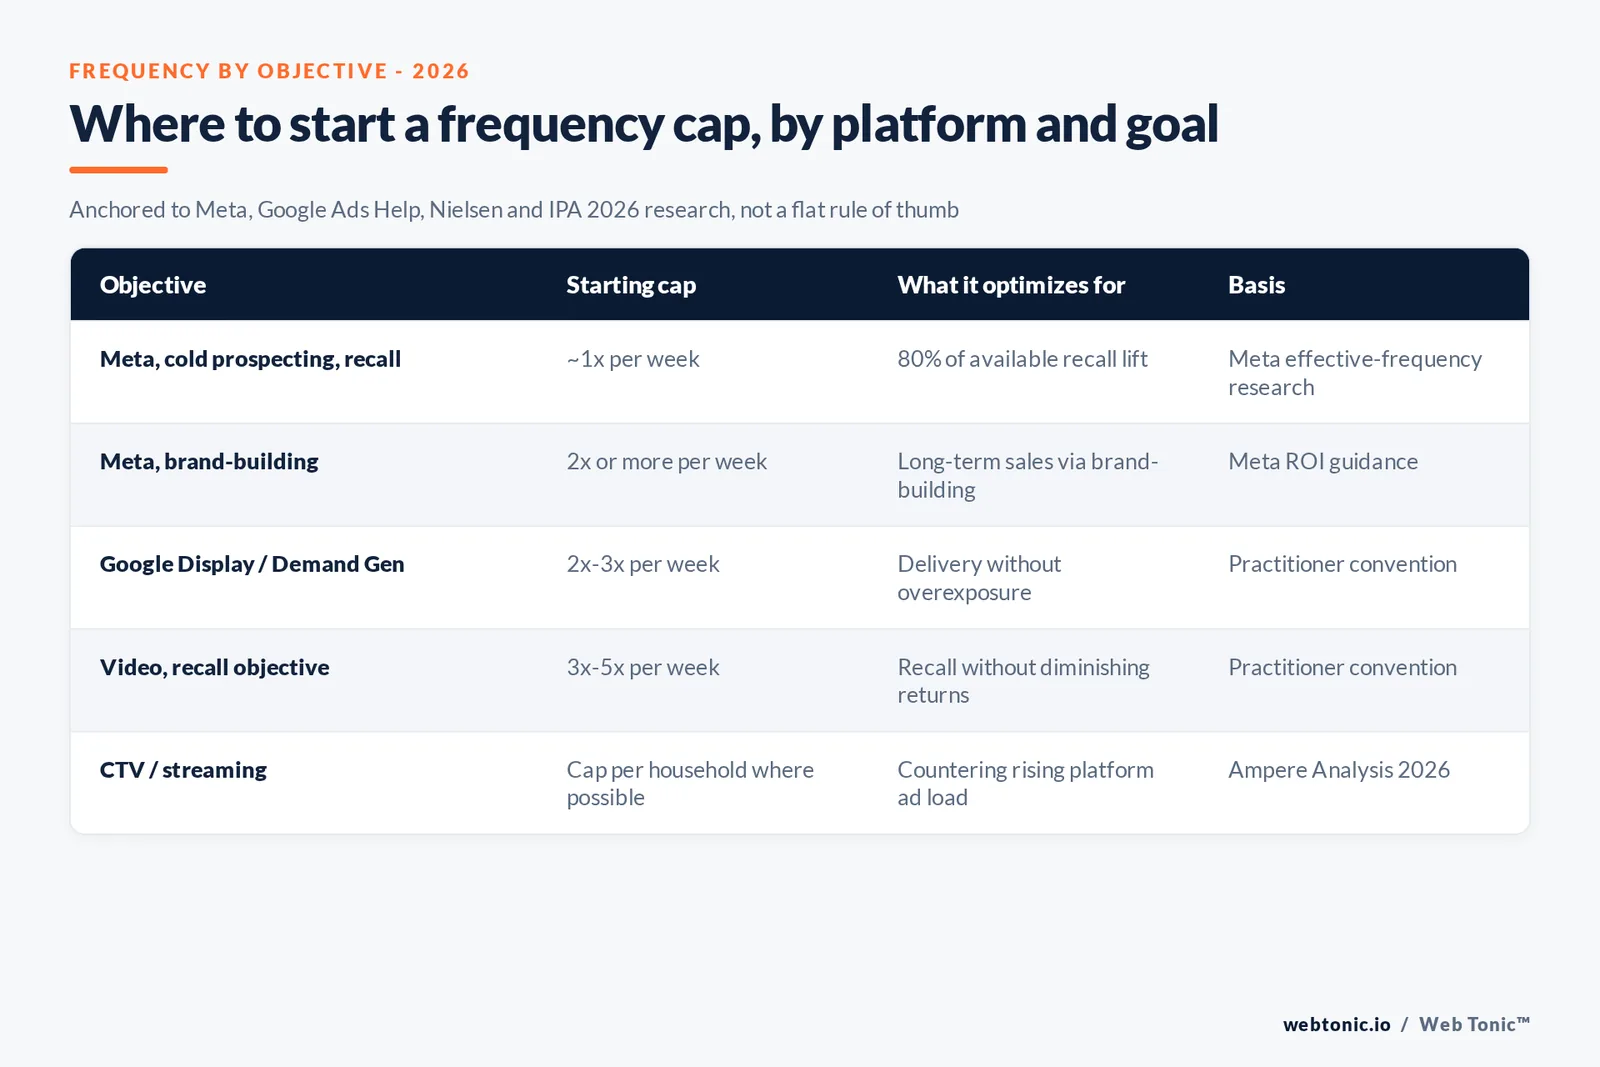
| Meta, recall-optimized | ~1x per week | Meta effective-frequency research |
| Meta, brand-building | 2x+ per week | Meta long-term brand growth guidance |
| Google Display / Demand Gen | 2-3x per week | Practitioner convention, no fixed platform number |
| Video, recall objective | 3-5x per week | Practitioner convention |
| CTV, measured average | ~7.09x per campaign | Innovid-class CTV benchmark |
What the academic wear-out research adds that platform data misses
Platform-reported frequency curves are built from short campaign windows; the longer-run academic literature on advertising repetition adds a nuance those windows miss. A widely-cited meta-analysis by Schmidt and Eisend, published in the Journal of Advertising, synthesizing decades of repetition studies, confirms both a wear-in effect (early exposures building measurable positive response) and a wear-out effect (response declining past a threshold that varies by creative and category) - the inverted-U shape practitioners describe informally is the same pattern the academic literature has documented since the 1970s, not a new phenomenon specific to social platforms.
The practical takeaway is that a frequency cap is a proxy for creative wear-out, not the cause of it. A cap set too low on genuinely fresh, high-relevance creative sacrifices real wear-in gains; the same cap applied to fatigued creative is masking a creative problem the cap alone cannot fix.
| Frequency research layer | What it measures | Key finding |
|---|---|---|
| Meta effective-frequency data | Recall and purchase-intent lift by weekly exposure | 80% of recall lift by 1x/week |
| Nielsen reach-efficiency research | Frequency creep as impression volume scales | 6x+ typical past 15M impressions |
| IPA Databank / Binet & Davis | Reach vs. frequency allocation by CMOs | ~90% run uncapped frequency |
| Schmidt & Eisend meta-analysis | Wear-in/wear-out across decades of studies | Inverted-U pattern confirmed academically |
| Ampere Analysis streaming data | Platform-level ad load growth | +18% ad load Jan-Aug 2026 |
Layering channels to manage exposure instead of just capping it
Because a single-platform frequency cap cannot control a household's total ad exposure across every channel it consumes, media plans increasingly manage frequency at the plan level rather than the platform level. Layering CTV on top of a linear TV plan has been reported to lift unique reach by up to 32% compared with linear alone - the same total budget reaching more unique households rather than repeating exposure to the same ones, which is the reach-over-frequency principle the IPA's research keeps re-confirming applied across channels rather than within one.
Our performance creative practice builds frequency and reach curves per channel into media plans directly, rather than relying on a single platform's default cap to manage exposure across an entire plan.
Where this leaves a 2026 frequency setting
The honest range depends on objective and platform: roughly 1x a week for Meta recall, 2x or more for Meta brand-building, 2 to 3x for Google Display, 3 to 5x for video recall, and materially higher and less controllable exposure on CTV as platform ad loads keep climbing through 2026. None of those numbers replace testing your own account's frequency-distribution reporting, but they are a defensible starting point instead of guessing at "avoid fatigue."
If frequency and reach planning across channels is the gap in your current media plan, talk to us, see how our creative and media practice approaches cross-channel exposure management, or read how we scope Meta Ads management around fatigue and frequency signals.
Quick reference: setting a first frequency cap by objective
Use the objective, not the platform default, to pick a starting cap, then adjust from your own frequency-distribution report after roughly two weeks of live delivery data.
| Campaign objective | Suggested starting cap | Basis |
|---|---|---|
| Meta, cold prospecting, recall-focused | ~1x per week | Meta effective-frequency research |
| Meta, brand-building, long-term sales | 2x+ per week | Meta long-term ROI guidance |
| Meta or Google, retargeting | 3x-5x per week | Practitioner convention, higher intent audience |
| Google Display / Demand Gen, cold | 2x-3x per week | Practitioner convention |
| Video, recall objective | 3x-5x per week | Practitioner convention |
| CTV / streaming | Cap per household where available | Platform ad load rising 18% in 2026 |
Frequently Asked Questions
What frequency cap should a Meta prospecting campaign use?
Meta's own effective-frequency research found that a cap of roughly 1 exposure per week captures about 80% of the total available ad-recall lift, while purchase-intent lift keeps rising until close to 1.5 exposures per week before slowing. Meta's broader brand-building guidance recommends aiming for a frequency of two or more exposures per week for campaigns built to drive long-term brand outcomes, which is a different target than the recall-optimized 1x figure - the right number depends on whether the campaign objective is recall or purchase intent.
At what frequency does response start to decline on Meta?
Multiple practitioner analyses of Meta's own performance data report measurable click-through decline once frequency in a rolling 7-day window climbs above roughly 3.5, with conversion rate and cost efficiency showing clearer damage above 5. Retargeting audiences tolerate materially higher frequency than cold prospecting audiences before the same decline sets in, because the audience has already shown intent.
What does the IPA's effectiveness research say about frequency?
The IPA's 2026 "Go Big or Go Home" report, from Les Binet and Will Davis, found that fewer than half of CMOs surveyed actually maximize reach before adding frequency, and roughly nine in ten do not cap frequency at all - despite the IPA's long-standing effectiveness evidence that reach delivers more incremental value than repeated exposure to an already-reached audience once a campaign's reach curve starts flattening.
Are streaming and CTV ad loads increasing frequency exposure in 2026?
Yes, measurably. Ampere Analysis data reported via Business Insider and Android Authority found that average ad loads across major US streaming services rose 18% between January and August 2026, with Netflix's ad minutes per hour up 74% over the same period. Higher ad load per hour of content raises structural exposure risk independent of any single advertiser's own frequency cap, because the platform's total ad inventory per session is what determines how often the same household sees repeated creative.
Does Google Ads recommend a specific frequency cap?
Google Ads Help does not publish one universal number; it frames frequency capping as a campaign-level or ad-group-level control the advertiser sets rather than a fixed platform recommendation. Practitioner guidance built on top of that framework commonly anchors Display and Demand Gen campaigns around 2 to 3 exposures per week and video campaigns built for recall around 3 to 5 per week, then adjusts from the account's own frequency-distribution reporting after the first two weeks of delivery.
Sources
Meta for Business - Effective frequency research
Meta for Business - Digital advertising's role in long-term brand growth
IPA - Go Big or Go Home, Les Binet and Will Davis, 2026
Nielsen - Reach efficiency research
Google Ads Help - Use frequency capping
Android Authority, citing Ampere Analysis - 2026 streaming ad load data
CTV ad repetition benchmark, citing Innovid's 2025 CTV data
Schmidt & Eisend - Advertising repetition meta-analysis, Journal of Advertising


