Table of contents
X ads reach 544 to 600 million people at a $0.74 to $0.85 CPC — cheaper than Meta — yet only 12% of marketers say they trust the platform and 4% call it brand safe. That contradiction is the whole story for franchise brands in 2026: real scale and cheap clicks against a reputation risk no multi-unit system can ignore. Here is the data, and where X still earns a line in a franchise media plan.
Key Takeaways
- X ads reach 544–600 million people, about 7.1% of the global population, with 237.8–250 million monetizable daily active users.
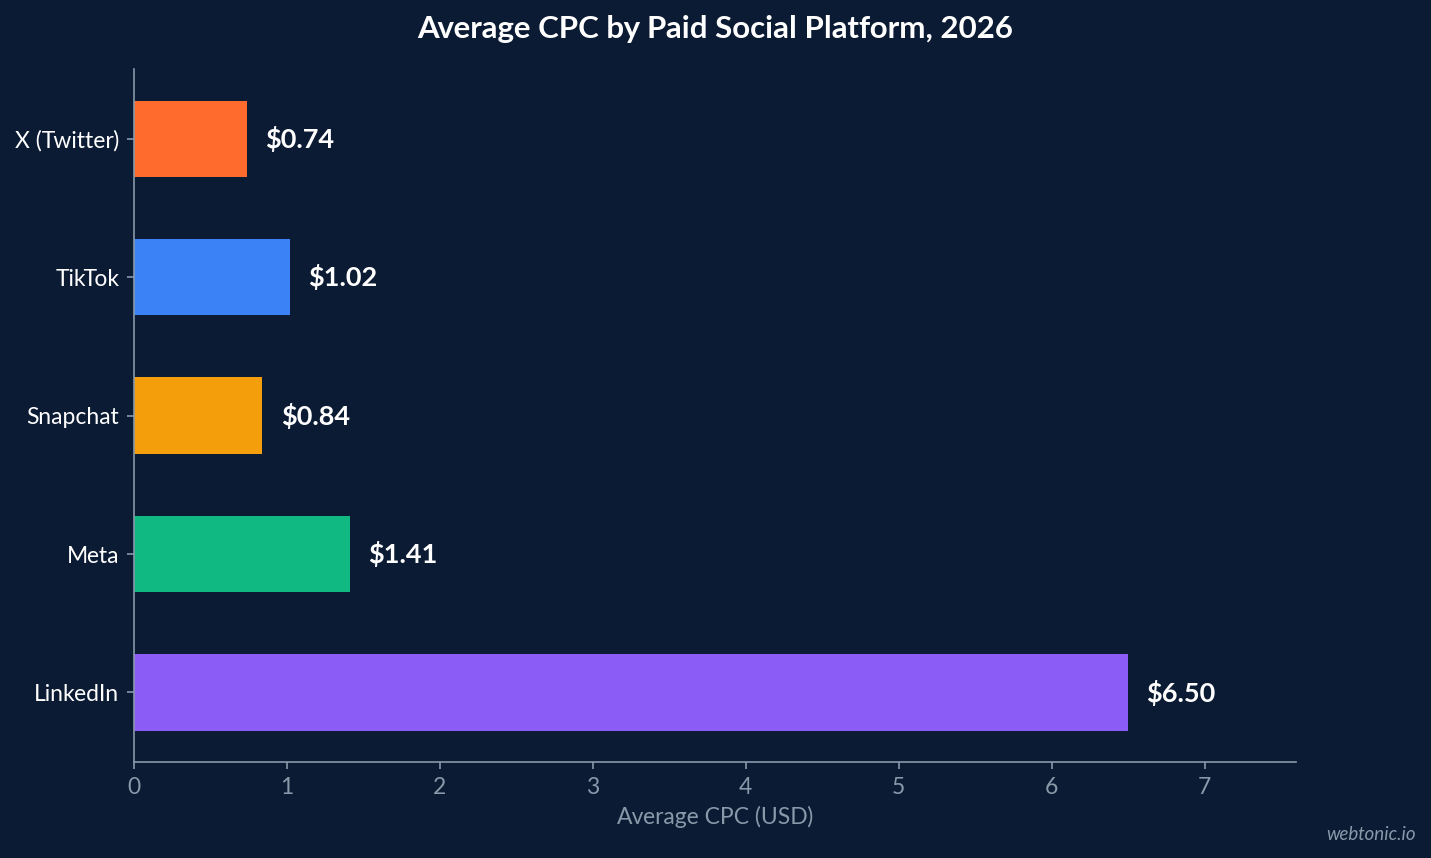
- Average CPC is $0.74–$0.85 and CPM $5.20–$6.46 in benchmark data, below Meta on both metrics.
- Only 12% of marketers trust X ads and 4% consider the platform brand safe, while 26% planned to cut spend — the largest recorded pullback from any major platform.
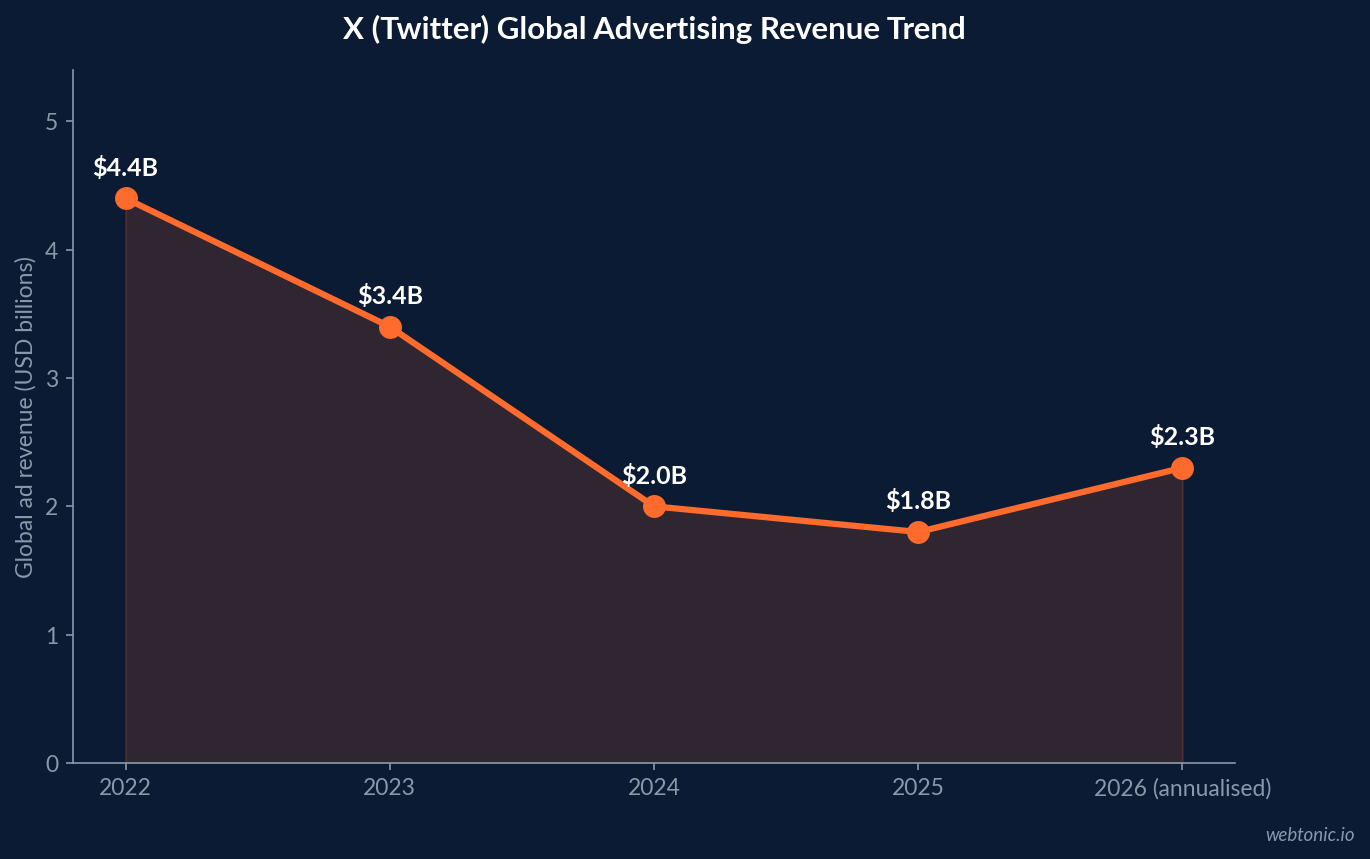
- Q1 2026 revenue reached $752 million, up 17% year over year, after ad revenue fell roughly 54% from pre-acquisition levels.
- Video ads deliver 3–4x higher engagement than static images with 40–60% completion rates and 40–50% lower cost per engagement.
- Median X ROAS for service businesses is 2:1 to 2.5:1, against 3:1 to 6:1 for Google Search.
- The audience is 60.9% male, 68% urban and 42% college-educated, which suits franchise recruitment better than suburban consumer offers.
X Ads Cost Benchmarks at a Glance
Benchmark sources differ on method — some average managed accounts, others aggregate platform-wide reporting — so we show the range rather than one number.
| Metric | 2026 benchmark | Source |
|---|---|---|
| Average CPC | $0.74 (vs $1.41 on Meta) | HeyOz / WebFX |
| Average CPC (alt. benchmark) | $0.85 | Pryani |
| CPC range, managed accounts | $0.80–$2.50 | CO Consulting |
| Average CPM | $5.20–$6.46 (vs $7.19 Facebook) | HeyOz / WebFX |
| CPM range, tight targeting | $8–$15 | CO Consulting |
| Median cost per engagement | $0.13 | The Global Statistics |
| Average CTR | 0.86% platform-wide; 1–3% promoted posts | The Global Statistics |
| Conversion rate | 2.1% | Pryani |
Additional 2026 aggregations put CPC between $0.50 and $2.00, cost per engagement between $1.50 and $4.00 for campaign-level buys, and CTR at 1–2% overall with 1–3% on promoted posts (SQ Magazine). For franchise planners, the practical read is that X clicks are cheap enough that media cost will never be the reason a campaign fails — the funnel will be.
Reach and Audience: What Franchise Brands Are Buying
X reports 611 million monthly active users in 2026, up 4.3% year over year, with the United States its largest market at 95.4 million MAU (15.6% of the total), followed by Japan at 72.3 million (Searchlab 2026). The advertising-reachable pool is 544 to 600 million people, about 7.1% of the global population, with 237.8 to 250 million monetizable daily active users (The Global Statistics).
The composition is what should drive franchise targeting decisions. The platform is 60.9% male, 68% urban — the highest share of any major social platform, 42% college-educated and 34% employed in the knowledge economy. The largest age band is 25–34 at 29.6%, followed by 18–24 at 23.1%. Engagement is concentrated: 47% of users are lurkers, only 8% post daily, and 20% of users generate 98% of all posts.
| Audience signal | 2026 figure | Franchise implication |
|---|---|---|
| Monthly active users | 611 million (+4.3% YoY) | Scale is not the issue |
| Ad-reachable audience | 544–600 million (7.1% of world population) | Sufficient for national layers |
| US monthly users | 95.4 million | Workable for national franchise development |
| Gender split | 60.9% male / 39.1% female | Weak fit for female-skewed consumer categories |
| Urban share | 68% of users | Better for urban QSR and service concepts |
| Largest age band | 25–34 (29.6%) | Aligns with franchisee prospect age |
| Mobile share of traffic | 82% | Vertical, mobile-first creative only |
| Average daily time on platform | 34 minutes (−8% vs 2022) | Frequency caps matter |
Distribution mechanics also changed: the algorithmic "For You" feed now generates 78% of all impressions, video views reached about 8.2 billion per day, up 42% year over year, and Communities have grown to more than 840,000 active groups with 126 million members, generating 2.7x more engagement than the general feed. For a franchise brand, Communities and real-time moments are the two places organic and paid can compound.
The Brand-Safety and Advertiser-Confidence Problem
No franchise media plan should include X without pricing in reputation risk. Only 12% of marketers trust X ads — down from 22% in 2022 — and just 4% believe the platform is brand safe, against 39% for Google Ads. 26% of marketers planned to cut X spend, the largest recorded pullback from any major global platform, and X's share of worldwide digital ad spend is now roughly 0.2%, against 14.6% for Facebook and 7.1% for TikTok.
The financial picture is stabilising rather than recovering. Ad revenue reached $1.8 billion in 2025, up 7% year over year but far below pre-acquisition levels (True Interactive), and Q1 2026 revenue was $752 million, up 17% year over year, with advertising now 65–68% of total revenue — down from 84–90% historically — after a roughly 54% decline in ad revenue since the acquisition. For franchisors, the governance answer is usually a short brand-safety exclusion list, a central-only buying rule, and no franchisee-level self-serve access.
Performance: Creative Format and ROAS Ranges
The single biggest lever on X in 2026 is format. Video ads see engagement rates 3–4x higher than static image ads, video completion rates of 40–60%, click-through rates 2–3x higher, and cost per engagement 40–50% lower when campaigns move from image to video (CO Consulting). Text-only and static link posts are effectively dead inventory.
Returns depend on funnel strength more than targeting. Across service businesses, X campaigns land between 1.5:1 and 4:1 ROAS with a median around 2:1 to 2.5:1 — below Google Search's typical 3:1 to 6:1. Categories built on trust and relationships (real estate, advisory, capital raising) perform at the top of that range, which maps neatly to franchise development and franchisee recruitment rather than consumer promotions. The advertiser base is also broader than the brand-safety headlines suggest: 1.7 million ad campaigns ran on X in 2024 across more than 250,000 advertiser accounts (SocialNexis), so the inventory is competitive enough to be worth a controlled local test.
| Use case | Expected ROAS / outcome | Verdict for franchise systems |
|---|---|---|
| Franchisee recruitment | 2.5:1–4:1 in trust-led categories | Best fit — decision-maker audience |
| National brand and real-time moments | Reach at $5.20–$6.46 CPM | Good fit — cheap incremental reach |
| Local consumer offers | 1.5:1–2.5:1 | Secondary to Meta and TikTok |
| Customer service and reputation | Not a media metric | Strong fit — 31% of interactions via DM |
| Local store traffic | 1–3% promoted-post CTR | Test only, with tight geo-targeting |
Attribution is the operational catch. X's API limits mean franchise teams need strict UTM discipline and CRM integration to see true revenue impact — otherwise the channel gets credited by last click and cut for the wrong reason. This is exactly the plumbing our data intelligence team builds before we recommend scaling any secondary channel.
Where X Fits a 2026 Franchise Media Mix
Franchise development budgets are large — average development budgets run in the hundreds of thousands of dollars per brand, with roughly a third now going digital, and franchise systems continue to reallocate spend toward channels with measurable lead attribution (Marketing LTB). Within that mix, the honest recommendation for X is a capped, centrally managed slice:
- Cap X at 3–7% of paid social until measured ROAS clears 2:1 on your own data.
- Buy centrally, never franchisee self-serve — the 4% brand-safety confidence figure is a governance risk, not a media one.
- Lead with video for the 3–4x engagement and 40–50% lower cost per engagement.
- Point spend at recruitment first, where the audience's 42% college-educated, 34% knowledge-economy profile actually matches the buyer.
- Use Communities and real-time moments for the 2.7x engagement premium over general feed placements.
- Enforce UTM and CRM tracking before the first dollar, given API attribution limits.
- Re-evaluate quarterly against the $752 million Q1 2026 revenue trajectory and your own brand-safety monitoring.
Compared with the channels doing the heavy lifting, X is a rounding error in most franchise plans — but a cheap, testable one. Brands rebalancing budget across paid social and search can start from our Meta Ads benchmarks and the 2026 Facebook Ads cost breakdown.
Frequently Asked Questions
Is X (Twitter) still worth advertising on for franchise brands in 2026?
For most franchise systems X is a supporting channel, not a core one. It offers genuinely cheap inventory — around $0.74 to $0.85 CPC and $5.20 to $6.46 CPM in benchmark data, below Meta on both — and 544 to 600 million ad-reachable users. But only 12% of marketers say they trust X ads and only 4% consider the platform brand safe, which is why franchise brands typically cap X at a single-digit share of paid social spend and use it for real-time, recruitment and reputation plays rather than local lead volume.
What are the average CPC and CPM for X ads in 2026?
Benchmarks cluster tightly: $0.74 CPC in WebFX's 2026 dataset, $0.85 in another 2026 benchmark set, and a wider $0.80 to $2.50 range from agency-managed accounts depending on audience size and seasonality. CPM lands at $5.20 to $6.46 in benchmark data and $8 to $15 for tightly targeted agency campaigns. Median cost per engagement is around $0.13, and promoted-post CTR runs 1% to 3% against a platform-wide 0.86% average.
What ROAS should a franchise brand expect from X ads?
Agency data on service businesses puts X ROAS between 1.5:1 and 4:1, with the median around 2:1 to 2.5:1 — below Google Search at 3:1 to 6:1 but usable when the funnel is strong. Returns concentrate in categories that rely on trust and relationships, so franchise development and franchisee recruitment campaigns tend to outperform consumer offers, and the deciding variable is almost always landing page and follow-up quality rather than media cost.
Who can a franchise brand actually reach on X?
X reports 611 million monthly active users in 2026, with 544 to 600 million ad-reachable — about 7.1% of the global population — and 95.4 million monthly users in the United States. The audience skews 60.9% male, 68% urban, 42% college-educated, with 25 to 34 the largest age band at 29.6%. That profile suits franchise recruitment, B2B service franchises and urban quick-service concepts better than suburban family-oriented categories.
What creative works best for franchise campaigns on X?
Video. Agency reporting for 2026 shows video ads on X producing 3 to 4x higher engagement than static images, video completion rates of 40% to 60%, click-through rates 2 to 3x higher, and cost per engagement falling 40% to 50% when campaigns move from image to video. Video views on the platform reached about 8.2 billion per day, up 42% year over year, so the algorithm is actively distributing motion over static or text-only creative.
Sources
The Global Statistics — X (Twitter) Advertising Statistics 2026
Searchlab — X (Twitter) Statistics 2026
HeyOz — Are X (Twitter) Ads Worth It in 2026?
CO Consulting — X Ads in 2026: When They Pay Back
SQ Magazine — Twitter (X) Statistics 2026
Pryani — X (Twitter) Ads: 2026 Benchmarks
True Interactive — Where Does X Stand with Advertisers in 2026?
SocialNexis — X (Twitter) Statistics 2026
Marketing LTB — Franchise Marketing Statistics 2026