



Table of contents
Franchises with consistent branding across all locations see up to 23% higher revenue than those with fragmented visual identities, making brand management one of the highest-ROI investments in the franchise model. Below are 47+ statistics that reveal how branding, logo design, and visual consistency shape franchise performance in 2026.
Key Takeaways
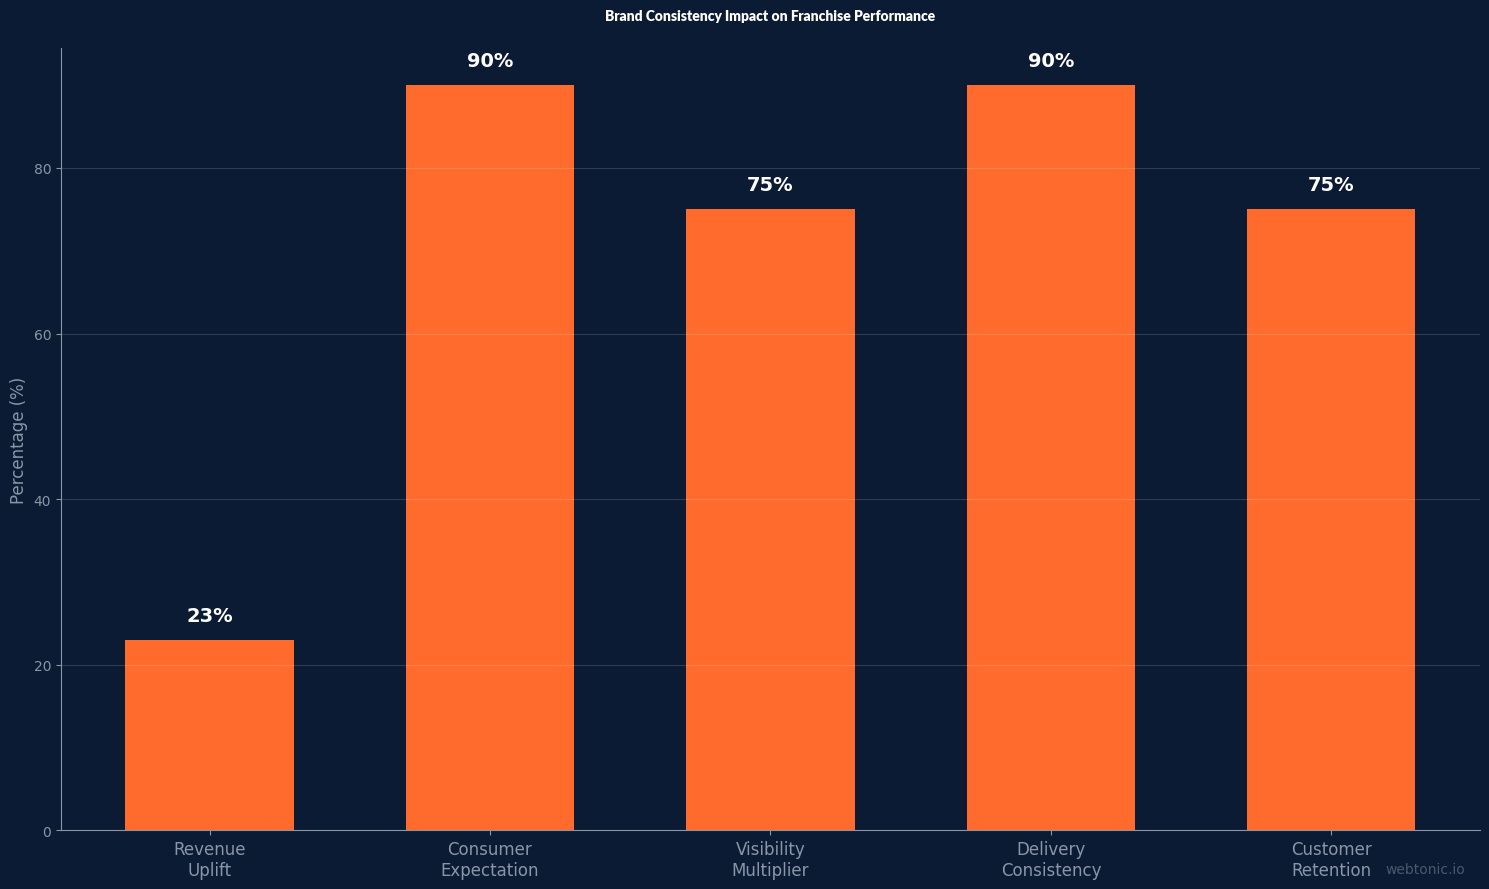
- Consistent branding across channels increases revenue by up to 23%, with 90% of consumers expecting uniform experiences across all touchpoints.
- 70% of franchisees cite brand recognition as their top competitive advantage, and top-100 franchise brands average $500 million in brand value.
- Logo redesigns generate a 20–30% sales uplift in the first year, while full rebrands deliver an average 21% revenue lift within three years.
- The global branding design market is projected to reach $72.1 billion by 2032, growing at a 4.6% CAGR from $50.3 billion in 2024.
- Franchises achieve 90% consistency in product and service delivery compared to 65% for independent businesses.
Franchise Brand Value at a Glance
Brand equity is the single largest intangible asset most franchise systems own. The numbers below quantify just how much value sits inside the brand itself — and why franchisors guard it through strict guidelines, regular audits, and structured compliance programs. For franchise buyers evaluating an investment, brand value is often the primary differentiator between a franchise opportunity and an independent startup.
| Metric | Value | Source |
|---|---|---|
| Avg. brand value, top-100 franchise brands | $500 million | worldmetrics.org |
| Consumers recognizing at least one franchise brand | 85% | worldmetrics.org |
| Franchisees citing brand recognition as #1 advantage | 70% | worldmetrics.org |
| Customer retention rate (franchise vs. independent) | 75% vs. 55% | worldmetrics.org |
| Franchise revenue from repeat customers | 80% | worldmetrics.org |
| Franchises reporting profitability within 2 years | 89% | worldmetrics.org |
| Median franchise revenue per year (593 brands) | $675,394 | frandera.com |
| Average franchisee annual income | $82,000 | worldmetrics.org |
| Franchises generating $500K+ in annual revenue | 71% | worldmetrics.org |
Data compiled from WorldMetrics and Frandera. The 20-point retention gap between franchised businesses (75%) and independents (55%) highlights how established brand trust translates directly into recurring revenue — an advantage that compounds as the franchise system matures.
How Brand Consistency Drives Franchise Revenue
Brand consistency is not a branding buzzword — it is a measurable revenue lever. When every location delivers the same visual identity, messaging, and customer experience, the entire system benefits from compounding brand recognition and consumer trust. The statistics below quantify the financial impact of maintaining — or failing to maintain — a unified brand across all franchise touchpoints.
- Consistent branding across channels increases revenue by up to 23% (TechRT). This revenue lift applies across all customer acquisition channels — from paid advertising to organic search to in-store foot traffic.
- 90% of consumers expect consistent experiences across all brand touchpoints, from signage and packaging to social media and in-store interactions (TechRT).
- Brands with consistent messaging see 3–4× higher visibility than fragmented competitors in both organic search results and paid advertising impressions (TechRT).
- Franchises achieve 90% consistency in product and service delivery vs. 65% for independents — the structured systems that franchises use to enforce standards create a measurable quality gap (WorldMetrics).
- Franchisees with customer loyalty programs report 30% higher retention rates than those without branded loyalty initiatives (WorldMetrics). Loyalty programs that carry consistent franchise branding outperform generic programs.
- Google Business Profile actions increased 41% year-over-year for franchise locations, underscoring that consistent local brand presence directly drives measurable customer actions (BizIQ).
These figures underscore a critical pattern: franchise systems that invest in enforcing brand standards across every touchpoint outperform fragmented networks on virtually every customer metric. For franchisors weighing a growth marketing strategy, consistency is the prerequisite — without it, even the best campaigns underperform.
Branding Design Industry: Market Size and Growth
The broader branding design industry gives franchise systems their creative toolkit — from logo systems and brand guidelines to packaging, digital identity, and environmental design. Understanding the market context helps franchisors benchmark their branding investment against industry norms and anticipate where design trends are headed.
| Metric | Value |
|---|---|
| Global branding design market (2024) | $50.3 billion |
| Projected market size (2032) | $72.1 billion |
| CAGR (2024–2032) | 4.6% |
| Rebranding segment growth (2022) | 7.1% |
| Rebrands as share of total branding projects | 22% |
| Fortune 500 branding budget (% of marketing) | 10–15% |
| Branding investment ROI ratio (average) | 11:1 |
| Minimalist design adoption by enterprise clients | 68% |
| AI-generated branding concept adoption by agencies | 22% |
Data compiled from Gitnux. The 11:1 ROI ratio means that for every dollar invested in branding design, companies see an average of eleven dollars in return — a figure that resonates especially with franchise systems where a single brand identity is leveraged across hundreds or thousands of locations. The rapid adoption of AI-generated branding concepts (22% of agency projects) is beginning to reshape how franchise systems prototype visual identities before committing to full rollouts.
Franchise Rebranding ROI and Cost Benchmarks
Rebranding is not cheap — but when executed well, it is one of the fastest paths to measurable revenue growth. The key is matching the scope of the rebrand to the business need: a logo refresh is a very different investment than a full strategic rebrand with store reimaging across an entire franchise network.
- Logo redesigns deliver a 20–30% sales uplift in the first year (Gitnux). The uplift comes from renewed customer attention and media coverage that a visual refresh generates.
- Rebranded companies report an average 21% revenue lift within three years (Gitnux). Unlike the first-year bump, this longer-term lift reflects genuine repositioning impact on market share.
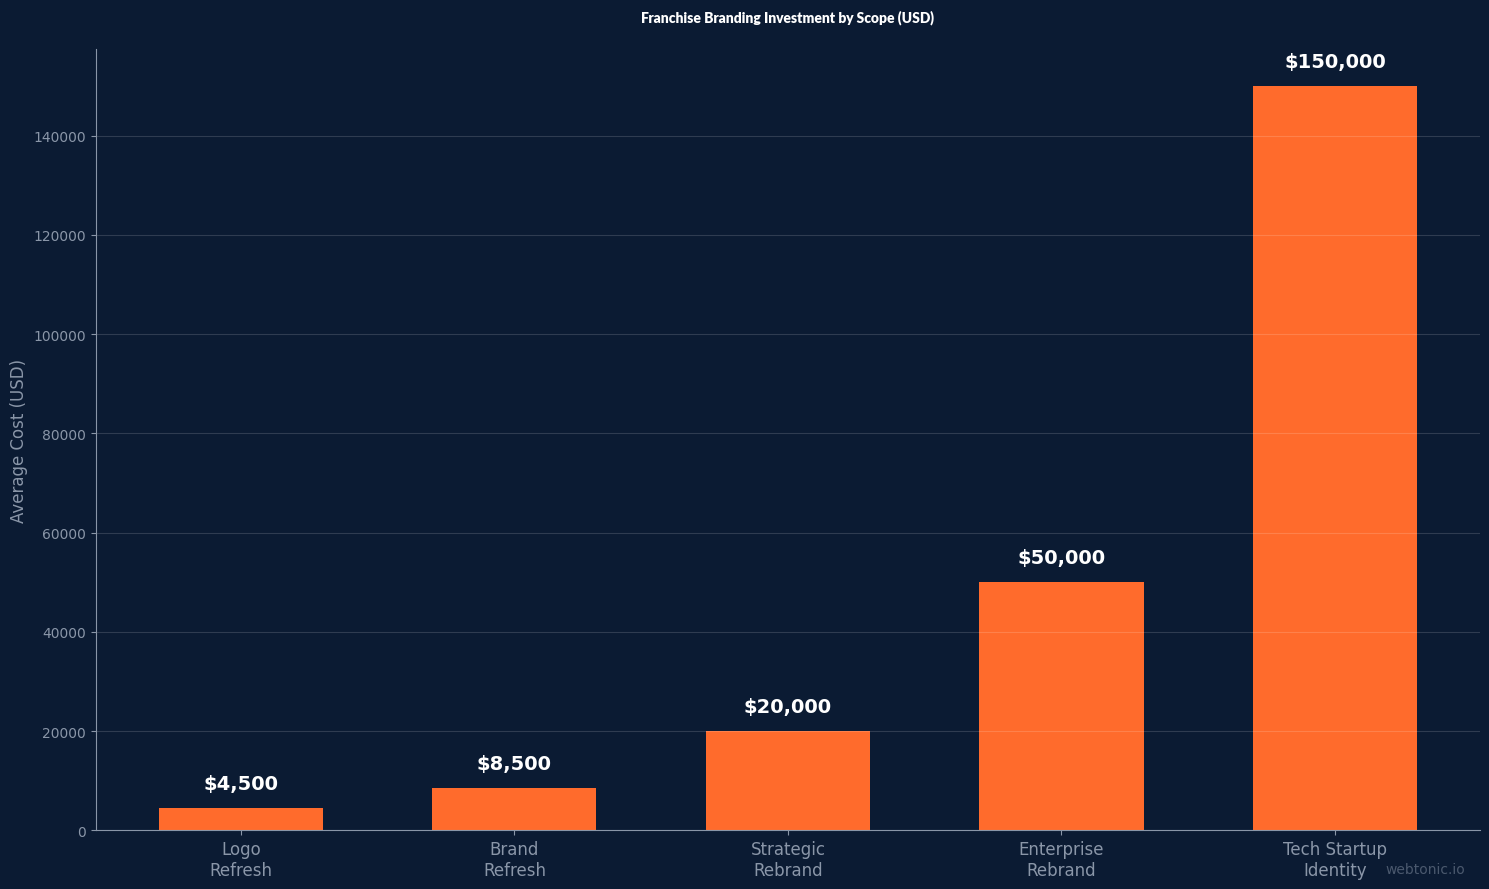
- Logo design costs range from $1,000 to $8,000; a brand refresh runs $2,000–$15,000; and a full strategic rebrand costs $10,000–$30,000 at a mid-tier agency (Big Red Jelly).
- Enterprise-level rebrands for franchise systems typically run $25,000–$75,000+, including comprehensive brand guidelines, templated materials, environmental design standards, and multi-location rollout support (Big Red Jelly).
- SMEs spent an average of $25,000 on branding redesigns in 2023, while tech startups budgeted $150,000 on average for initial brand identity creation (Gitnux).
- SaaS firms allocate 11% of revenue to brand development, providing a cross-industry benchmark that franchise technology companies can use to calibrate their own branding investment (Gitnux).
Franchise Marketing and Digital Spend Context
Branding does not exist in a vacuum — it amplifies every other marketing channel. The franchise industry's broader digital marketing benchmarks show how branding investment compounds when paired with paid search, local SEO, and social media advertising. A strong brand identity makes every ad dollar work harder by increasing click-through rates, quality scores, and customer trust.
| Franchise Marketing Metric | Value |
|---|---|
| U.S. franchise economic output (2026 projection) | $921 billion+ |
| U.S. franchise establishments (2026) | 845,000 |
| Jobs supported by U.S. franchising (2026) | 8.9 million |
| New franchise leads from digital marketing | 65% |
| Franchise systems allocating 40%+ budget to local SEO | 72% |
| Average ROI for franchise PPC campaigns | 3.5× |
| Google Business Profile actions YoY increase | 41% |
| Multi-unit operators as share of franchisees | 19.3% |
| Multi-unit operators controlling total franchised locations | 58.8% |
Data from BizIQ and IFA/FRANdata 2026 Economic Outlook. Multi-unit operators now control 58.8% of all franchised locations, making systemwide brand consistency even more critical as a smaller number of operators manage a larger share of the network. These operators are also more likely to invest in centralized brand management tools and compliance platforms.
Brand Compliance and Franchise Enforcement
Maintaining brand standards across a distributed network is one of the hardest operational challenges in franchising. Digital compliance tools and structured audit programs are rapidly replacing manual spot-checks as the preferred enforcement method, with data showing that compliance-focused franchise systems consistently outperform those relying on informal enforcement.
- Franchise compliance software adoption is accelerating, with digital audit data revealing network-wide patterns — which franchisees consistently score low, which checklist items are most frequently flagged, and how compliance correlates with unit-level financial performance.
- Consistent brand materials help franchisees achieve faster ramp-up — systems with centralized brand portals for approved marketing materials, templates, and signage specifications report shorter time-to-profitability for new locations (Linemark).
- 71% of franchises generate $500K or more in annual revenue, and brand enforcement is consistently cited as a key driver of top-quartile performance across franchise systems (WorldMetrics).
- 68% of enterprise clients have adopted minimalist design trends, reflecting a broader shift toward cleaner, more scalable brand systems that are easier to enforce across large franchise networks (Gitnux).
- New franchise businesses projected to open in 2026: 12,000+ — each requiring onboarding into the brand system with approved signage, marketing materials, and digital presence standards (BizIQ).
Best Practices for Franchise Branding in 2026
- Invest in a scalable brand system. Logo, color palette, typography, photography style, and messaging should be documented in a digital brand book that is accessible to every franchisee, vendor, and agency partner. The brand system should include pre-approved templates for common marketing needs.
- Use digital compliance tools. Automated brand audits catch inconsistencies before customers do — and emerging data shows that compliance scores correlate with higher unit-level revenue. Weighted audit scorecards with benchmarks against the network average give each location a clear performance number.
- Budget 10–15% of marketing spend on branding. Fortune 500 franchise systems set this benchmark for a reason: branding investment compounds across every other marketing channel, from paid search to local SEO to social media.
- Reimage strategically, not reactively. Franchise rebrands that include store reimaging see the largest revenue lifts — but only when rollout timelines and franchisee incentives are carefully planned to minimize disruption during the transition period.
- Measure brand performance at the location level. Track brand standard compliance scores alongside revenue, retention, and customer satisfaction per unit. This data-driven approach proves ROI and identifies which brand elements drive the most business impact.
Frequently Asked Questions
How much does franchise branding cost?
A logo refresh costs $1,000–$8,000, a brand refresh runs $2,000–$15,000, and a full strategic rebrand typically costs $10,000–$75,000+ depending on complexity. Enterprise franchise systems with store reimaging programs can invest significantly more in rollout across hundreds of locations. Fortune 500 franchise brands allocate 10–15% of their marketing budget to branding design annually.
What is the ROI of franchise rebranding?
Rebranded companies report an average 21% revenue lift within three years. Logo redesigns specifically deliver 20–30% sales uplift in the first year. The overall branding ROI ratio averages 11:1, meaning eleven dollars returned for every dollar invested in brand design and development.
Why is brand consistency important for franchises?
Consistent branding increases revenue by up to 23% and delivers 3–4× higher visibility. For franchises specifically, brand consistency is the foundation of consumer trust — 90% of consumers expect uniform experiences across all touchpoints. Franchises with consistent delivery achieve 75% customer retention compared to 55% for independents.
How do franchise systems enforce brand standards?
Leading franchisors use digital brand compliance software with weighted audit scorecards, centralized brand portals for approved materials, and structured reimaging programs with franchisee incentives. Systems that track compliance data alongside revenue can prove the ROI of enforcement and identify which locations need intervention.
What percentage of marketing budget should go to branding?
Fortune 500 franchise brands allocate 10–15% of their marketing budget to branding design. For smaller franchise systems, the benchmark is closer to 5–10%, with higher allocation during launch or rebrand periods. SaaS companies allocate approximately 11% of revenue to brand development as a cross-industry reference point.
Sources
TechRT — Branding Statistics 2026
WorldMetrics — Franchise Success Statistics
Gitnux — Branding Design Industry Statistics
BizIQ — Franchise Marketing Statistics 2026
Big Red Jelly — Cost to Rebrand a Business
Linemark — Franchise Marketing Materials Guide
Frandera — State of Franchising 2025


