



Table of contents
38% of B2B marketing pipeline is completely unattributable through standard tracking methods, and for franchise systems managing dozens or hundreds of locations, that dark-funnel gap widens even further. Below are 88+ statistics on attribution models, CRM analytics, AI-powered measurement, and multi-location tracking that define the franchise business intelligence landscape in 2026.
Key Takeaways
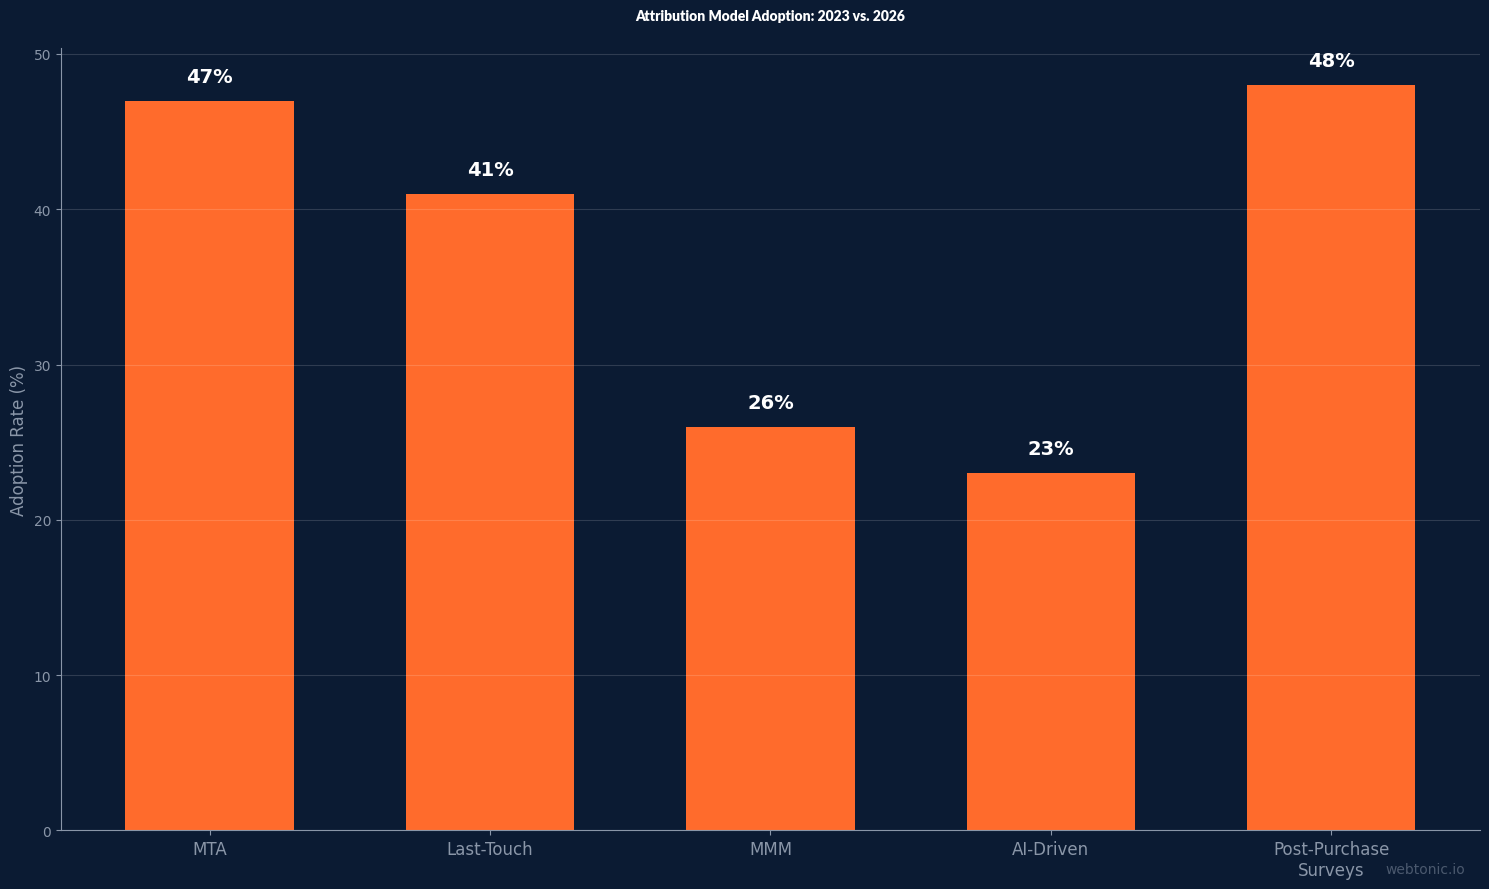
- Multi-touch attribution adoption reached 47% in 2026, up from 31% in 2023, while marketing mix modeling (MMM) tripled to 26%.
- 61% of franchisors now use CRM systems with built-in analytics, and franchises that centralized their data analytics grew up to 74% faster than fragmented networks.
- AI-powered attribution improves accuracy by 22 percentage points over deterministic models in holdout testing.
- Standard platform tracking can miss up to 80% of in-store conversions for businesses with physical locations.
- 72% of franchise systems allocate 40%+ of marketing budget to local SEO, yet only a fraction can attribute local SEO performance to individual location revenue.
Attribution Model Adoption in 2026
The era of single-model attribution is over. Privacy changes, cookie deprecation, and the rise of AI have pushed marketing teams toward dual-model approaches — using multi-touch attribution for tactical channel decisions and marketing mix modeling for strategic budget allocation. For franchise systems, this shift is particularly impactful because the complexity of multi-location, multi-campaign advertising requires more sophisticated measurement than standard platform reporting can provide.
| Attribution Model | Adoption Rate (2026) | Change from 2023 |
|---|---|---|
| Multi-touch attribution (MTA) | 47% | +16 pp (from 31%) |
| Last-touch attribution | 41% | −5 pp (declining) |
| Marketing mix modeling (MMM) | 26% | +17 pp (tripled from 9%) |
| AI-driven attribution | 23% | New category |
| Post-purchase surveys | 48% | +12 pp |
| Blended MER as primary metric | 84% | Dominant standard |
| New customer CAC tracking | 67% | Growing |
| Platform-reported ROAS (trusted) | 72% | Still tracked, less trusted |
Data from Digital Applied (1,200+ B2B teams surveyed between 2024 and 2026). Per-model adoption percentages exceed 100% in aggregate because most teams now run two models in parallel — typically MTA for tactical day-to-day optimization and MMM for quarterly and annual budget planning. Single-model attribution shops are now a minority, concentrated in organizations with sub-$10 million annual revenue.
The Multi-Location Attribution Challenge
Standard platform reporting was designed for single-advertiser, single-account, single-location businesses. Franchise businesses break every one of those assumptions simultaneously — and the resulting data gaps create real financial consequences in the form of misallocated budgets, inflated ROAS reports, and constant friction between corporate and franchisee marketing teams.
- Standard platform tracking can miss up to 80% of actual in-store conversions for businesses with physical locations. Traditional multi-touch attribution is optimized for clicks, not for door traffic and purchases that happen offline (Foursquare).
- Double-counting is rampant in franchise advertising: when national brand campaigns and local franchisee campaigns bid on the same keywords and target the same audiences, each platform independently claims credit for conversions, inflating reported ROAS and making budget allocation decisions unreliable (Cometly).
- The dark-funnel gap averages 38% of B2B pipeline — the share of conversions that cannot be attributed to any specific marketing touchpoint through standard tracking methods (Digital Applied).
- Franchises that centralized their analytics, SEO, and social data in 2025 grew up to 74% faster than fragmented networks that managed data across disconnected platforms and spreadsheets (Gitnux).
- A 28-location franchisor fixed multi-location Google Ads attribution by connecting ServiceTitan scheduling and dispatch data back to Google Ads, enabling true revenue-per-location tracking and scaling booked job volume as a result (GROAS).
- Location-level scorecards — showing spend, leads, appointments, conversion rates, and revenue per dollar spent per location — are now considered the gold standard for franchise marketing measurement by industry practitioners.
Franchise CRM and AI Analytics Adoption
CRM systems with built-in analytics have become the backbone of franchise measurement infrastructure. When paired with AI capabilities, these platforms can close the attribution gap that manual tracking and spreadsheet-based reporting leave wide open — connecting marketing spend to actual customer transactions across every location in the network.
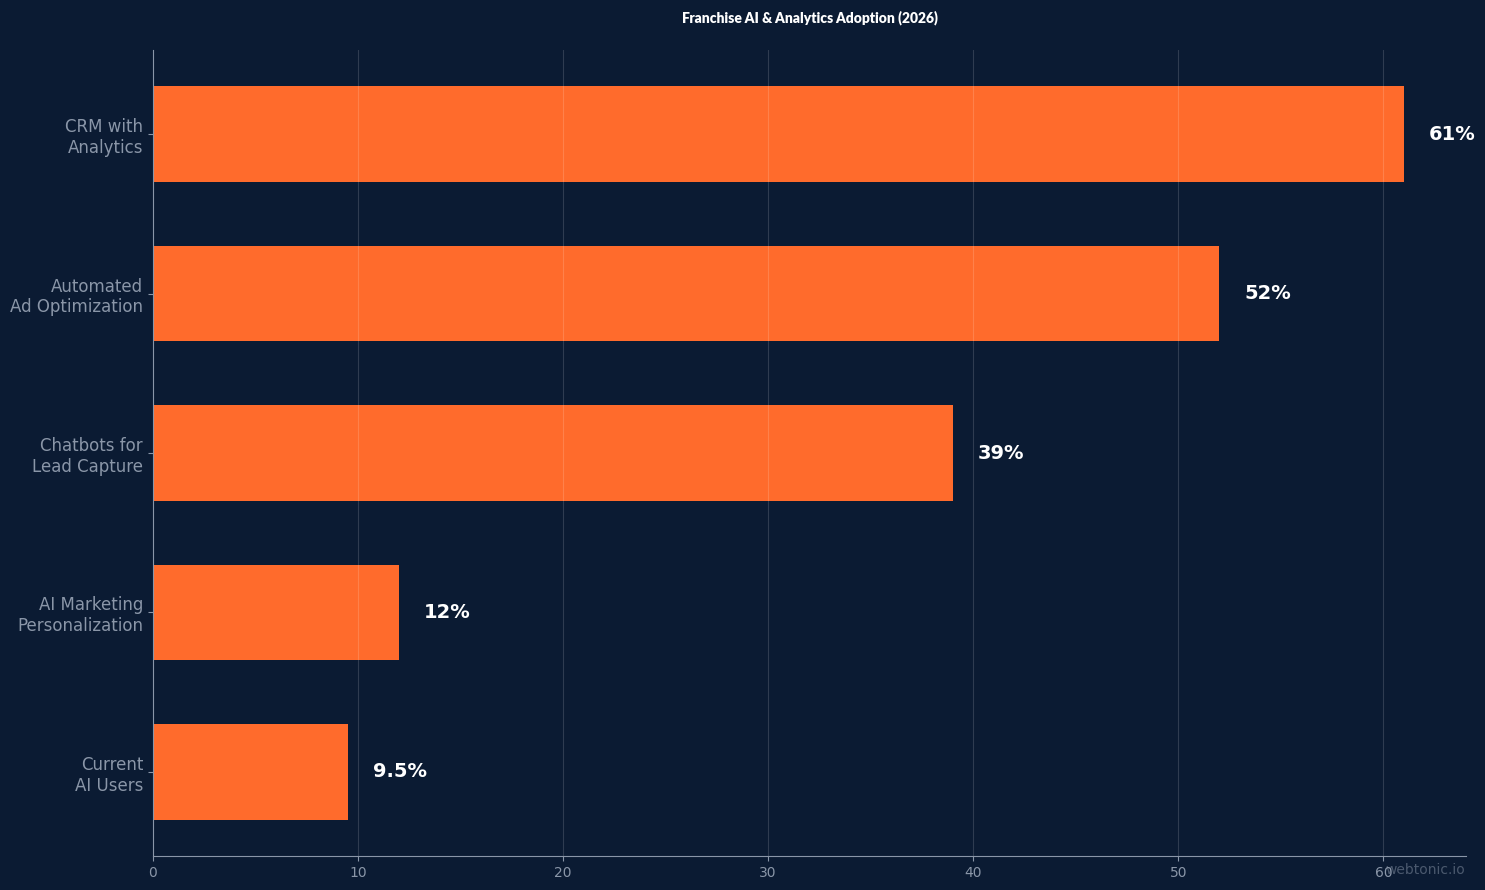
| Metric | Value | Source |
|---|---|---|
| Franchisors using CRM with analytics | 61% | gitnux.org |
| U.S. franchise businesses currently using AI | 9.5% | gitnux.org |
| Franchise companies planning AI adoption (3 years) | 72% | gitnux.org |
| Franchise operators using automated ad optimization | 52% | gitnux.org |
| Using chatbots for lead capture | 39% | gitnux.org |
| AI attribution accuracy lift vs. deterministic models | +22 pp | digitalapplied.com |
| Investment in franchise automation software (2024) | $2.8 billion | gitnux.org |
| Automation software investment increase from 2022 | +156% | gitnux.org |
| Franchisors using AI for marketing personalization | 12% | gitnux.org |
Data from Gitnux and Digital Applied. The gap between current AI usage (9.5%) and planned adoption (72%) represents one of the largest technology deployment waves in franchise history. Franchise automation software investment reached $2.8 billion in 2024, a 156% increase from 2022 levels, signaling that the infrastructure for AI-powered attribution is actively being built and deployed.
Multi-Location Marketing Measurement
For franchise systems, the ultimate attribution challenge is connecting national brand campaigns to individual location revenue — bridging the online-to-offline gap that standard digital tracking cannot close without purpose-built infrastructure. The statistics below show where the industry stands on this critical measurement capability.
| Franchise Marketing Metric | Value |
|---|---|
| New franchise leads from digital marketing | 65% |
| Franchise systems allocating 40%+ to local SEO | 72% |
| Google Business Profile actions YoY increase | 41% |
| Franchise PPC average ROI | 3.5× |
| Sales as most effective marketing success metric (franchisors) | 73% |
| Customer retention as key marketing metric | 65% |
| U.S. franchise economic output (2026 projection) | $921 billion+ |
| U.S. franchise establishments (2026) | 845,000 |
Data from BizIQ and industry surveys. 73% of franchisors say sales is the most effective metric for measuring marketing success, yet most lack the attribution infrastructure to connect marketing spend to individual location sales with confidence. This disconnect — between what franchisors want to measure and what their current tools can actually track — is the core challenge that franchise BI platforms and advanced tracking implementations aim to solve.
The ROI of Better Attribution Infrastructure
Investing in attribution and BI infrastructure is not just a measurement exercise — it directly improves marketing ROI by redirecting spend from underperforming channels to proven winners and eliminating the budget waste caused by double-counting and unattributed conversions.
- AI-powered attribution delivers +22 percentage points higher accuracy than deterministic models in holdout tests, meaning the models predict actual conversions more reliably and enable more confident budget allocation decisions (Digital Applied).
- Franchises using integrated CRM and ad platforms improve attribution accuracy by connecting campaign data to actual customer transactions, closing the gap between platform-reported conversions and real revenue (BizIQ).
- A 15-location UK retailer reached 9.5× blended ROAS after implementing proper multi-location attribution with verified Google Business Profiles and in-store transaction tracking, up from 1.5–2.0× ROAS before the implementation (12AM Agency).
- Server-side tracking solves the cookie deprecation gap by sending conversion data directly from CRM and POS systems to ad platforms, consistently capturing data across every location without relying on browser-based cookies that are increasingly blocked (Cometly).
- 84% of teams now use blended MER (revenue divided by all marketing spend) as their primary attribution metric, recognizing that platform-level ROAS overstates performance due to double-counting and view-through inflation (Digital Applied).
- MMM adoption tripled in three years (9% to 26%), driven by signal loss (43% cited), Google's open-source MMM release (38%), and board-level pressure on attribution defensibility (29%) (Digital Applied).
Best Practices for Franchise Attribution and BI
- Implement server-side tracking. With cookie deprecation accelerating across all major browsers, server-to-server conversion data from CRM and POS systems is the only reliable way to track the full customer journey from ad click to in-store purchase across all franchise locations.
- Run dual attribution models. Use multi-touch attribution for day-to-day campaign optimization and marketing mix modeling for quarterly budget allocation decisions — this dual approach is now the operating norm for 2026, not a best practice for the future.
- Build location-level scorecards. Each franchise location should have a recurring dashboard showing spend, leads, appointments, closed revenue, conversion rates, and revenue per dollar spent. Include comparisons against system averages so each franchisee understands their relative performance.
- Centralize analytics across all locations. Fragmented data systems are the single largest barrier to accurate franchise attribution — franchises that centralized in 2025 grew up to 74% faster than those managing data in disconnected silos.
- Invest in AI-powered attribution. With 72% of franchise companies planning AI adoption within three years and accuracy improvements of +22 percentage points in holdout testing, AI attribution is transitioning from experimental to essential infrastructure for franchise marketing teams.
The Measurement Gap in Franchise Marketing
The disconnect between franchise marketing investment and measurement capability creates a significant hidden cost. Franchise systems are spending aggressively on digital marketing — but the lack of reliable attribution means a substantial portion of that budget is allocated based on incomplete or misleading data rather than proven performance.
- 65% of new franchise leads originate from digital marketing campaigns, yet most franchise systems cannot track which specific digital touchpoints contributed to each lead with confidence across their location network (BizIQ).
- The average franchise development budget is $278,000 in advertising spend, and without accurate attribution, a meaningful share of this investment may be directed toward channels that appear effective in platform reporting but deliver lower actual ROI than alternatives (Franchising.com).
- 72% still track platform-reported ROAS but trust it less — teams increasingly recognize that platform-level attribution overstates performance through view-through credits and self-reported conversions (Digital Applied).
- 67% of teams now track new customer CAC separately as a way to cut through the noise of platform-reported metrics and measure the true cost of acquiring new franchise customers at the location level (Digital Applied).
- 48% of DTC and franchise brands use post-purchase surveys as a supplementary attribution signal, asking customers directly how they discovered the brand to validate digital attribution data with self-reported information (Digital Applied).
Frequently Asked Questions
What is franchise marketing attribution?
Franchise marketing attribution is the process of connecting marketing spend to actual customer conversions across multiple locations. Unlike single-business attribution, franchise attribution must handle overlapping national and local campaigns, double-counting across platforms, and the online-to-offline gap where up to 80% of in-store conversions go untracked by standard digital analytics.
What percentage of franchise companies use AI for analytics?
Currently, 9.5% of U.S. franchise businesses use AI, but 72% plan to adopt it within three years. In marketing specifically, 52% of franchise operators already use automated advertising optimization and 39% use chatbots for lead capture. Investment in franchise automation software reached $2.8 billion in 2024.
How much does franchise BI software cost?
Investment in franchise automation and BI software reached $2.8 billion in 2024 industry-wide, a 156% increase from 2022. Individual franchise BI platform costs vary widely — from $500 per month for basic CRM analytics to $5,000+ per month for enterprise platforms with AI-powered attribution, location-level dashboards, and offline conversion tracking integration.
What is the best attribution model for franchises?
The 2026 best practice is a dual-model approach: multi-touch attribution (47% adoption) for tactical decisions and marketing mix modeling (26% adoption) for strategic budget allocation. Single-model attribution is now a minority approach concentrated in smaller organizations. 84% of teams use blended MER as their primary metric.
How do franchises track offline conversions?
Leading franchise systems use server-side tracking that connects CRM, POS, and scheduling system data directly to ad platforms. Location-based attribution platforms such as Foursquare optimize for in-store visits rather than clicks, capturing the conversions that standard digital tracking misses — which can be up to 80% of total conversions for location-based businesses.
Sources
Digital Applied — Marketing Attribution Statistics 2026
Gitnux — AI in the Franchise Industry Statistics
Cometly — Franchise Marketing Attribution
Foursquare — Attribution Guide
GROAS — Multi-Location Attribution Case Study
BizIQ — Franchise Marketing Statistics 2026
12AM Agency — Measuring Franchise Marketing ROI
Salesoptima — Franchise Marketing ROI Analytics


