



Table of contents

Not one credible 2026 dataset publishes a fractional CMO return on investment. Rates, hours, tenure and adoption are measured and citable. Outcomes are not. This page collects the numbers that hold up, and turns them into a payback calculation you can defend to a finance team.
Key Takeaways
- The average fractional CMO rate is USD 180 an hour in 2026, with a median of USD 175.
- A typical engagement is scoped at about nine hours a week, or 468 hours a year.
- That is roughly USD 84,000 a year at the average rate and typical scope.
- Retainer engagements run USD 5,000 to USD 25,000 a month depending on role and stage.
- Median B2B SaaS CAC payback is 16 months for calendar 2025, improved from 18 months.
- The top quartile repays acquisition cost in six months or less; the fourth quartile takes 24.
- The fastest-growing companies show a 10-month median payback, against 18 months for slower growers.
- Marketing budgets sit at 7.8% of company revenue in Gartner's 2026 survey of 401 marketing leaders.
- The CMO-CFO business case relationship scores just 4.5 out of 7 and has barely moved in four years.
- Marketing spending grew only 1.7% over the prior 12 months, the smallest increase since 2021.
- When profits miss, 53.1% of executives cut expenses first, and marketing is cut 45.4% of the time.
- 91% of fractional practitioners do hands-on execution, not advice alone.
The numbers that actually exist
Every figure below is traceable to a named study with a stated sample. Anything that could not be traced to one was left off this page, including every percentage return quoted in vendor case studies.
| Input | 2026 figure | Source and sample |
|---|---|---|
| Average fractional CMO rate | USD 180/hour | Go Fractional rate data, 2026 |
| Median fractional CMO rate | USD 175/hour | Go Fractional rate data, 2026 |
| Typical weekly scope | ~9 hours (468 hrs/yr) | Go Fractional benchmark, 2026 |
| Retainer range | USD 5,000-25,000/month | Fractional Pulse, 2026 |
| Median CAC payback (B2B SaaS) | 16 months | Benchmarkit, CY-2025 operating benchmarks |
| Top-quartile CAC payback | 6 months or less | Benchmarkit, CY-2025 |
| Marketing budget share of revenue | 7.8% | Gartner 2026 CMO Spend Survey, n=401 |
| Marketing spend growth, 12 months | 1.7% | The CMO Survey, 2026 |
Start with cost, because cost is the only certain half of the ratio
The denominator of any return calculation is knowable on day one. Go Fractional rate data puts the 2026 average fractional CMO rate at USD 180 an hour, median USD 175, with a typical scope of about nine hours a week - 468 hours a year. At those figures the annual cash cost lands near USD 84,000.
Fractional Pulse describes the retainer route instead: USD 5,000 to USD 25,000 a month depending on role and stage, on six to 12 month initial terms that often extend. The same analysis flags the most expensive structural mistake in this market - paying retainer rates for project-shaped work, where a 12-month retainer at USD 15,000 a month costs USD 180,000 for scope a defined project might have covered for USD 40,000.
| Engagement shape | Annual cash cost | Revenue needed at 60% margin | Revenue needed at 30% margin |
|---|---|---|---|
| Advisory, 5 hrs/week | ~USD 47,000 | ~USD 78,000 | ~USD 157,000 |
| Typical, 9 hrs/week | ~USD 84,000 | ~USD 140,000 | ~USD 280,000 |
| Retainer, USD 10k/month | USD 120,000 | USD 200,000 | USD 400,000 |
| Retainer, USD 20k/month | USD 240,000 | USD 400,000 | USD 800,000 |
Payback is the honest question, not ROI
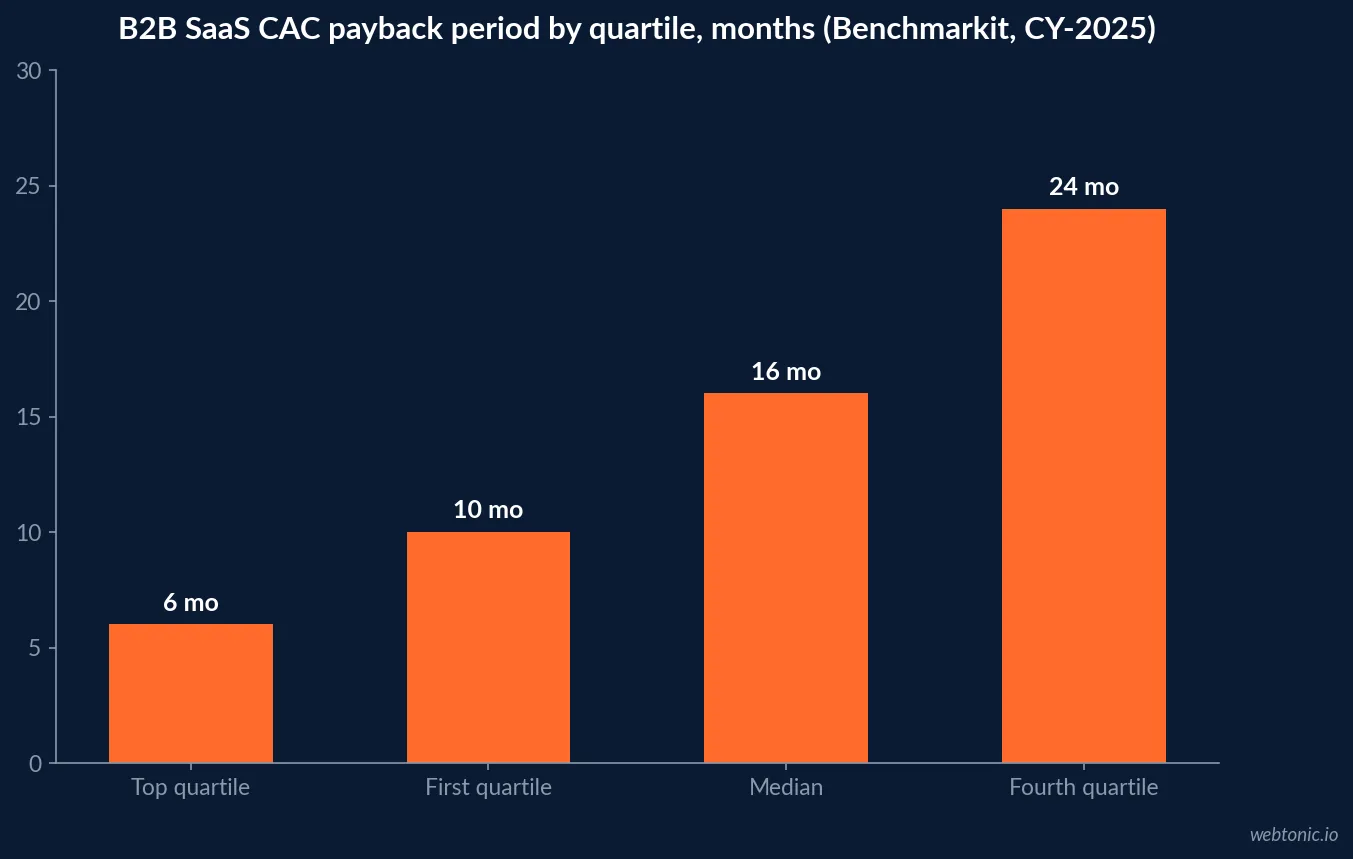
Return on investment implies a completed cycle. Most marketing investments have not completed one by the time the first review lands. Benchmarkit operating benchmarks for calendar 2025 put the median B2B SaaS CAC payback at 16 months, inside the commonly cited 12 to 18 month efficiency band, with a first quartile of 10 months and a fourth quartile of 24 months. The top quartile repays acquisition cost in six months or less.
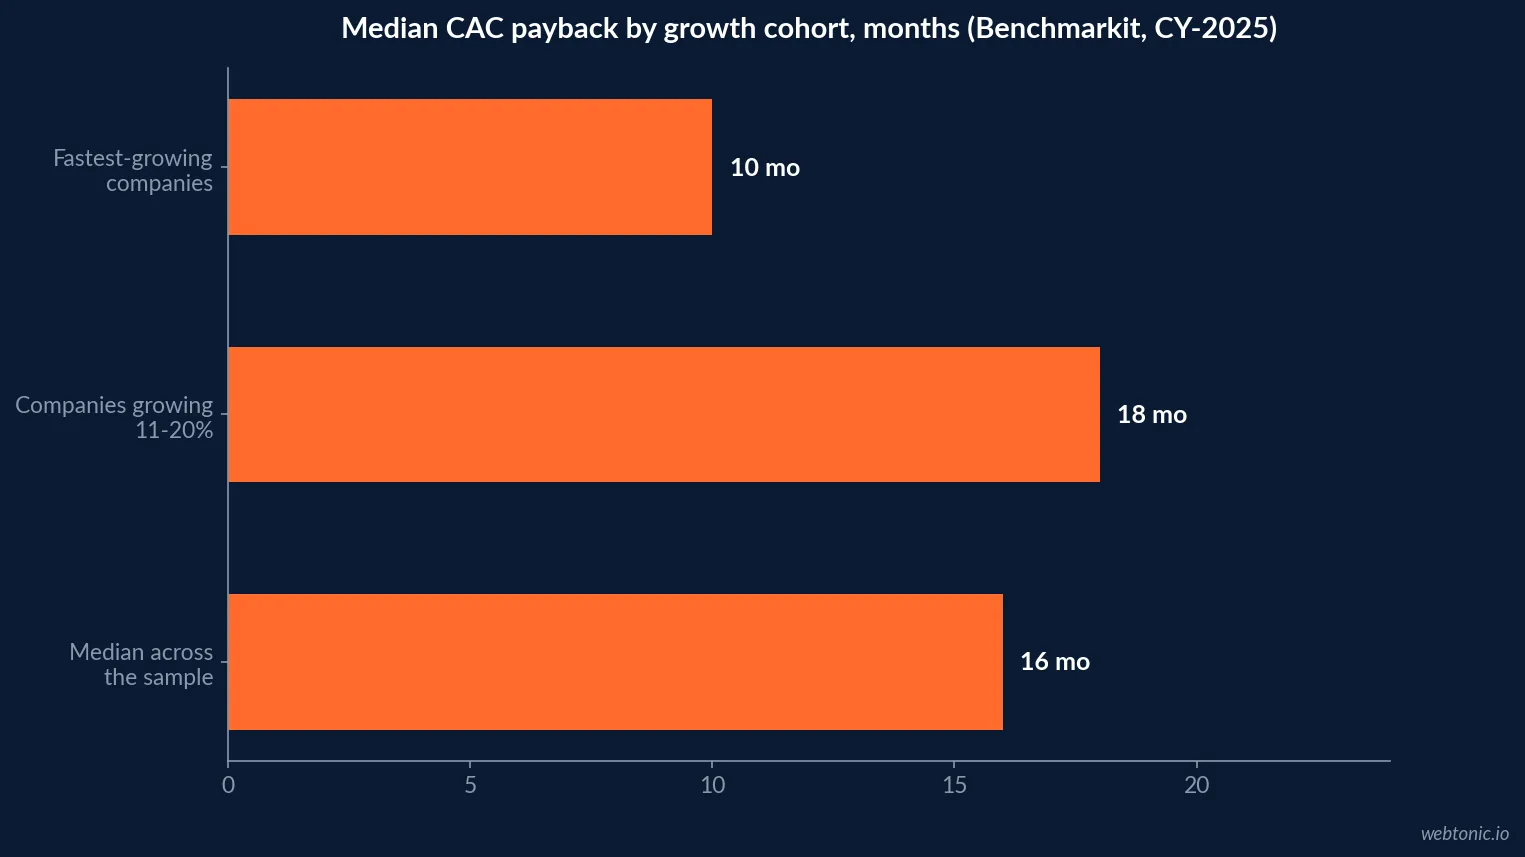
Two details matter more than the headline. First, median payback improved from 18 months to 16 months year over year, an 11% gain - efficiency is moving, so a stale benchmark flatters a weak engagement. Second, the fastest-growing companies post a 10-month median payback against 18 months for those growing 11-20%, which kills the idea that growth is bought by accepting worse economics. If your own payback sits at 16 months, a fractional engagement reviewed at month three is being judged on leading indicators, and everyone in the room should say so out loud.
| Payback quartile | Months to repay CAC | What it implies for a review clock |
|---|---|---|
| Top quartile | 6 or less | A two-quarter engagement can be judged on returns |
| First quartile | 10 | Financial review at month 10-12, not month 3 |
| Median | 16 | Leading indicators only inside the first year |
| Fourth quartile | 24 | Fix measurement and economics before scaling spend |
The breakeven calculation to run before signing
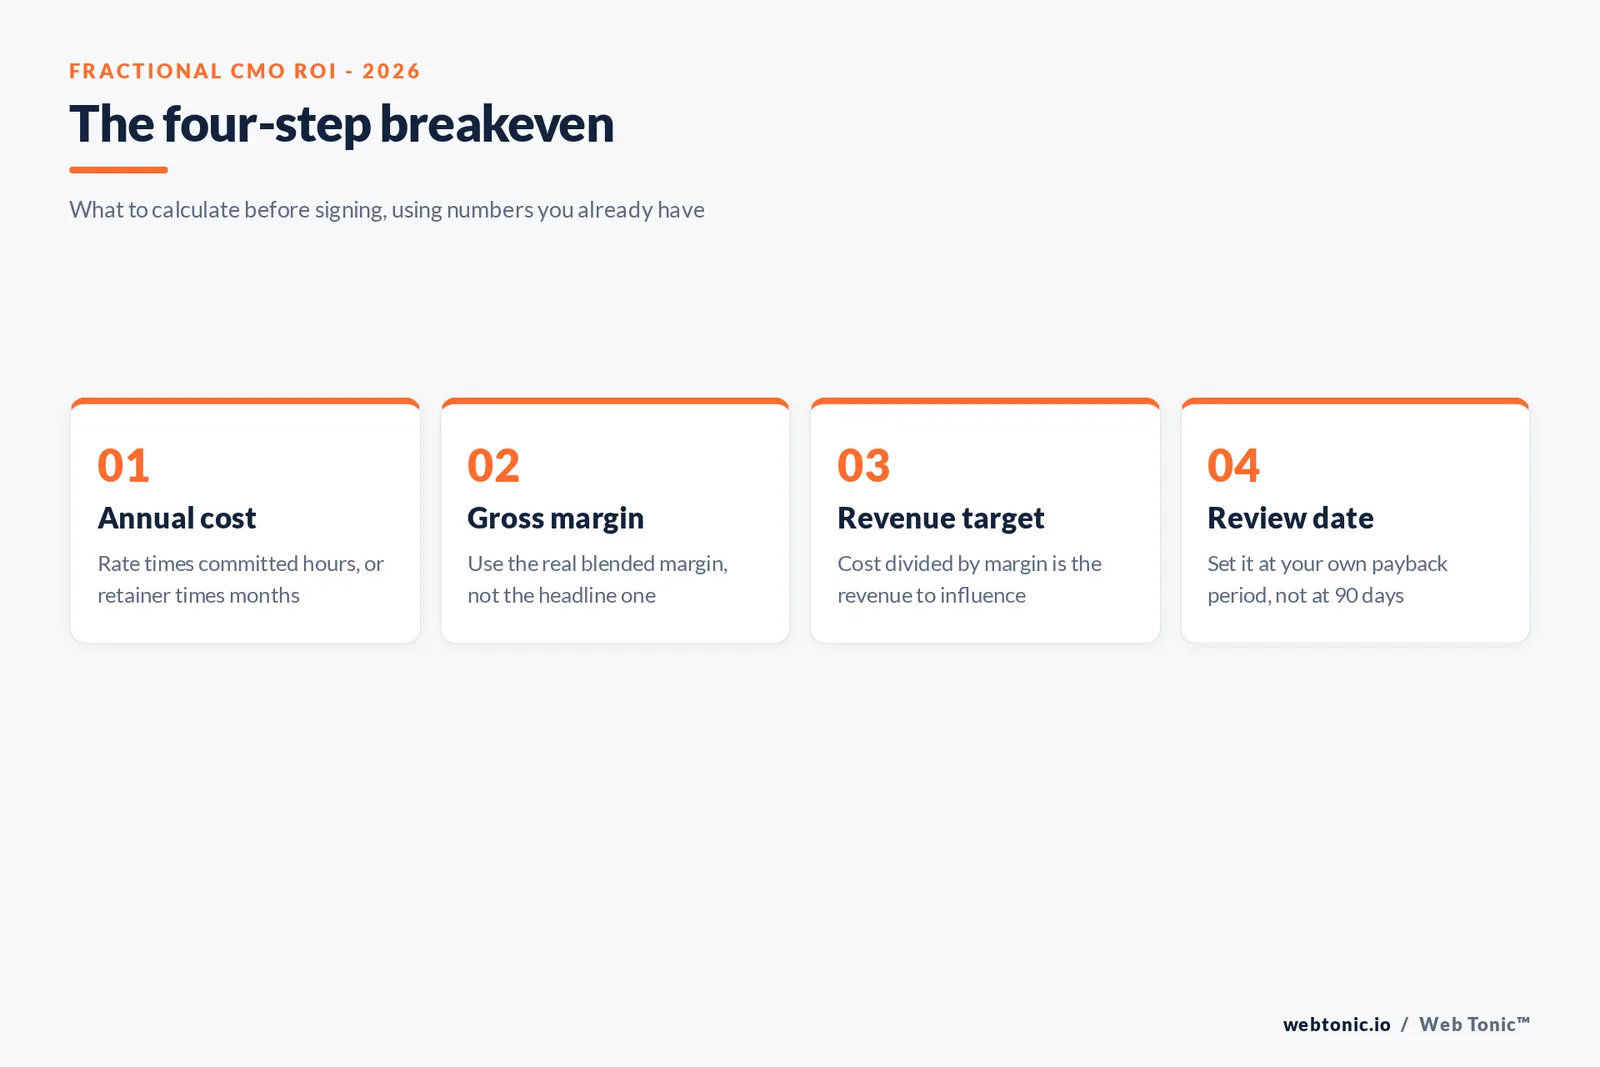
The arithmetic is deliberately blunt. Annual engagement cost divided by gross margin gives the incremental revenue the engagement has to influence. At USD 84,000 and a 60% gross margin, that is about USD 140,000 of new revenue; at a 30% margin it doubles to roughly USD 280,000. Nothing about the fractional model changes that arithmetic - it only changes how much senior judgement you buy per dollar.
Two adjustments make it fair. Subtract the cost of the alternative you did not buy, because the relevant comparison is rarely nothing. And credit the structural deliverables that outlive the engagement - positioning, a documented plan, a working measurement stack - at the cost of building them separately. If measurement is the weak link, that is a data and analytics problem to solve before it is a leadership one.
Budget context explains most disappointed expectations
Gartner's 2026 CMO Spend Survey, fielded among 401 marketing leaders, found marketing budgets effectively flat at 7.8% of company revenue and 15.3% of budget allocated to AI while only about 30% consider themselves ready to scale it.
The CMO Survey, run by Duke University's Fuqua School of Business with Deloitte and the American Marketing Association, is harsher: marketing spending grew just 1.7% over the prior 12 months, the smallest increase since 2021, and when profits fall short 53.1% of executives cut expenses first, with marketing cut 45.4% of the time. An engagement whose plan assumes new budget will appear is being set up to fail its own review.
| Budget signal | 2026 reading | Effect on a fractional engagement |
|---|---|---|
| Budget share of revenue | 7.8% | The envelope is fixed; prioritisation beats expansion |
| Spend growth, 12 months | 1.7% | Plans requiring new money stall at month two |
| Executives cutting first when profit misses | 53.1% | Engagements need a defensible cost story |
| Frequency marketing is the cut | 45.4% | Reporting cadence protects the line item |
| Share of budget going to AI | 15.3% | Competing internal claim on the same envelope |
Why the ROI claims you find are unusable
Search for fractional CMO ROI and the results are revenue multiples, pipeline lifts and cost-per-opportunity improvements, nearly all published by firms selling the service. None disclose sample size, control group or the engagements that ended early. The credible sources in this category - the 2026 Fractional Work Report among them, built on 1,733 survey responses and 44,433 candidate profiles - measure the supply side, because that is what marketplaces can observe. That report does establish one relevant fact: 91% of fractional practitioners do hands-on execution rather than advice alone, so the output you are buying is broader than a strategy document.
| Claim you will see | Status | What the record supports |
|---|---|---|
| Fractional CMOs deliver 3x pipeline | Unverifiable | Vendor case studies, no sample or control |
| Fractional costs half a full-time hire | Directionally supported | Rate and scope data, not outcome data |
| Median CAC payback is 16 months | Supported | Benchmarkit CY-2025 B2B SaaS benchmarks |
| Marketing budgets are 7.8% of revenue | Supported | Gartner 2026 CMO Spend Survey, n=401 |
| ROI is provable in one quarter | Contradicted | Median payback exceeds the review window |
What to measure in the first 90 days instead
Returns are not observable yet, but four things are. Whether a documented baseline exists. Whether qualified pipeline created is moving. Whether cost per qualified opportunity is trending down. And whether one structural deliverable has landed. That is enough for a renew, resize or exit decision without inventing attribution. Teams running paid acquisition alongside the engagement can borrow the same discipline we apply to creative and paid media programmes.
| Window | Question | Evidence required | Failure signal |
|---|---|---|---|
| Days 1-30 | Do we have a baseline? | Documented CAC, payback, pipeline, channel mix | No agreed baseline means nothing can be judged |
| Days 31-60 | Has anything been stopped? | Written plan naming three bets and the cuts | More than five priorities means none |
| Days 61-90 | Is efficiency moving? | Cost per qualified opportunity against baseline | Movement without an explanation is noise |
| Month 10-16 | Has it paid back? | Payback recomputed on your own margin | Renewal without a financial review |
Where the honest upside sits
The defensible case for part-time marketing leadership is not a return multiple. It is that the marketing budget envelope is flat at 7.8% of revenue while the demands on it keep expanding, and the scarce input is senior judgement about what to stop. That is also why the structural tier of the scorecard - positioning, measurement, a plan the team keeps - carries most of the value in an engagement lasting well under two years. Our growth marketing team treats those deliverables as contract line items rather than by-products.
If you want a second read on a proposal or a scorecard before you sign it, get in touch with your current numbers and we will walk the breakeven with you.
Frequently Asked Questions
What is the ROI of a fractional CMO?
There is no published, methodologically sound ROI benchmark for fractional CMO engagements in 2026. Every credible dataset in this category measures inputs - hourly rates, weekly hours, tenure, adoption - because those are observable. The percentage returns you see quoted almost always come from firms selling the service, with no sample size and no disclosure of engagements that failed. The workable substitute is a breakeven calculation: take the annual cost of the engagement, divide by your gross margin, and you have the incremental revenue the engagement has to influence before it pays for itself.
How long before a fractional CMO pays for itself?
Treat it as a payback question, not an ROI question. Benchmarkit data for calendar 2025 puts the median B2B SaaS CAC payback at 16 months, with the top quartile at six months or less and the fourth quartile at 24 months. If the acquisition machine a fractional CMO improves takes 16 months to repay its own cost, an engagement judged at month three is being judged on leading indicators rather than returns. Set the financial review at the point your own payback period allows, and use pipeline and efficiency metrics before that.
What should a fractional CMO cost against expected return?
Go Fractional benchmark data for 2026 puts the average fractional CMO rate at USD 180 an hour at a typical scope of about nine hours a week, which is roughly USD 84,000 a year. Fractional Pulse reports retainers of USD 5,000 to USD 25,000 a month depending on role and stage. Against a 60% gross margin, an USD 84,000 engagement needs to influence about USD 140,000 of incremental revenue to break even, before any credit for the plan and measurement infrastructure that stays with the company.
Why is fractional CMO ROI so hard to measure?
Because the role influences outcomes rather than producing them directly, and because the reporting window is usually shorter than the sales cycle. The 2026 CMO Survey rates the CMO-CFO relationship at just 4.5 on a seven-point scale for building a business case for marketing spending, and fewer than half of companies report marketing and finance working together on growth. If a full-time marketing function struggles to agree on attribution with finance, a part-time one inherits the same problem in a shorter window.
What should be measured instead of ROI in the first quarter?
Three things that are observable inside 90 days: whether a documented baseline exists at all, whether qualified pipeline created is moving, and whether cost per qualified opportunity is trending down. Add one structural deliverable - positioning, measurement stack or a written plan - that the company keeps after the engagement ends. Those four give you a defensible renew, resize or exit decision without pretending you can attribute revenue that has not closed yet.
Sources
Go Fractional - Fractional CMO Rate Data 2026
Fractional Pulse - Engagement Model Comparison 2026
Benchmarkit - B2B SaaS Performance Metrics Benchmarks (CY-2025)
The CMO Survey - Highlights and Insights Report 2026
Gartner 2026 CMO Spend Survey (Business Wire release)
Fractional Jobs - The Fractional Work Report 2026
Spencer Stuart - CMO Tenure 2026 Snapshot


