Table of contents

A fractional CMO is hired for two or three quarters and judged on numbers that take a year to move. Here is a scoreboard built only from published 2026 benchmarks.
Key Takeaways
- Median CMO tenure is 4.1 years in the S&P 500.
- The wider C-suite average is 5.0 years.
- 31% of S&P 500 companies have no CMO title at all.
- 77% of vacant marketing seats are filled within six months.
- Fractional engagements run about nine hours a week.
- That is roughly 468 hours of senior attention a year.
- Median customer acquisition cost payback is 16 months.
- The strong quartile pays back in 10 months.
- Median lifetime value to acquisition cost is 4.1 times.
- The median SaaS magic number is 1.37.
- Median professional services growth is 9.9%.
- High-growth firms grow 36.6%, no-growth firms shrink 11.4%.
- High-growth firms spend 12.0% of revenue on marketing.
- No-growth firms spend 5.0%.
- Marketing budgets sit at 9.0% of revenue.
- Marketing spend growth is 1.7% year on year.
- Marketing headcount growth fell 50% year on year.
- 71% of marketing leaders call agility key.
Start with the clock, not the metric
Every fractional CMO scorecard argument is really an argument about time. Spencer Stuart's 2026 CMO tenure snapshot puts median chief marketing officer tenure at 4.1 years in the S&P 500 against a 5.0-year C-suite average, with 31% of those companies carrying no CMO title and 77% of open seats filled inside six months.
A fractional engagement is shorter still. Go Fractional reports roughly nine hours a week - about 468 hours a year, and Fractional Pulse reports six to twelve month terms with a 30-day notice period. Choose metrics that can move inside that window, or accept that the engagement will be renewed on vibes.
| Time horizon | What can genuinely move | Published anchor | Review cadence |
|---|---|---|---|
| Weeks 1-6 | Measurement and reporting hygiene | Only 52% of leaders report mature governance | Weekly |
| Quarter 1 | Pipeline mix and channel concentration | Referrals supply 39.5% of leads | Monthly |
| Quarter 2 | Acquisition efficiency | Median CAC payback of 16 months | Monthly |
| Quarters 3-4 | Revenue growth rate | Median growth of 9.9% in services, 20% in SaaS | Quarterly |
| Year 2 | Profitability and tenure of the plan | High-growth firms post 39.5% profitability | Quarterly |
The growth and profit benchmarks worth planning against
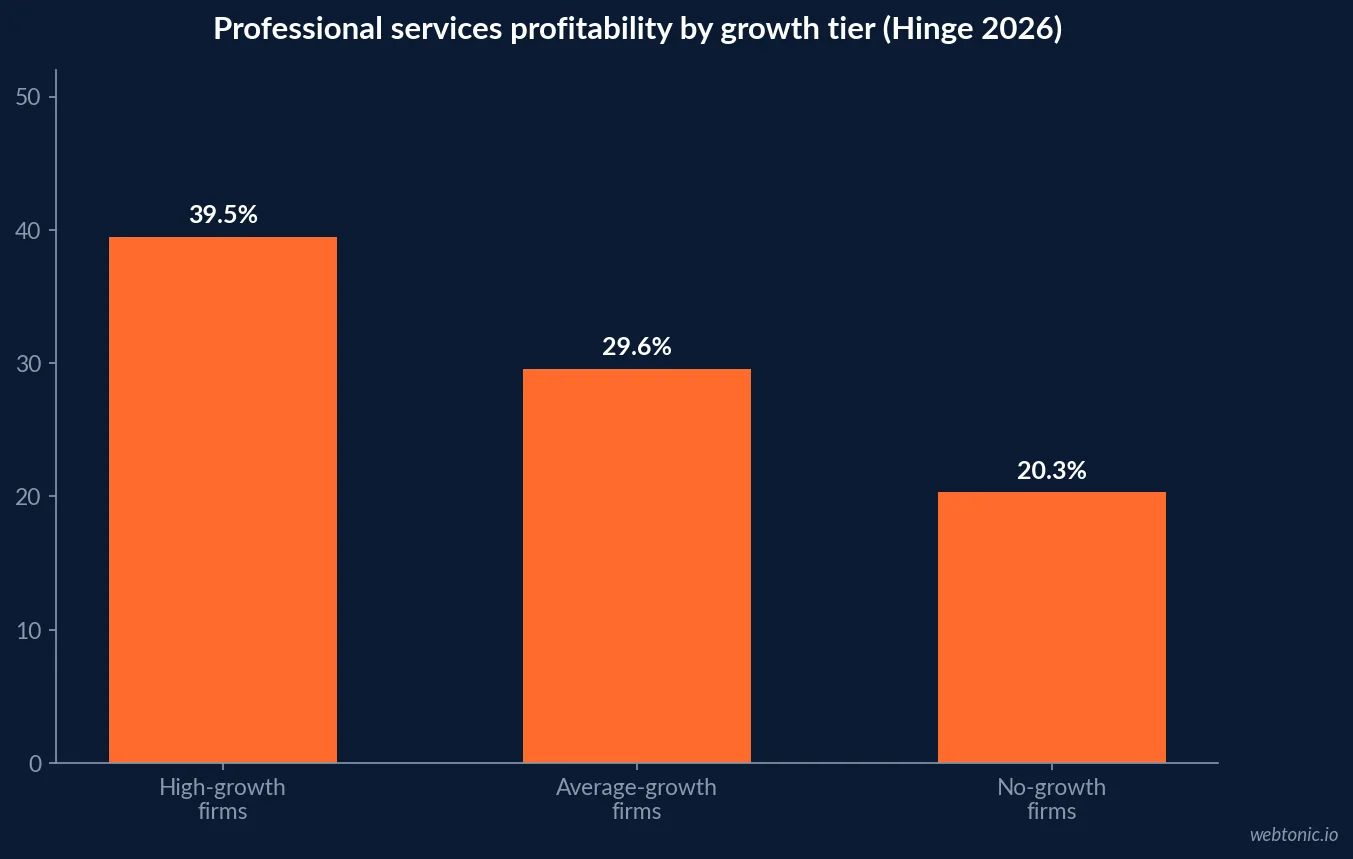
Hinge's 2026 High Growth Study reports median growth of 9.9%, the lowest reading since 2018, with high-growth firms at 36.6%, average firms at 8.5% and no-growth firms at minus 11.4%. Profitability splits the same way: 39.5% for high-growth firms against 29.6% and 20.3%.
The spread matters more than the median. A part-time leader who lifts a firm from the no-growth band to the average band has done something the profitability line will show a year later - which is exactly why the quarterly scorecard has to carry leading indicators too.
| Benchmark | High growth | Average growth | No growth |
|---|---|---|---|
| Revenue growth rate | 36.6% | 8.5% | -11.4% |
| Profitability | 39.5% | 29.6% | 20.3% |
| Marketing spend, share of revenue | 12.0% | Not reported | 5.0% |
| Leads from referrals | 39.5% of all leads | Not reported | Not reported |
| Firms conducting research | 80% run some research | Competitive research 46.1% | 20% run none at all |
Efficiency metrics are where a fractional CMO earns the renewal
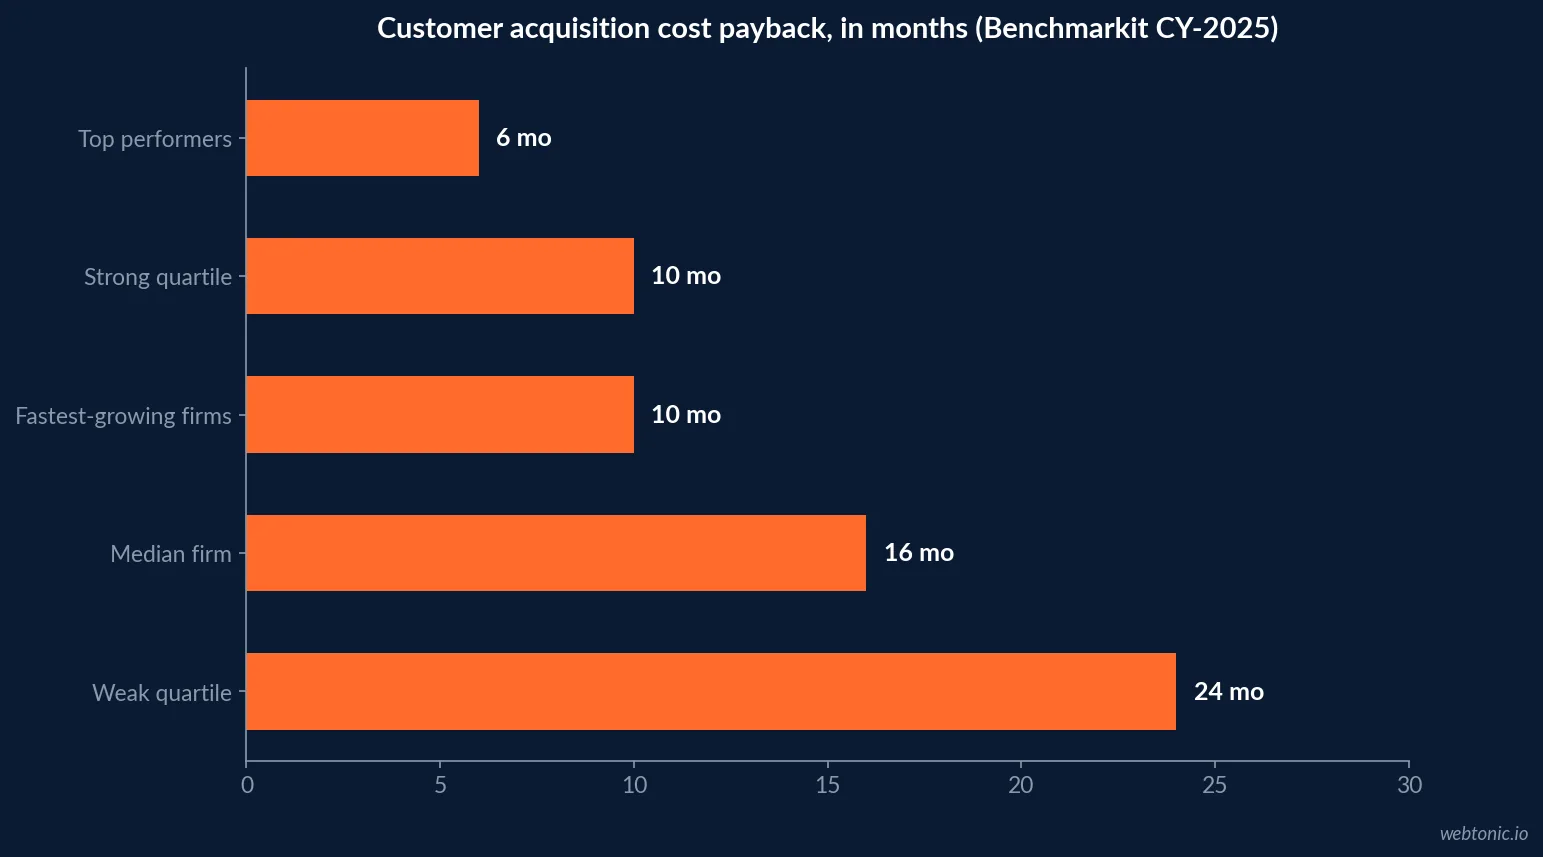
Benchmarkit's CY-2025 B2B SaaS benchmarks put median customer acquisition cost payback at 16 months, improved from 18 a year earlier, with the strong quartile at 10 months and the weak quartile at 24. The median lifetime value to acquisition cost ratio is 4.1 times, the median blended acquisition cost ratio is USD 1.30 of sales and marketing spend per new dollar of recurring revenue, and the median magic number is 1.37.
These are the numbers a two-quarter engagement can genuinely bend, because they respond to channel mix, offer and qualification rather than to brand equity built over years.
What the efficiency gain is actually made of
Benchmarkit is blunt about the mechanism: the median company improved efficiency by cutting sales, marketing, research and administration spend rather than by becoming more durable. Median growth compressed to 20% in CY-25 from 30% in CY-22, the 75th percentile fell from 75% to 42%, and gross revenue retention dropped four points, from 88% to 84% - the largest single-year fall in the series. The median Rule of 40 rose from 15% to 25%.
A fractional CMO who inherits that pattern has a diagnosis problem before a growth problem. Improving a ratio by starving the numerator is a one-year trick, and any scorecard should separate the two.
| Efficiency metric | Latest median | Prior reading | How to read it |
|---|---|---|---|
| CAC payback period | 16 months | 18 months | Improved, but partly by spending less |
| Rule of 40 | 25% | 15% | Largest single-year gain in five years |
| Gross revenue retention | 84% | 88% | The durability warning in the data |
| Net revenue retention | 95% seat-based, 108% usage-based | Not comparable | Pricing model decides the ceiling |
| ARR per employee | USD 175,000 | Up 17% year on year | 75th percentile at USD 253,000 |
| Software gross margin | 80% | Stable four years | Little room to buy growth with margin |
The budget the scorecard has to live inside
The CMO Survey 2026 reports marketing budgets at 9.0% of revenue and 9.6% of total firm budgets, spend growth of 1.7%, headcount growth down 50% year on year and training falling to 3.8% of marketing spend from 5.8%. Some 71% of leaders call agility key to their strategy.
Read alongside Hinge's 12.0% against 5.0% spend gap, that is the real brief: close a spend-effectiveness gap without new headcount. Our growth marketing team plans most fractional mandates against exactly those two constraints.
Where the plan is allowed to place its bets
The CMO Survey reports growth spend concentrating on market penetration at 56.4%, with product development at 22.9% - up from 19.2% - and new markets at 14.1%, down from 17.0%. It also reports a 68 to 32 split between present and future-facing spend, with 70.6% reporting a shift towards short-term results.
A fractional scorecard that promises new-market entry inside two quarters is fighting the whole distribution. Penetration metrics - win rate, qualified pipeline per channel, cost per qualified opportunity - are the defensible choice, and they are what our data and analytics practice instruments first.
Content and thought leadership need their own line
CMI's 2026 B2B research reports 97% of organisations have a content strategy, with effectiveness improving significantly for 13% and somewhat for 48%, while 30% report no change. The top challenges are prompting action at 40%, resources at 39%, measurement at 33% and quality at 28%.
Thought-leadership measurement is still mostly engagement at 80%, with business impact at 63%, audience feedback at 40% and brand authority at 38%. If a fractional CMO inherits engagement-only reporting, replacing it is a quarter-one deliverable, not a nice-to-have.
| Scorecard tier | Example metric | Benchmark to hold it against | Owner |
|---|---|---|---|
| Hygiene | Share of pipeline with a source | Measurement blocks 33% of content teams | Fractional CMO |
| Demand | Qualified opportunities per channel | Referrals supply 39.5% of services leads | Demand lead |
| Efficiency | CAC payback in months | Median 16, strong quartile 10 | Fractional CMO |
| Retention | Gross revenue retention | Median 84%, down from 88% | Customer team |
| Compounding | Revenue growth rate | 9.9% services median, 20% SaaS median | CEO |
The market context behind the hire
Fractional Jobs reports 149% year-on-year demand growth, roughly 150,000 US practitioners, marketing accounting for 20% of demand, 87% of practitioners with eleven or more years of experience, 64% working with multiple clients and 90% saying they will not return to full-time work. Vendux cites Gartner expecting more than 30% of midsize companies to use fractional executives by 2027.
That is a deep bench of experienced operators and a shallow pool of shared definitions. Publishing the scorecard before the shortlist call is the fastest way to separate the two.
Does running a formal scorecard change anything?
The strongest supporting number is vendor research and should be labelled as such: EOS Worldwide reports companies running its operating system with a professional implementer growing 2.8 times faster in a TrueSpace and Gallup validated study of 305 companies.
Discount the multiple; keep the mechanism. A short list of reviewed numbers on a fixed cadence is what a nine-hour-a-week leader can actually operate, and it is the difference between a fractional CMO and an expensive advisor.
A scorecard you can hand over on day one
Six numbers, two leading and four lagging: qualified pipeline by channel, cost per qualified opportunity, CAC payback against the 16-month median, gross revenue retention against 84%, growth rate against 9.9% or 20% depending on your model, and marketing spend as a share of revenue against the 12.0% versus 5.0% gap.
Everything else is diagnostic detail. If you want a second read on a scorecard you have already drafted, send it over, or start from how we structure paid measurement in our Google Ads strategy guide.
Frequently Asked Questions
What KPIs should a fractional CMO be measured on?
Three tiers. A pipeline tier the engagement can move inside a quarter, an efficiency tier anchored to published benchmarks - Benchmarkit puts the median customer acquisition cost payback at 16 months and the median lifetime value to acquisition cost ratio at 4.1 times - and a compounding tier such as revenue growth and profitability that takes a year or more. Scoring a two-quarter engagement only on the third tier is how good fractional work gets cancelled early.
How long does a fractional CMO engagement usually last?
Go Fractional reports roughly nine hours a week of engagement, about 468 hours a year, and Fractional Pulse reports six to twelve month retainer terms with a 30-day notice period. That is the window a scorecard has to fit inside. For comparison, Spencer Stuart puts median chief marketing officer tenure at 4.1 years in the S&P 500, below the 5.0-year C-suite average.
What is a realistic growth benchmark to plan against?
Hinge's 2026 High Growth Study puts median professional services growth at 9.9%, the lowest since 2018, with high-growth firms at 36.6% and no-growth firms at minus 11.4%. In B2B SaaS, Benchmarkit reports median growth compressing to 20% in CY-25 from 30% in CY-22. A plan promising a step change without a channel that can carry it is a plan written against neither number.
How much of the marketing budget should the plan assume?
The CMO Survey 2026 reports marketing budgets at 9.0% of revenue and 9.6% of total firm budgets, with spend growth of just 1.7% and headcount growth down 50% year on year. Hinge finds high-growth professional services firms spending 12.0% of revenue on marketing against 5.0% for no-growth firms. Fractional leadership is usually hired precisely because that gap has to close without headcount.
Does a scorecard actually change the outcome?
The honest answer is that the strongest supporting evidence is vendor research: EOS Worldwide reports that companies running EOS with a professional implementer grew 2.8 times faster in a TrueSpace and Gallup validated study of 305 firms. Treat the multiple with caution and the mechanism seriously - a small number of reviewed metrics on a fixed cadence is what a part-time leader can actually operate.
Sources
Spencer Stuart - CMO tenure 2026 snapshot
Benchmarkit - CY-2025 B2B SaaS performance metrics benchmarks
Hinge Marketing - 2026 High Growth Study
The CMO Survey - Highlights and Insights Report 2026
Go Fractional - Fractional CMO rates
Fractional Pulse - Fractional executive engagement comparison
Content Marketing Institute - B2B content marketing trends 2026
Fractional Jobs - The Fractional Work Report
Vendux - Ten numbers on fractional executives in 2026
EOS Worldwide - Companies with an implementer grew 2.8x faster