



Table of contents

The average S&P 500 CMO lasts 4.1 years, and the typical fractional CMO engagement lasts nine to 18 months. Both numbers are well documented. What almost nobody publishes is what either arrangement produces. This page collects the fractional CMO statistics that hold up in 2026, and sets out the KPI framework that fills the gap.
Key Takeaways
- Average CMO tenure at S&P 500 companies is 4.1 years, against 5.0 years for all C-suite roles.
- 31% of S&P 500 companies have no enterprise CMO at all, in line with historical averages.
- A typical fractional CMO engagement is scoped at about 9 hours a week, roughly 23% of a full-time week.
- That works out to about 468 hours a year of senior marketing leadership.
- Retainer engagements run larger, at 15 to 25 hours a month for USD 10,000 to 12,000.
- Most engagements last 9 to 18 months before renewal, resizing or exit.
- Marketing budgets sit at 7.8% of company revenue in 2026, up a tenth of a point from 7.7%.
- Half of surveyed CMOs report a budget of 6% of revenue or less, so the average flatters most teams.
- Median B2B software CAC payback is about 20 months new-only, 23 months fully loaded.
- 91% of fractional workers do hands-on execution, not advice alone.
- Marketing is the second largest fractional function at 20% of demand, behind finance at 22%.
Benchmarks at a glance
Every figure below comes from a named study with a stated sample. Anything that could not be traced to one is not on this page.
| Benchmark | 2026 figure | Source and sample |
|---|---|---|
| Average CMO tenure (S&P 500) | 4.1 years | Spencer Stuart, January 2026, S&P 500 data |
| All C-suite average tenure | 5.0 years | Spencer Stuart, January 2026 |
| Companies with no enterprise CMO | 31% | Spencer Stuart, S&P 500 |
| Typical fractional scope | 9 hrs/week (468 hrs/yr) | Go Fractional benchmark, 2026 |
| Median fractional retainer | USD 10,000-12,000/month | Fractional Pulse, updated Aug 2026 |
| Typical engagement length | 9-18 months | Fractional Pulse, 2026 |
| Marketing budget share of revenue | 7.8% | Gartner 2026 CMO Spend Survey, n=401 |
| Marketing share going to AI | 15.3% | Gartner 2026 CMO Spend Survey |
The tenure number, stated accurately
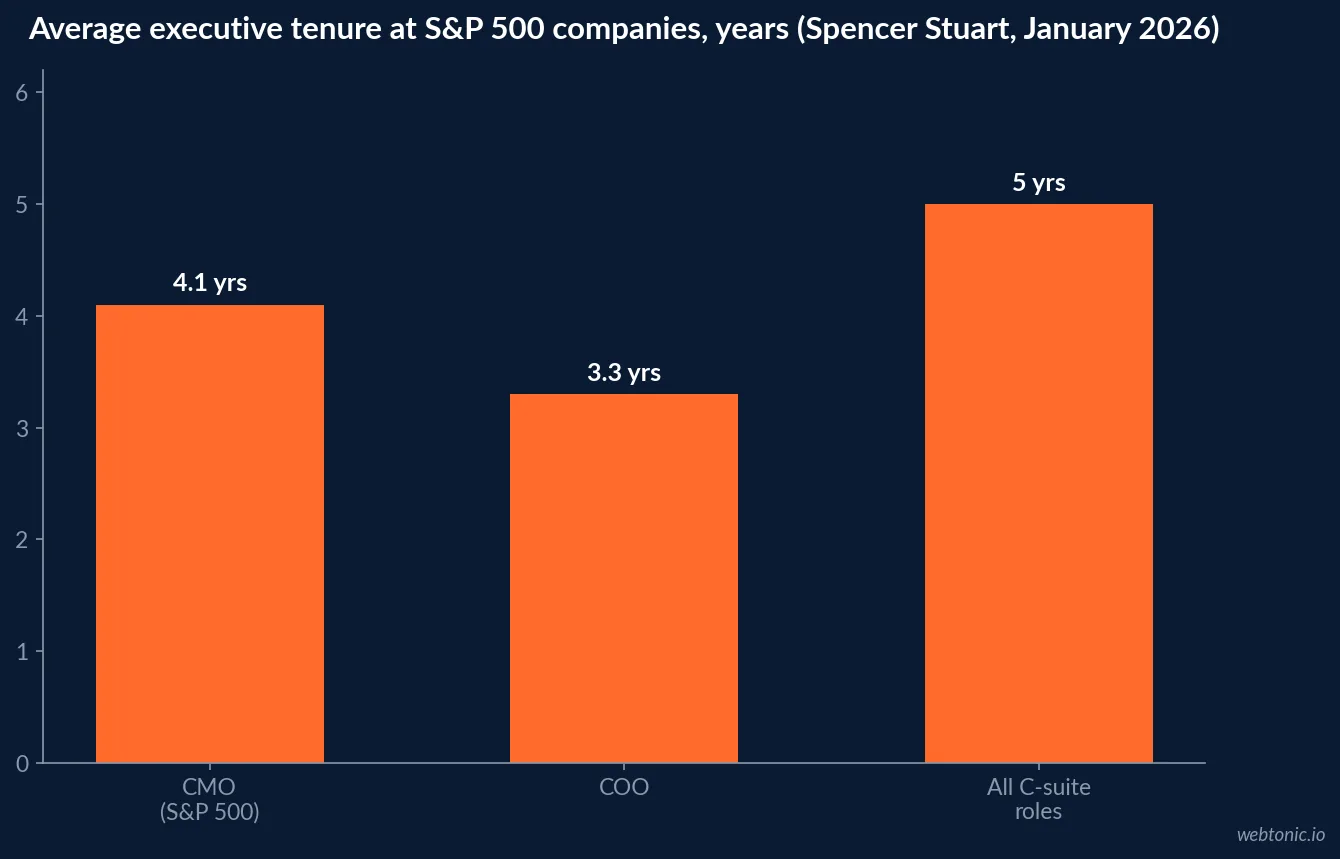
The most repeated statistic in this category is also the most mangled. You will see "average CMO tenure is 28 months" quoted without a source. The measured figure from Spencer Stuart's 2026 CMO tenure snapshot is 4.1 years across the S&P 500, compared with 5.0 years for all C-suite roles at the same companies. Only COOs turn over faster, at 3.3 years.
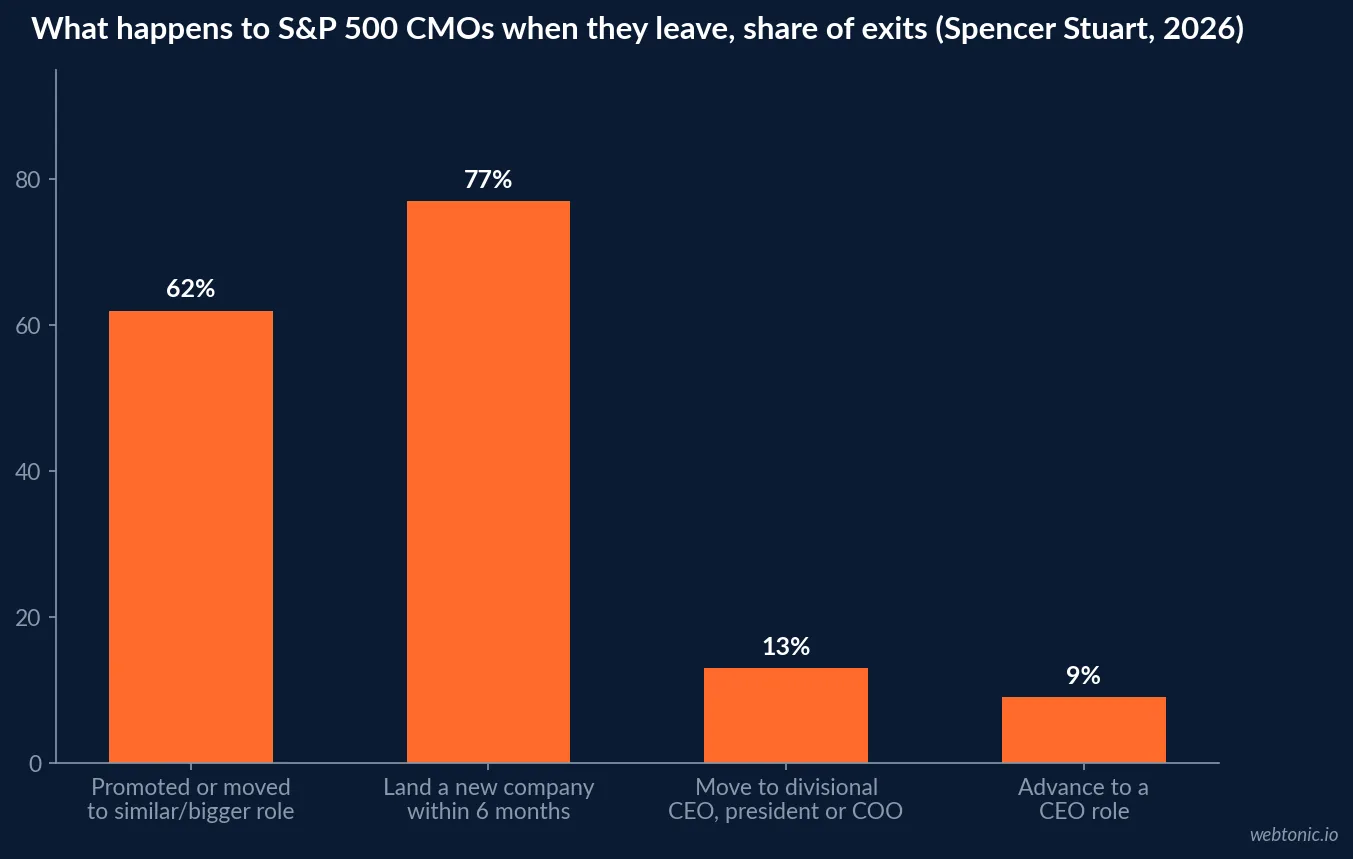
The direction of travel is also misread. Of 218 CMO exits between 2021 and 2025, 62% were promoted internally or moved to a similar or larger role elsewhere, 13% moved to a divisional CEO, president or COO seat and 9% became a CEO. 77% of those leaving landed at a new company within six months. Short tenure in this seat looks more like a career ladder than a revolving door.
The genuinely useful figure for anyone weighing part-time marketing leadership is a different one: 31% of S&P 500 companies run without an enterprise CMO. Marketing still happens at those firms; it just sits with a divisional leader, a general manager or a founder. That is the same structural choice a smaller company makes when it hires an interim marketing director instead of a full-time chief marketing officer.
What a fractional CMO engagement actually looks like
Scope is where expectations break. Go Fractional's 2026 benchmark data puts the typical fractional CMO engagement at about nine hours a week, roughly 23% of a full-time week and 468 hours a year. Fractional Pulse reports retainers covering 15 to 25 hours of work a month at a median of USD 10,000 to USD 12,000, with most engagements running nine to 18 months.
Those two datasets describe different products under one label. A nine-hour week buys strategy, prioritisation and oversight of other people's execution. A 20-hour-plus week can also buy hands-on build work - and 91% of fractional practitioners say they do hands-on execution rather than advice alone, according to the 2026 Fractional Work Report (1,733 survey responses, 44,433 candidate profiles). Decide which product you are buying before you write the KPIs.
| Engagement shape | Weekly hours | What it can realistically own | Reasonable review cadence |
|---|---|---|---|
| Advisory | 4-6 hrs | Strategy, hiring input, quarterly plan, board narrative | Monthly |
| Standard fractional | 8-12 hrs | Strategy plus channel oversight and agency management | Bi-weekly |
| Operating | 15-25 hrs | Strategy, execution of one or two channels, team leadership | Weekly |
| Interim cover | 25-30 hrs | Full CMO remit during a vacancy or transition | Weekly |
The KPI framework worth writing into the contract
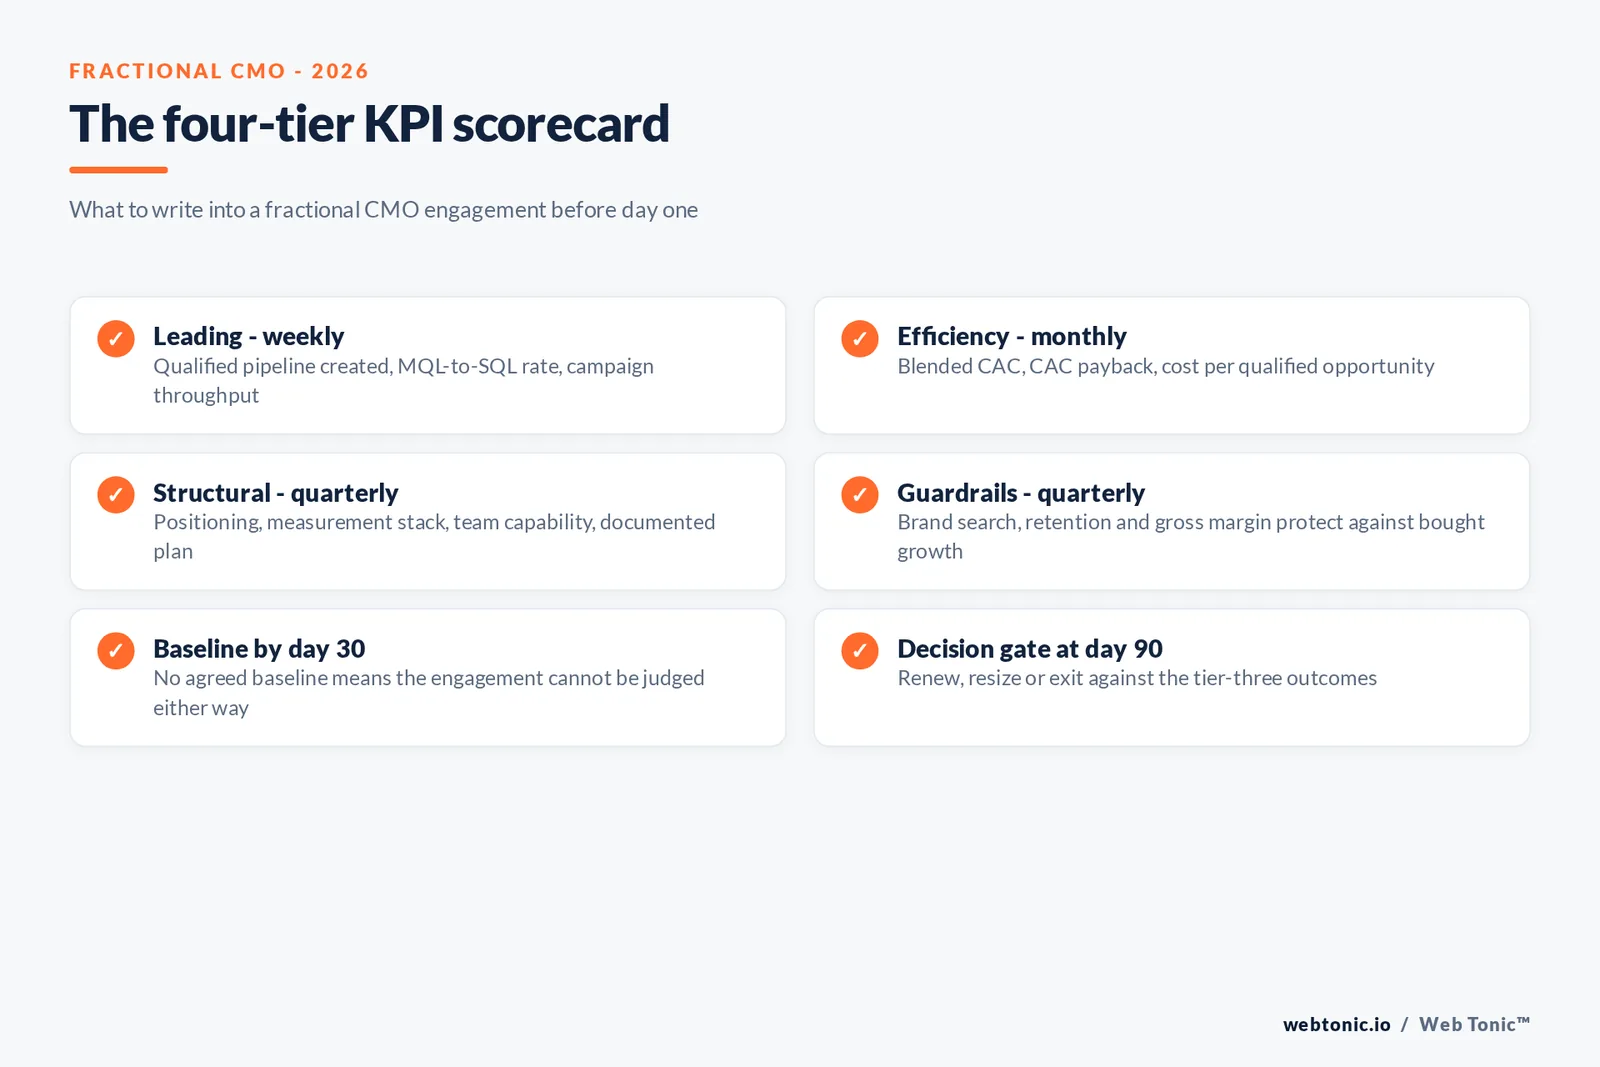
Because no credible dataset measures fractional CMO outcomes, the buyer has to define success in the contract. The framework below uses three tiers with different review clocks, which is the pattern that survives contact with a part-time schedule. Our growth marketing team uses the same tiering when a client brings in outside leadership.
| Tier | Metrics | Review clock | Why it belongs here |
|---|---|---|---|
| Leading | Qualified pipeline created, MQL-to-SQL rate, campaign throughput | Weekly | Moves fast enough to course-correct inside a month |
| Efficiency | Blended CAC, CAC payback, cost per qualified opportunity | Monthly | Where a senior operator earns the retainer |
| Structural | Positioning, measurement stack, team capability, documented plan | Quarterly | The asset the company keeps after the engagement |
| Guardrail | Brand search volume, retention, gross margin | Quarterly | Catches growth bought at the expense of the business |
Importing efficiency benchmarks from better-measured datasets
Nobody publishes a fractional CMO efficiency benchmark, so use the adjacent B2B datasets and adjust for your model. The H1 2026 B2B SaaS GTM benchmark aggregation puts median CAC payback at about 20 months on new business only and 23 months fully loaded, based on the KeyBanc and Sapphire survey of more than 939 private companies, with strong product-market fit defined as payback under 18 months. MQL-to-SQL conversion is the other reliable bottleneck signal, sitting around 13% on average across B2B funnels.
These are software numbers. A services firm with a two-week sales cycle and 60% gross margin should not inherit a 20-month payback target; it should compute its own. The first 30 days of any engagement is usually spent establishing that baseline, which is why baseline documentation belongs in the contract as a deliverable rather than as an assumption. If measurement is the weak link, that is a data and analytics problem before it is a leadership one.
| Metric | Benchmark | Where it comes from | How to use it |
|---|---|---|---|
| CAC payback (new only) | ~20 months median | KeyBanc/Sapphire, 939+ private companies | Software only; recompute on your gross margin |
| CAC payback (fully loaded) | ~23 months median | Same survey | The number a board will ask for |
| Strong PMF payback | Under 18 months | First Round PMF framework | Target band for a growth-stage engagement |
| MQL-to-SQL conversion | ~13% | Aggregated B2B funnel data, 2026 | Diagnoses definition mismatch between teams |
| Marketing budget share | 7.8% of revenue | Gartner 2026 CMO Spend Survey | Sanity-check the total marketing envelope |
What the budget context says about expectations
Gartner's 2026 CMO Spend Survey, fielded January to March 2026 among 401 marketing leaders, found marketing budgets effectively flat at 7.8% of company revenue, up from 7.7% in 2025. It also found CMOs allocating 15.3% of budget to AI initiatives while only about 30% consider themselves ready to scale those investments. The 2025 edition is the useful companion: half of respondents reported a budget share of 6% or less, and 59% said they lacked the budget to execute their strategy.
Read that against a part-time leadership hire and the implication is blunt. The constraint most companies bring to a fractional engagement is not strategy, it is capacity and prioritisation inside a flat envelope. KPIs that assume new budget will appear are the most common reason an engagement is judged a failure at month six.
Why outcome benchmarks do not exist yet
Search for fractional CMO performance data and you will find revenue multiples, pipeline lifts and cost-per-opportunity improvements presented as benchmarks. Almost all of them are single client cases published by firms selling the service, with no sample size, no control and no disclosure of failed engagements. The credible datasets in this category measure inputs - rates, hours, tenure, adoption - because inputs are what marketplaces and search firms can observe.
That is not an argument against the model. It is an argument for writing your own scorecard. The three-tier framework above exists precisely because an external benchmark is unavailable, and because a company that cannot describe success in numbers before signing will not agree on it afterwards.
| Claim you will see | Status | What the record supports |
|---|---|---|
| Average CMO tenure is 28 months | Misstated | 4.1 years at S&P 500 companies (Spencer Stuart, 2026) |
| Two-thirds of large caps have a CMO | Supported | 31% of the S&P 500 have no enterprise CMO |
| Fractional costs half a full-time hire | Directionally supported | About 50% less for equivalent senior talent (Fractional Work Report) |
| Fractional CMOs triple pipeline | Unverifiable | Vendor case studies with no sample or control |
| Marketing budgets are 7.8% of revenue | Supported | Gartner 2026 CMO Spend Survey, n=401 |
A 90-day measurement plan
The cheapest way to make a part-time engagement accountable is to spend the first quarter building the instruments rather than chasing a number. This is the sequence we use when a client adds outside marketing leadership on top of an existing team or an existing creative and paid media programme.
| Phase | Days | Deliverable | Stop condition |
|---|---|---|---|
| Baseline | 1-30 | Documented CAC, payback, pipeline and channel mix | No agreed baseline by day 30 means the engagement is not measurable |
| Prioritise | 31-60 | Written plan with three bets and what is being stopped | More than five priorities means nothing was prioritised |
| Prove | 61-90 | One channel or funnel stage moved against baseline | No movement and no explanation triggers the resize conversation |
| Decide | 90 | Renew, resize or exit, against the tier-three outcomes | Automatic renewal without a scorecard review |
How to use these numbers without being misled
Three rules cover most of the risk. First, separate input data from outcome claims: tenure, rate, hours and adoption figures are observable and citable, while performance multiples usually are not. Second, check the population behind every figure - Gartner's survey is dominated by companies above USD 1 billion in revenue, and Spencer Stuart measures the S&P 500, so neither describes a twenty-person business directly. Third, write the scorecard before the start date. An engagement that begins without a baseline usually ends in a disagreement about whether it worked.
If you want a second opinion on the scorecard itself, our team is happy to look at it - get in touch and bring your current numbers.
Frequently Asked Questions
What KPIs should a fractional CMO be measured on?
Three tiers, agreed before the engagement starts. Leading indicators reviewed weekly: qualified pipeline created, MQL-to-SQL conversion, and content or campaign throughput. Efficiency metrics reviewed monthly: blended customer acquisition cost, CAC payback period, and cost per qualified opportunity. Structural outcomes reviewed quarterly: positioning, measurement infrastructure, team capability and the plan the company keeps after the engagement ends. The last tier matters most because a part-time leader is bought for judgement and systems, not for daily execution volume.
How many hours a week does a fractional CMO actually work?
Go Fractional's 2026 benchmark data puts the typical scope at roughly nine hours a week, about 23% of a full-time week or 468 hours a year. Retainer-based engagements are often larger: Fractional Pulse reports a median retainer of USD 10,000 to USD 12,000 a month covering 15 to 25 hours of work. The spread matters when you write KPIs, because a nine-hour week buys strategy and oversight while a 20-hour week can also buy hands-on execution.
How long should a fractional CMO engagement run?
Most run nine to 18 months according to Fractional Pulse's 2026 pricing data. That window is long enough to fix positioning, rebuild measurement and prove one or two acquisition channels, and short enough that the company is not paying senior rates for maintenance work. Set a review gate at 90 days and a decision gate at six months, with explicit criteria for renewing, resizing or exiting.
What is a realistic CAC payback benchmark to hold marketing to?
For B2B software, the widely cited KeyBanc and Sapphire survey of more than 939 private companies puts median CAC payback at about 20 months on a new-business-only basis and 23 months fully loaded, while strong performers sit under 18 months. Those are software numbers. Services and commerce businesses have shorter cycles and should use their own gross-margin-adjusted payback, which is why the first job of any marketing leader is usually establishing the baseline rather than beating one.
Is there reliable outcome data on fractional CMO performance?
Not yet, and that is the honest answer. Rate, tenure and adoption data come from credible sources such as Spencer Stuart, Gartner and the Fractional Work Report. Outcome claims - revenue lifts, pipeline multiples, cost-per-opportunity improvements - overwhelmingly come from firms selling the service and rarely disclose sample size or methodology. Treat any single-case percentage as marketing, and build your own baseline in the first 30 days instead.
Sources
Spencer Stuart - CMO Tenure 2026 Snapshot
Gartner 2026 CMO Spend Survey (Business Wire release)
Gartner 2025 CMO Spend Survey
Go Fractional - Fractional CMO Benchmarks 2026
Fractional Pulse - Fractional CMO Cost 2026
Fractional Jobs - The Fractional Work Report 2026
H1 2026 B2B SaaS GTM Benchmark Report


