



Table of contents
Food Service & Catering Analytics Statistics
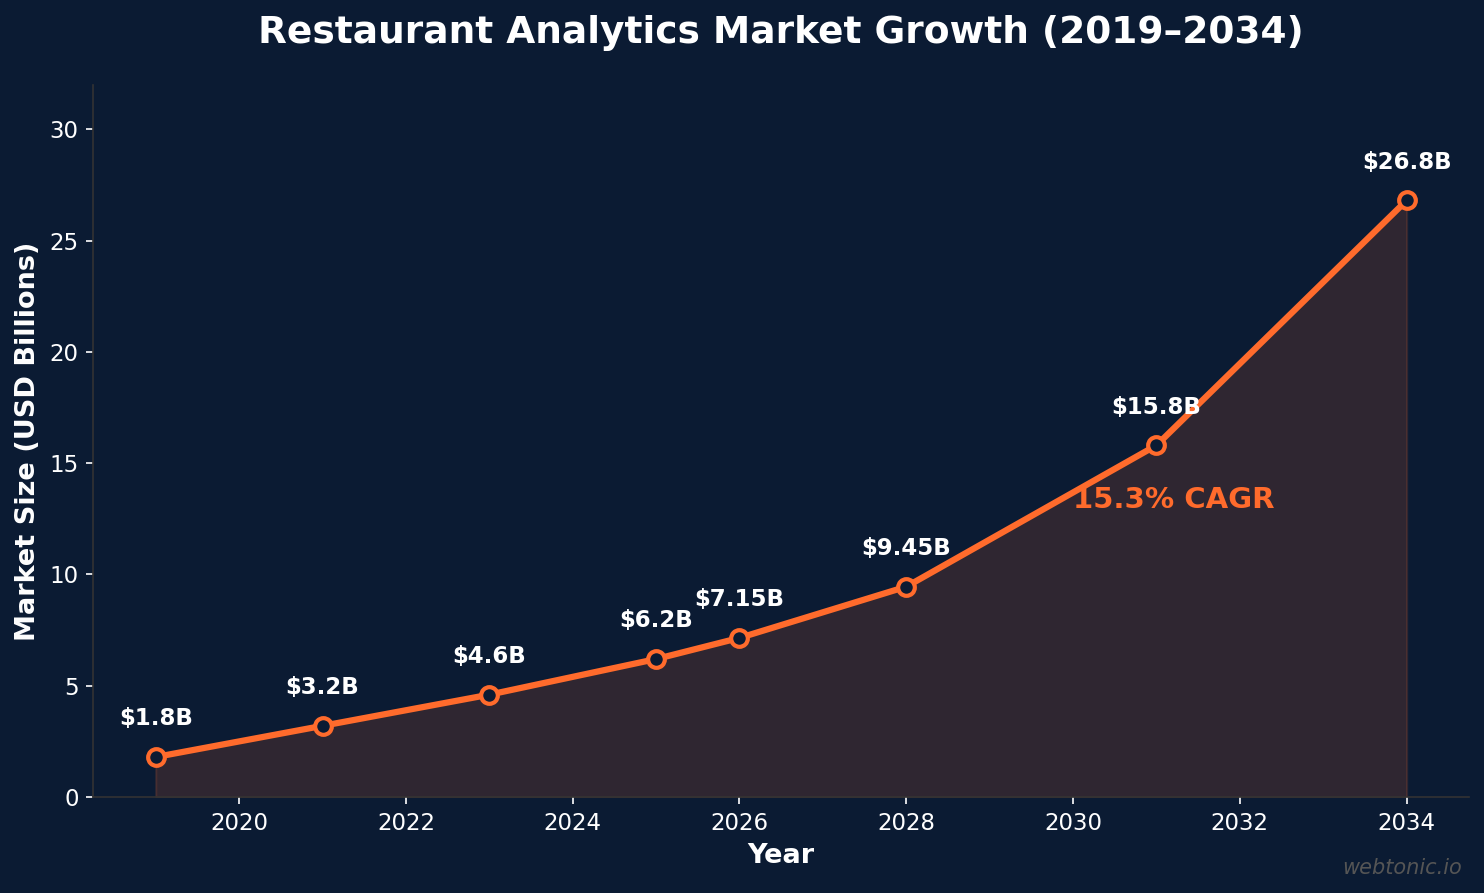
The restaurant analytics market is valued at $6.2 billion in 2025 and projected to reach $26.8 billion by 2034. Here are the analytics and data benchmarks transforming food service and catering operations in 2026.
Key Takeaways
- Restaurant analytics market valued at $6.2 billion in 2025, projected to reach $26.8 billion by 2034 at a 15.3% CAGR (MarketIntelo)
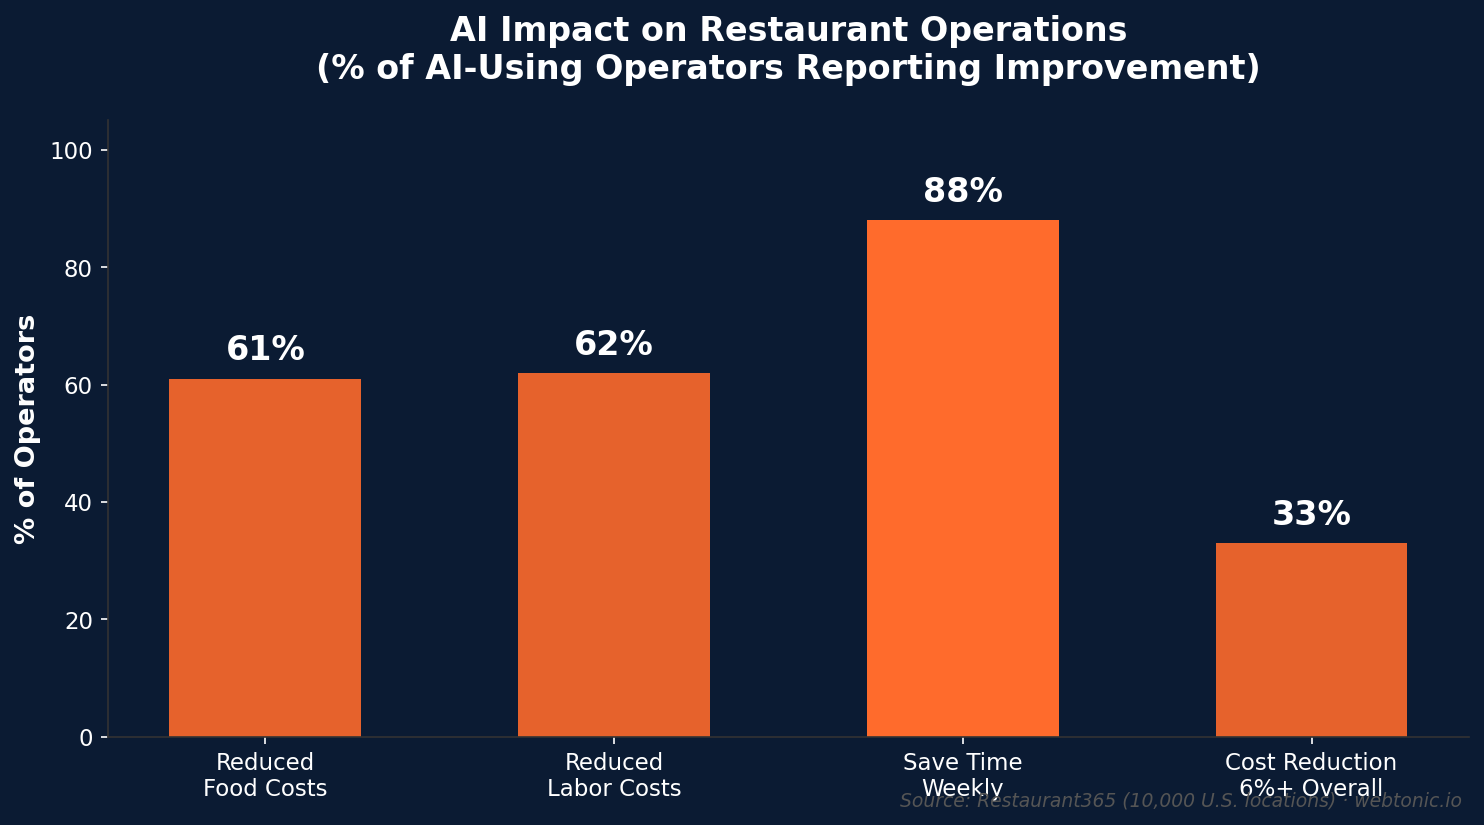
- 61% of AI-using restaurant operators reduced food costs and 62% reduced labor costs, per Restaurant365's survey of nearly 10,000 U.S. locations
- 88% of AI-using operators save time every week, reclaiming hours previously spent on manual scheduling, inventory, and payroll (Restaurant365)
- The catering POS system market reached $3.12 billion in 2025, anchoring the operational analytics stack for food service businesses (Verified Market Reports)
- 74% of hospitality businesses use online marketing, but only 19% of independent restaurants invest in SEO analytics (BrightLocal/Searchlab)
- 3 in 4 restaurant operators describe their most recent month as profitable, yet food costs (70%+) and labor costs (mid-50s%) remain the top operational challenges (Datassential)
- Food delivery now accounts for 22% of global foodservice spending, up from 9% in 2019, driving a surge in delivery analytics tools (Euromonitor)
- The U.S. now has nearly 859,000 active restaurants, with 2,400 new openings versus 1,250 closures per month (Datassential)
Restaurant Analytics Market Overview
The global restaurant analytics market represents one of the fastest-growing segments in food service technology. According to MarketIntelo's 2034 forecast, the market grew from $1.8 billion in 2019 to $6.2 billion in 2025, and is projected to reach $26.8 billion by 2034 at a compound annual growth rate of 15.3%.
The software segment holds the largest share at 72.5%, reflecting the industry's shift from hardware-centric POS systems to cloud-based analytics platforms. Asia Pacific dominates with 38.2% of global revenue share, driven by rapid digital adoption in large-scale restaurant chains across the region. Key market drivers include digital transformation in foodservice, real-time decision-making, customer experience optimization, and labor cost management through data analytics.
| Year | Market Size (USD Billion) | Growth Note |
|---|---|---|
| 2019 | $1.8B | Pre-pandemic baseline |
| 2021 | $3.2B | Pandemic-accelerated adoption |
| 2023 | $4.6B | Cloud migration wave |
| 2025 | $6.2B | AI integration begins |
| 2026 | $7.15B | Projected current year |
| 2028 | $9.45B | Mid-range forecast |
| 2034 | $26.8B | 15.3% CAGR terminus |
AI and Analytics Adoption in Restaurants
The impact of AI-powered analytics on restaurant profitability is no longer theoretical. Restaurant365's 2026 Mid-Year Report, surveying over 420 operators representing nearly 10,000 U.S. locations, quantifies what the company calls the "Restaurant Profitability Gap" — a measurable performance divide between AI-adopting and non-adopting operators:
- 61% of AI-using operators reduced food costs through predictive inventory analytics and waste reduction
- 62% reduced labor costs using AI-powered scheduling and forecasting tools
- 88% report saving time every week — time that managers redirect to floor operations and staff coaching
- Nearly one-third of AI users reported overall cost reductions of 6% or more
- The top three AI use cases are reporting and analytics, scheduling, and inventory forecasting
Major restaurant chains have separately reported cost reductions of 8–12% through predictive inventory analytics and labor optimization, according to MarketIntelo's industry analysis. For catering operations where food waste and labor scheduling are even more variable than in daily-service restaurants, the ROI potential of analytics is proportionally larger.
Operational Analytics Benchmarks
Datassential's 2026 industry data provides the operational baseline that analytics platforms are built to optimize. The numbers paint a picture of an industry that is profitable but margin-constrained:
| Operational Metric | 2026 Value | Source |
|---|---|---|
| Active U.S. restaurants | ~859,000 | Datassential Table Stakes Tracker |
| Monthly openings | ~2,400 | Datassential |
| Monthly closures | ~1,250 | Datassential |
| Operators reporting profitable month | ~75% | Datassential Operator Survey |
| Top cost challenge: food costs | 70%+ cite | Datassential |
| Top cost challenge: labor costs | Mid-50s% cite | Datassential |
| Projected U.S. industry sales | $1.55 trillion | National Restaurant Association |
These benchmarks explain why analytics adoption is accelerating: in an industry with 859,000 active locations and $1.55 trillion in projected U.S. sales, even small percentage improvements in food waste reduction or labor scheduling efficiency translate to billions in aggregate savings. The 2,400-to-1,250 ratio of monthly openings to closures also signals that operators who invest in data-driven operations are more likely to survive.
POS and Technology Analytics Infrastructure
The POS system serves as the data backbone for restaurant analytics. According to Verified Market Reports, the global catering POS system market reached $3.12 billion in 2025, reflecting the industry's transition from basic transaction processing to integrated analytics platforms.
Modern POS analytics capture transactional data, customer behavior patterns, inventory fluctuations, and operational metrics in real time. The integration of AI and machine learning into these platforms automates pattern recognition, enabling operators to anticipate customer preferences, forecast demand, and respond to operational challenges before they impact service quality. Cloud-based solutions are democratizing access to sophisticated analytics for smaller establishments that previously lacked the capital for on-premises systems.
Restaurant technology data shows that mobile ordering now accounts for 54% of all digital restaurant orders, up from 38% in 2023 (NRA Restaurant Technology Report), generating a massive data stream that feeds into analytics platforms for growth marketing optimization.
Delivery and Food Service Data Analytics
The delivery channel has become a critical analytics surface. According to MakeMyReceipt's verified statistics, food delivery now accounts for approximately 22% of global foodservice spending, up from just 9% in 2019 (Euromonitor). This shift has created an entirely new data layer that operators must analyze:
- DoorDash processed 3.2 billion orders on $102 billion in gross order value in 2025, growing 23% year-over-year
- DoorDash controls approximately 60.7% of the U.S. food delivery market, followed by Uber Eats at 26.1% and Grubhub at 6.3%
- U.S. food-away-from-home spending reached approximately $1.4 trillion, about 56% of all food spending (USDA ERS)
- Commission fees on delivery platforms average 25–35% per order, making delivery analytics essential for margin management
- Restaurants with their own online ordering retain 15–20% more margin per order compared to third-party platforms (Toast POS Data)
For catering companies, delivery analytics tools track order volume, peak demand windows, menu item profitability, and customer acquisition costs across platforms — data points that directly inform pricing, staffing, and marketing budget allocation.
Marketing Analytics Benchmarks for Food Service
Marketing analytics forms a critical subset of the restaurant analytics market. Searchlab's 2026 hospitality data reveals the current state of marketing analytics adoption:
| Marketing Analytics Metric | 2026 Value | Source |
|---|---|---|
| Hospitality businesses doing online marketing | 74% | Searchlab / Industry Research |
| Using social media as marketing channel | 89% | NRA Tech Report 2026 |
| Maintaining a Google Business Profile | 76% | BrightLocal 2026 |
| Actively spending on paid digital ads | 38% | Hospitality Digital Index |
| Investing in SEO | 19% | BrightLocal |
| Monthly online marketing spend | $450–$1,350 | Hospitality Marketing Benchmark |
| Marketing as % of revenue | 3–5% | Hospitality Marketing Benchmark |
A significant analytics gap exists: while 89% of hospitality businesses use social media as a marketing channel, only 19% actively invest in SEO analytics. This leaves substantial local search opportunity untapped, particularly for catering companies where high-intent event-specific searches like "corporate catering near me" drive the highest-value inquiries.
Restaurants with a dedicated digital marketing strategy — one that tracks analytics across channels — see 2.4× more online bookings than those without, according to OpenTable Insights. Meanwhile, ghost kitchens (delivery-only concepts) allocate 12–18% of revenue to marketing, nearly triple the typical restaurant rate, because they rely entirely on digital visibility and analytics-driven customer acquisition.
Analytics Best Practices for Food Service and Catering
- Start with POS data integration. Modern analytics platforms layer on top of POS systems. Ensure your POS captures transaction-level data, customer behavior patterns, and inventory metrics in real time.
- Implement predictive inventory analytics. With 70%+ of operators citing food costs as their top challenge, AI-powered forecasting reduces waste and improves margin. Restaurant365 data shows 61% of AI users achieve measurable food cost reductions.
- Use AI scheduling tools. Labor costs rank second among operator concerns. AI-driven scheduling optimization has helped 62% of adopters reduce labor costs, with some achieving 6%+ overall cost reductions.
- Track delivery channel economics separately. With 25–35% commission fees per order, delivery profitability requires granular analytics. Restaurants with their own ordering systems retain 15–20% more margin per order.
- Close the SEO analytics gap. Only 19% of independent restaurants invest in SEO, yet organic search typically drives more inquiries than any other channel for catering companies. Install basic analytics tracking on your Google Business Profile and website.
- Benchmark against industry medians. A profitable month for 75% of operators sets the floor. Use analytics to identify which specific line items — food, labor, marketing — deviate from industry benchmarks and where margin recovery is possible.
- Monitor customer acquisition cost by channel. Food service businesses spend $450–$1,350 monthly on marketing. Analytics should break down the cost per booking or lead per channel to optimize allocation.
Food Service Analytics vs. Other Industries
| Analytics Metric | Food Service / Catering | Retail / E-commerce | Healthcare |
|---|---|---|---|
| Market CAGR | 15.3% | 12.8% | 14.1% |
| AI adoption impact (cost reduction) | 6%+ for 1/3 of adopters | 5–8% avg | 7–10% avg |
| Marketing analytics maturity | Low (19% SEO) | High (65%+ SEO) | Medium (40% SEO) |
| Data sources per operator | 3–5 (POS, delivery, social) | 8–12 | 5–8 (EHR, billing) |
| Cloud adoption rate | Growing rapidly | ~80% | ~60% |
Food service analytics is growing faster than most adjacent industries (15.3% CAGR vs. 12.8% for retail), partly because the starting base was lower. The marketing analytics maturity gap — with only 19% SEO adoption versus 65%+ in retail — represents both the biggest risk and the biggest opportunity for food service operators willing to invest in data-driven marketing tools.
FAQ
How big is the restaurant analytics market?
The global restaurant analytics market was valued at $6.2 billion in 2025 and is projected to reach $26.8 billion by 2034, growing at a 15.3% CAGR. The software segment holds the largest share at 72.5%, with cloud-based solutions driving adoption among smaller operators.
What percentage of restaurants use AI for analytics?
According to Restaurant365's survey of nearly 10,000 U.S. locations, the majority of operators have begun exploring AI tools. Among those actively using AI, 61% report reduced food costs, 62% report reduced labor costs, and 88% save time every week. The top three use cases are reporting and analytics, scheduling, and inventory forecasting.
How much do restaurants spend on analytics and marketing technology?
The average hospitality business spends $450 to $1,350 per month on online marketing, equivalent to 3–5% of revenue. The catering POS system market alone is $3.12 billion globally. The U.S. SBA recommends 7–8% of revenue for restaurants under $5 million — a higher threshold than the industry average.
What operational metrics do restaurant analytics platforms track?
Modern platforms track transaction data, customer behavior patterns, inventory fluctuations, labor scheduling efficiency, delivery channel economics, marketing ROI, and food waste metrics. Major chains have reported 8–12% cost reductions through predictive inventory and labor optimization. The integration of AI automates pattern recognition to forecast demand and respond to issues before they impact operations.
How does food delivery data impact analytics strategy?
Food delivery accounts for 22% of global foodservice spending, up from 9% in 2019. DoorDash alone processed 3.2 billion orders on $102 billion in gross order value in 2025. With commission fees averaging 25–35% per order, delivery analytics has become essential — restaurants with their own ordering systems retain 15–20% more margin per order than those relying solely on third-party platforms.
Sources
MarketIntelo — Restaurant Analytics Market Research Report 2034
Fast Casual — AI in Restaurants: Restaurant365 2026 Mid-Year Report
Datassential — Foodservice Industry Trends 2026
Searchlab — Hospitality Marketing Statistics 2026
MakeMyReceipt — Food Delivery Statistics 2026
Verified Market Reports — Catering POS System Market 2026–2034
Restroworks — Restaurant Social Media Statistics
National Restaurant Association — 2026 State of the Industry


