Table of contents

Marketing dashboards promise real-time visibility, yet up to 90% of BI dashboards go unused after six months and only 16% of organizations achieve full dashboard adoption. For fitness businesses tracking member acquisition, retention, and campaign ROI, the gap between available data and actionable insight remains wide. These 2026 statistics reveal where dashboard adoption stands and what separates high-performing fitness marketers from the rest.
Key Takeaways
- 53% of marketing teams use dashboards to track performance weekly or more often.
- 90% of BI dashboards go unused after six months — adoption is the real challenge.
- 87% of marketing leaders say data-driven decisions are critical to strategy.
- Only 32% of marketers express high confidence in their data quality.
- 11.7% average share of marketing budget allocated to analytics and measurement.
- 56% of marketing teams now use AI-powered analytics tools for reporting.
- $640 average fitness customer lifetime value — the core metric dashboards should track.
Fitness Marketing Dashboard Benchmarks at a Glance
This table summarizes the key dashboard and analytics metrics fitness marketers should benchmark against in 2026.
| Metric | Value | Source |
|---|---|---|
| Weekly+ dashboard usage | 53% of teams | gitnux.org |
| BI dashboards unused (6 mo) | Up to 90% | owox.com |
| Full dashboard adoption | 16% of orgs | owox.com |
| Data-driven priority (leaders) | 87% | digitalapplied.com |
| High confidence in data | 32% | digitalapplied.com |
| Analytics budget share | 11.7% | digitalapplied.com |
| AI analytics adoption | 56% | digitalapplied.com |
| Fitness avg CLV | $640 | cufinder.io |
| Monthly churn rate | 6.5% | cufinder.io |
| Day-30 app retention | 12% | cufinder.io |
Dashboard Adoption and Usage Trends
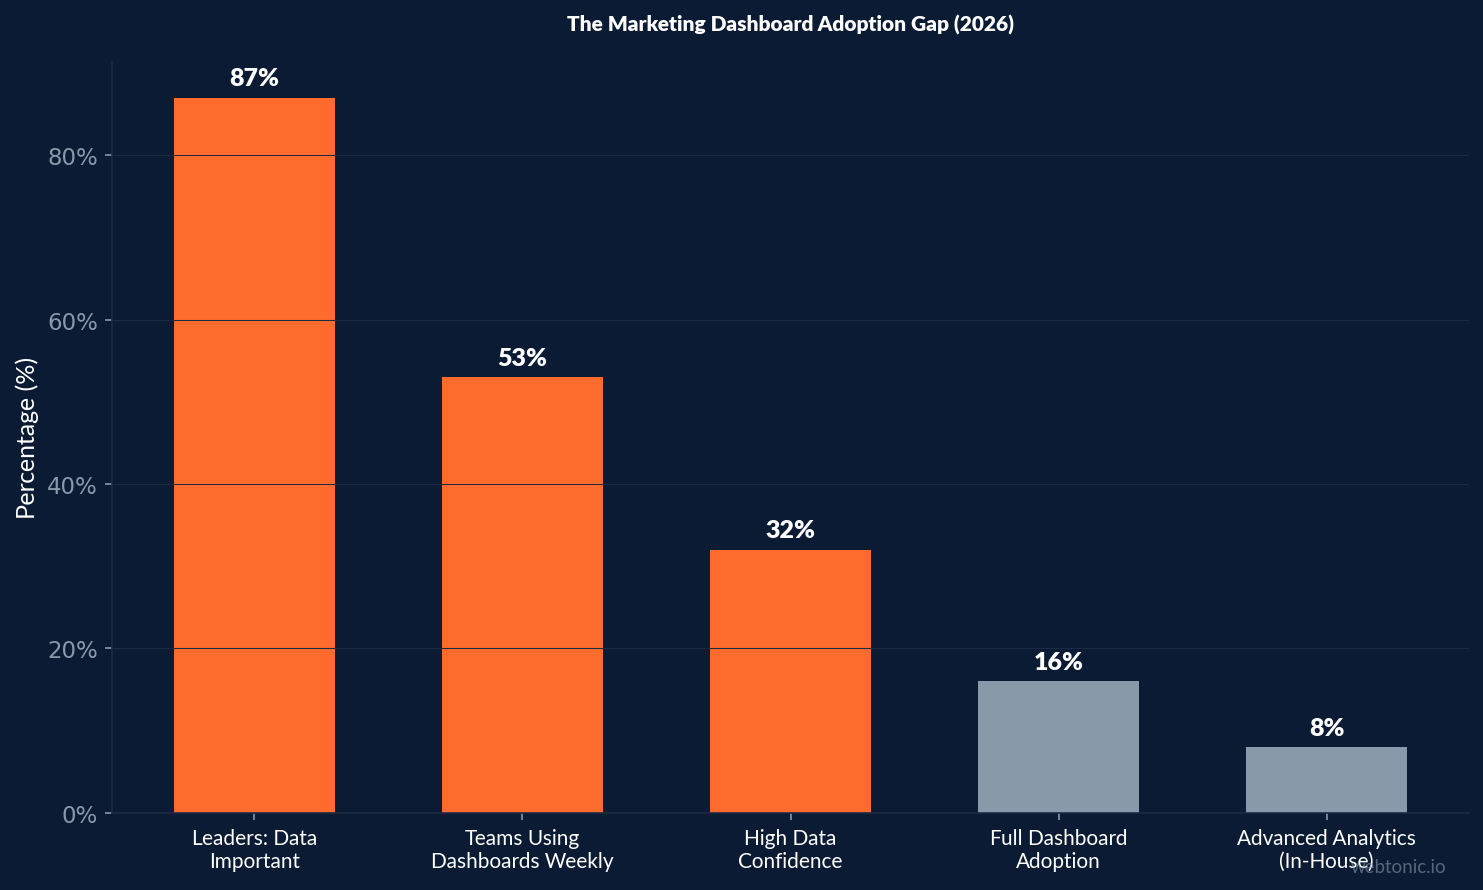
53% of marketing teams use dashboards to track performance weekly or more often, according to a gitnux.org survey of HubSpot users. Yet this headline number masks a deeper problem: owox.com reports that up to 90% of BI dashboards go unused within six months of deployment, and only 16% of organizations achieve full adoption.
The disconnect is even more pronounced in fitness. Most gym management platforms offer built-in reporting, but owners often default to spreadsheets because dashboard interfaces don't align with the decisions they actually make — daily class scheduling, membership pricing adjustments, and seasonal promotional timing. The dashboards that survive are those built around 3–5 KPIs the owner checks every morning, not comprehensive 30-metric views.
Advanced analytics usage remains low: only 21% of agency marketers and 8% of in-house marketers consistently use advanced analytics beyond basic reporting, per Funnel's 2026 Marketing Intelligence Report. This gap creates a competitive advantage for fitness businesses that invest in analytics maturity — the 16% of organizations with full dashboard adoption consistently outperform on marketing efficiency because they can identify underperforming campaigns weeks before competitors relying on monthly manual reviews.
Dashboard design matters as much as data quality. The most effective fitness marketing dashboards follow a "glance, scan, commit" hierarchy: a single headline number (e.g., new members this week), supporting context metrics (CPL, conversion rate, channel breakdown), and drill-down capability for investigation. Dashboards that require more than 10 seconds to answer the question "are we on track?" fail the adoption test. Gym owners check dashboards between classes and client sessions — the interface must respect that time constraint.
The Data Quality Gap
87% of marketing leaders say data-driven decisions are critical to strategy, but only 32% express high confidence in their data quality — a 55-percentage-point gap between perceived importance and execution confidence, per digitalapplied.com.
For fitness businesses, data quality issues stem from fragmented systems. A typical gym runs separate platforms for paid advertising, membership management, class scheduling, point-of-sale, and email marketing. Without integration, dashboards display incomplete pictures. 80%+ of marketers surveyed by Funnel say they don't have a clear signal that helps them understand what's working.
The solution isn't more dashboards — it's fewer, better-connected ones. Organizations with formalized analytics processes reached 44% adoption, nearly triple the rate of those without structured data governance. Fitness operators should consolidate their marketing data into a single source of truth before investing in visualization layers.
The financial impact of poor data quality is measurable. Teams with low data confidence spend 30–40% more time on data verification than on actual analysis, according to industry surveys. For a fitness marketing team spending 10 hours per week on reporting, that translates to 3–4 hours wasted on checking whether numbers are correct rather than making decisions based on them. Clean, automated data pipelines eliminate this tax entirely.
A related challenge is cross-system data reconciliation. When a gym's ad platform reports 50 conversions but the CRM shows only 35 new leads, the marketing team spends hours reconciling the discrepancy rather than optimizing campaigns. This gap typically stems from attribution window differences, duplicate leads, and delayed sync between systems. The best-performing fitness dashboards include a data health score — a simple metric showing the match rate between ad platform conversions and CRM entries — so data quality issues are visible immediately rather than discovered during monthly reviews.
Essential Fitness Marketing KPIs
This table maps the critical KPIs every fitness marketing dashboard should track, with the 2026 benchmarks for each.
| KPI | 2026 Benchmark | Why It Matters |
|---|---|---|
| Cost per lead (CPL) | $44.50 | Primary acquisition efficiency metric |
| Lead-to-member CVR | 10–15% (avg), 20%+ (top) | Measures sales process effectiveness |
| Customer lifetime value | $640 | Determines max allowable CAC |
| Monthly churn rate | 6.5% | Retention drives long-term profitability |
| Annual retention rate | 74% | Industry-wide membership stability |
| App retention (Day 30) | 12% | Digital engagement stickiness |
| Marketing ROI | 4.2:1 | Overall return across digital channels |
Sources: cufinder.io, gitnux.org, and pilotium.cc.

AI and Automation in Marketing Reporting
56% of marketing teams now use AI-powered analytics tools, and AI-driven forecasting improves accuracy by 28–35% over traditional statistical methods, according to digitalapplied.com. The shift from static dashboards to AI-powered insight engines is the defining trend in marketing reporting for 2026.
Automation is accelerating: AI agent adoption among marketers grew from 4% in 2023 to 45% in 2026, with enterprise adoption reaching 67% in the same year (digitalapplied.com). For fitness businesses, this means dashboards are evolving from passive monitoring tools to proactive alert systems that surface anomalies — like a sudden spike in cancellations or a campaign cost-per-lead exceeding targets — without requiring manual review.
CMOs allocate 15.3% of marketing budgets to AI, though only 30% feel ready to scale AI capabilities, per Gartner's 2026 CMO Spend Survey reported by christopholivierconsulting.com. The gap between investment and readiness suggests many teams are buying tools faster than they can operationalize them.
Dashboard ROI and Cost Benchmarks
The average marketing organization spends 11.7% of its total marketing budget on analytics and measurement. For context, a typical gym spending $5,000/month on advertising should allocate roughly $585/month toward measurement infrastructure — covering tools, integration, and the time spent interpreting data.
| Tool Category | SMB Cost (Annual) | Enterprise Cost (Annual) | Typical ROI Timeline |
|---|---|---|---|
| Web analytics platform | $48K/yr | $180K/yr | 4–6 months |
| Customer data platform | $120K/yr | $420K/yr | 8–12 months |
| Gym management software | $1.2K–$6K/yr | $12K–$50K/yr | 1–3 months |
| Marketing attribution tool | $12K–$36K/yr | $80K–$200K/yr | 6–9 months |
For small fitness operators, integrated data platforms that bundle analytics, attribution, and reporting are more cost-effective than assembling a custom stack. The key metric to track is time-to-insight — how quickly a dashboard finding turns into a budget or campaign decision.
The cost gap between SMB and enterprise analytics tools reflects a fundamental difference in data volume and complexity. A single-location gym generating 200–500 leads per month can operate effectively with free or low-cost tools. Multi-location fitness chains managing thousands of leads across disparate systems need enterprise solutions to maintain data consistency. The inflection point typically comes at 3–5 locations, where manual reporting breaks down and automated dashboards become a necessity rather than a luxury.
Best Practices for Fitness Marketing Dashboards
- Limit dashboards to 3–5 core KPIs — revenue per member, CPL, churn rate, CLV, and campaign ROAS. More metrics reduce adoption, not improve decisions.
- Set automated alerts for anomaly detection — flag when CPL exceeds $44.50 or churn rises above 6.5% rather than requiring daily manual checks.
- Integrate your CRM with ad platforms to close the reporting loop between ad click and membership activation (Facebook Ads and Google Ads both support offline conversion uploads).
- Review dashboards weekly, not daily — 53% of high-performing teams use weekly review cadences, which balances data freshness against noise from daily fluctuations.
- Benchmark against industry medians — a 4.2:1 marketing ROI and $640 CLV are the fitness industry averages; track your gap to these benchmarks over time.
- Invest in first-party data collection — 88% of brands will have first-party data strategies by 2027, making CRM-driven dashboards the future of fitness analytics.
- Build dashboards around decisions, not data — every dashboard view should answer a specific question: "Which campaigns should I scale this week?" or "Where are leads dropping off?" If a metric doesn't inform a decision, remove it.
- Track time-to-insight as a KPI — measure how quickly dashboard data translates into campaign changes. Top-performing teams act on data within 24–48 hours of identifying an anomaly, while underperformers wait until the next monthly review cycle.
Dashboard Platform Comparison for Fitness
Fitness operators can choose from gym-specific platforms with built-in dashboards or general marketing analytics tools. The right choice depends on business size and data maturity.
| Platform Type | Examples | Strengths | Limitation |
|---|---|---|---|
| Gym management suites | Glofox, Mindbody, ABC Ignite | Member lifecycle, class utilization, revenue tracking | Weak on ad spend attribution |
| Marketing analytics | Google Analytics 4, HubSpot | Web traffic, campaign performance, conversion tracking | No gym-specific KPIs |
| BI / visualization | Power BI, Looker, Metabase | Custom dashboards, cross-source integration | Requires data engineering setup |
| Fitness-specific BI | GymViz, Shredeo, FLiiP | Pre-built KPI dashboards, industry benchmarks | Limited marketing channel coverage |
Every metric exposed via REST API in modern gym platforms like GymViz means fitness operators can pipe data into BI tools like Power BI or Google Sheets for deeper analysis (gymviz.app). The winning strategy for most mid-size gyms is to combine a gym management platform for operational KPIs with GA4 or a lightweight BI tool for campaign performance tracking.
Reporting Automation Trends
Manual reporting is being displaced by automation at an accelerating rate. Marketing automation adoption has grown from 4% (AI agents) in 2023 to 45% in 2026, with enterprise adoption reaching 67% (digitalapplied.com). For fitness businesses, reporting automation means less time pulling numbers and more time acting on them.
The most impactful automation for gyms is anomaly-based alerting — dashboards that proactively notify owners when metrics deviate from expected ranges. Rather than checking a dashboard every morning, an automated system flags when weekly new leads drop below the 4-week moving average or when a campaign's CPL exceeds the $44.50 benchmark.
First-party data strategy adoption is projected to reach 88% by 2027 (up from 71% in 2026), making CRM-driven dashboards the foundation of future fitness analytics. Gyms that invest in collecting and structuring their membership data today will have a significant reporting advantage as third-party cookies phase out and platform-reported conversions become less reliable.
The practical recommendation from leadresponse.co: automate the data collection and basic reporting layers, but keep human judgment in the analysis loop. Automated dashboards surface the "what"; experienced marketers provide the "why" and "what next."
Reporting frequency also matters for dashboard design. Weekly reporting cadences outperform daily monitoring for most fitness businesses because daily metrics fluctuate too much to be actionable — a single slow day can trigger unnecessary panic. The exception is during campaign launches or seasonal promotions (January resolution season, summer body campaigns), where daily or even hourly monitoring ensures rapid response to underperforming creative or overspending budgets. Structuring dashboard views with a default weekly summary and an optional daily drill-down accommodates both needs without overwhelming the user with noise.
Frequently Asked Questions
What KPIs should a fitness marketing dashboard track?
The essential KPIs are cost per lead ($44.50 median), lead-to-member conversion rate (10–15%), customer lifetime value ($640), monthly churn rate (6.5%), and marketing ROI (4.2:1). These five metrics cover acquisition efficiency, conversion quality, retention health, and overall return. Keep the dashboard focused — tracking more than 5–7 KPIs reduces adoption and decision speed.
Why do most marketing dashboards fail?
Up to 90% of BI dashboards go unused after six months because they're built for comprehensiveness rather than decision-making. The most common failures are excessive metrics, poor data quality (only 32% of marketers trust their data), and disconnected data sources. Successful dashboards are built around specific questions the business owner asks every week.
How much should a gym spend on analytics tools?
The industry average is 11.7% of the marketing budget. For a gym spending $5,000/month on ads, that's roughly $585/month. Start with free tools (Google Analytics 4, platform-native dashboards from Glofox or Mindbody) and upgrade to paid analytics only when you've exhausted free-tier capabilities.
How is AI changing marketing dashboards?
AI-powered analytics tools are now used by 56% of marketing teams and improve forecast accuracy by 28–35%. For fitness businesses, AI transforms dashboards from passive displays into proactive systems that surface anomalies (unexpected churn spikes, CPL increases) and suggest budget adjustments automatically.
What is the biggest data challenge for fitness marketers?
The 55-percentage-point gap between data importance and confidence (87% say data is critical, but only 32% trust it). This stems from fragmented systems — gyms typically run 3–5 separate platforms that don't share data cleanly. Integration is the foundation; without it, even the best dashboard displays unreliable numbers.
Sources
digitalapplied.com — Marketing Analytics Statistics 2026
gitnux.org — Marketing Analytics Statistics
owox.com — Why Dashboards Fail
funnel.io — 2026 Marketing Intelligence Report
cufinder.io — Fitness and Wellness Industry Benchmarks 2026
pilotium.cc — State of Gym Marketing 2026
gitnux.org — Marketing in the Fitness Industry Statistics
digitalapplied.com — Marketing Automation Statistics 2026
christopholivierconsulting.com — CMO Marketing Budget Statistics 2026