



Table of contents
Key Takeaways
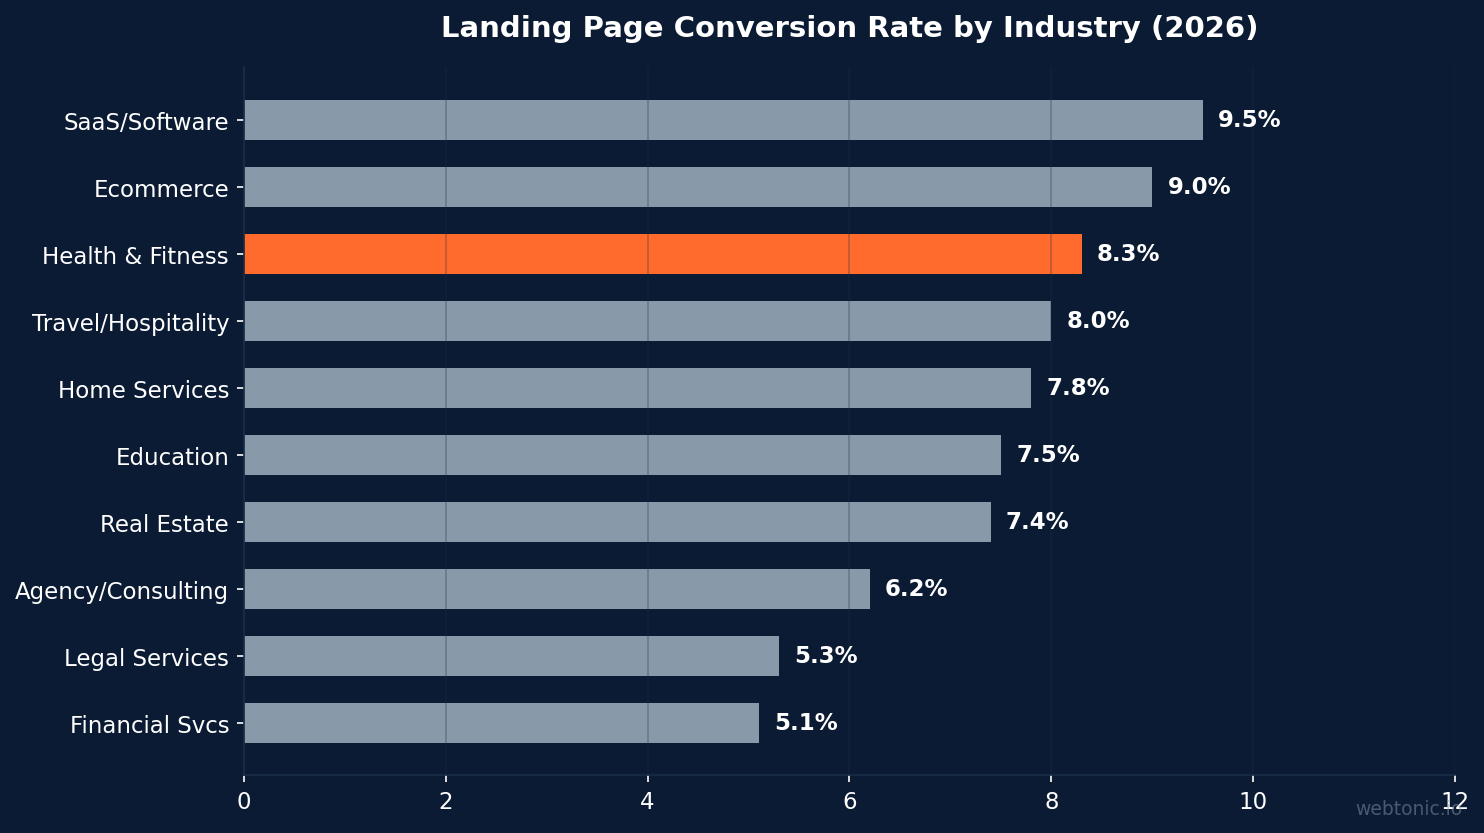
- Health and fitness landing pages convert at 8.3% on average, ranking third across all industries behind SaaS (9.5%) and ecommerce (9.0%).
- Gym landing pages converting 10–20% of visitors into leads are considered well-optimized, while pages below 5% typically signal weak offers or poor ad-to-page message match.
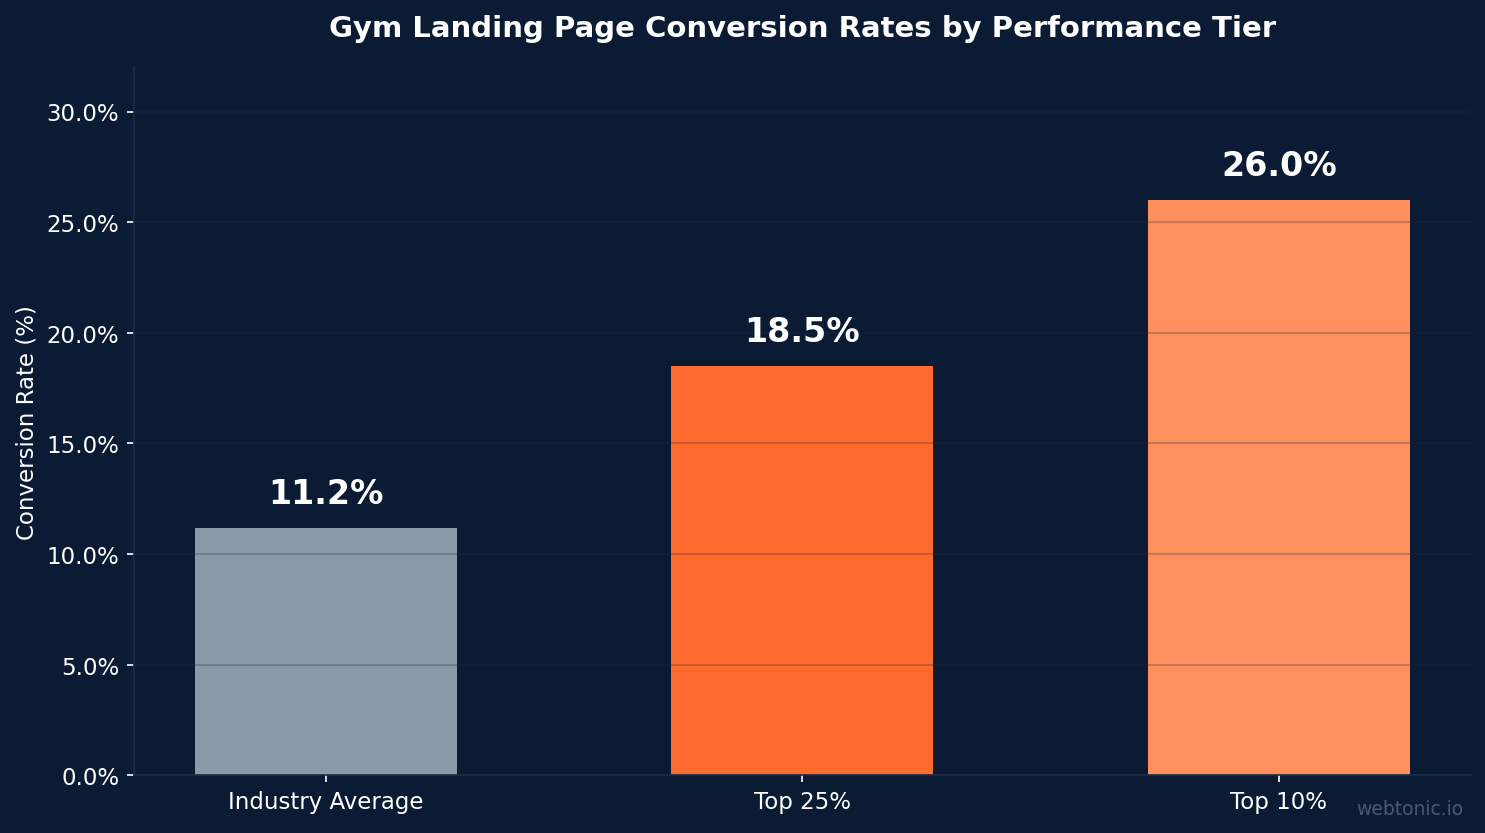
- Top 10% of fitness landing pages reach 26.0% conversion rates, nearly 2.3× the industry average of 11.2%.
- Speed to first contact averages 47 hours industry-wide, but top-performing gyms respond within 5 minutes and close at 78% tour-to-member rates.
- A/B testing on fitness pages has produced conversion lifts of 14–70%, with the strongest gains coming from simplified hero sections and single-CTA layouts.
- CRO-optimized wellness landing pages saw 67% higher conversion rates and 42% lower customer acquisition costs in controlled case studies.
- Mobile drives 72.4% of all fitness traffic, yet mobile bounce rates sit 9.1 percentage points higher than desktop, making mobile-first design critical.
- Fitness websites with video content convert 53% higher than those without, and pages with social proof sections see 15–25% conversion lifts.
Fitness Landing Page Benchmarks at a Glance
Before diving into the specifics, here is a snapshot of the metrics that define fitness landing page performance in 2026. These benchmarks are drawn from multi-source data covering thousands of gym and wellness campaigns.
| Metric | Industry Average | Top 25% | Top 10% |
|---|---|---|---|
| Landing page CVR | 11.2% | 18.5% | 26.0% |
| Cross-industry fitness LP CVR | 8.3% | — | 11%+ |
| Overall website CVR | 3.2% | — | 5.8% |
| Ad click-through rate | 1.4% | 2.8% | 4.2% |
| Lead-to-appointment rate | 28% | 42% | 58% |
| Tour-to-member conversion | 55% | 68% | 78% |
| Mobile bounce rate | 48.2% | — | — |
| Speed to first contact | 47 hours | 2 hours | 5 minutes |
Where Fitness Landing Pages Stand Among All Industries
Fitness landing pages outperform most verticals. According to Lead Systems Go's 2026 benchmark analysis, health and fitness pages convert at 8.3%, placing third behind SaaS (9.5%) and ecommerce (9.0%). This advantage comes from the low perceived risk of fitness lead magnets — free trials, body assessments, and 7-day challenge signups — which reduce friction at the form-fill stage.
The cross-industry average sits at 4–6% for most landing pages, with the top decile converting at 11%+. Fitness benefits from what Lead Systems Go calls "lifestyle urgency" — the emotional gap between where a prospect is and where they want to be physically. That urgency, paired with concrete first-step offers, drives above-average conversion rates consistently.
CuFinder's 2026 fitness benchmarks break this down further: the overall fitness website conversion rate averages 3.2%, but dedicated landing pages push that to 4.4%. The gap between a full website experience and a focused landing page is significant — landing pages convert 37.5% higher than general product pages (2.6%) because they eliminate navigation distractions and match ad messaging directly.
Understanding these benchmarks matters because many gym owners compare their performance against the wrong numbers. A 3% conversion rate on a full website is average; a 3% rate on a dedicated landing page signals a real problem — typically broken message match, a weak offer, or a slow-loading page. For fitness-specific growth marketing, the goalpost should be 8%+ on dedicated pages.
Conversion Funnel Benchmarks for Gym Landing Pages
The landing page is only one stage in a longer conversion funnel. Pilotium's 2026 State of Gym Marketing report provides the most comprehensive funnel data available, tracking performance from ad click through to paid membership across thousands of U.S. gym campaigns.
The data reveals where gyms actually lose prospects:
| Funnel Stage | Average | Top 25% | Top 10% |
|---|---|---|---|
| Ad CTR | 1.4% | 2.8% | 4.2% |
| Landing page CVR | 11.2% | 18.5% | 26.0% |
| Lead-to-appointment | 28% | 42% | 58% |
| Appointment-to-show | 62% | 75% | 85% |
| Tour-to-member | 55% | 68% | 78% |
| Speed to first contact | 47 hours | 2 hours | 5 minutes |
The biggest conversion gap sits between landing page submission and the appointment stage. The average gym converts only 28% of leads into booked appointments, meaning 72% of form fills go nowhere. PushPress's "Leaky Funnel" analysis confirms that most lost deals happen at follow-up, not at the landing page itself. Speed matters enormously: gyms responding within 5 minutes convert at nearly 3× the rate of those averaging the industry's 47-hour response time.
For gym owners investing in Meta Ads or Google Ads, this means landing page optimization is necessary but insufficient. The entire funnel — from ad click through to membership close — needs to be tracked and improved together.
A/B Testing Results and CRO Case Studies
The gap between average and top-performing fitness landing pages is largely explained by systematic testing. Several documented case studies demonstrate the scale of improvement possible:
- In-Shape Family Fitness ran a controlled A/B test through Dalton's optimization platform that produced a 14% conversion rate increase — from 21.25% to 24.22% — at 100% statistical confidence. Over 90 days, this translated to 7,660 additional membership signups.
- A health and wellness brand working with MAG Growth saw 67% higher landing page conversion rates through CRO focused on message-match alignment, mobile-specific interfaces, and trust validation elements. Customer acquisition cost dropped 42%, and ROAS improved from 1.8× to 3.4×.
- A fitness brand tested by Seer Interactive achieved a 70% increase in PPC conversion rate for free trial signups by redesigning the landing page to match ad messaging more precisely, resulting in a 125% increase in total conversions.
Glofox's gym landing page guide provides a practical framework: a page with 500 visits and 12 sign-ups (2.4%) outperforms one with 2,000 visits and 15 sign-ups (0.75%). They recommend running each A/B test for 2–3 weeks or until reaching 200+ visits per version before drawing conclusions. The takeaway for fitness marketers working with performance creative: testing cadence matters as much as test design.
Mobile vs. Desktop Performance
Mobile dominance in fitness is absolute. CuFinder reports that 72.4% of all fitness industry traffic comes from mobile devices, with desktop at 25.1% and tablets at just 2.5%. This makes mobile-first landing page design non-negotiable for any gym or wellness brand.
However, mobile performance lags desktop on key engagement metrics:
| Metric | Mobile | Desktop | Gap |
|---|---|---|---|
| Traffic share | 72.4% | 25.1% | +47.3 pts mobile |
| Bounce rate | 48.2% | 39.1% | +9.1 pts mobile |
| Avg. visit duration | ~1:48 | ~2:52 | −1:04 mobile |
The 9.1 percentage point bounce rate gap between mobile and desktop represents a massive optimization opportunity. World Metrics data shows that mobile fitness app users are 3.5× more likely to convert to paid services than desktop users — but only when the mobile experience is optimized for speed and simplicity. A 1-second improvement in mobile load time can produce a 20% conversion lift.
For fitness businesses, this creates a clear priority: design landing pages for the mobile experience first, then adapt upward for desktop. Given that 53% of mobile users abandon a page loading longer than 3 seconds, speed optimization is the single highest-ROI technical improvement most gym landing pages can make.
What High-Converting Gym Landing Pages Have in Common
Analysis of top-performing fitness landing pages reveals consistent structural patterns. Well-optimized gym pages converting 10–20% of visitors into leads share these elements:
- Single-action focus: No navigation menus, no footer links, no social media icons. One form, one CTA. Pages with multiple CTAs see conversion drops of 25–30% compared to single-action pages.
- Offer-first headlines: "Get Your First 2 Weeks Free — No Commitment" outperforms gym name or tagline-based headlines. The offer must be stated clearly above the fold.
- Video integration: Fitness websites with video content convert 53% higher than those without. Short facility tours or member testimonials perform best at 30–60 seconds.
- Social proof placement: Star ratings, review counts, and member transformation photos placed near the form increase trust signals. Pages with visible social proof convert 15–25% higher than those without.
- Urgency elements: Limited-time offers, countdown timers, and scarcity cues ("Only 12 spots left for this month's challenge") create action pressure without feeling manipulative when backed by genuine limits.
- Form simplicity: Name, email, and phone number only. Every additional field beyond three reduces conversion rates by approximately 10% per field.
Combining these elements with proper data intelligence and tracking creates a feedback loop where each visitor interaction informs the next optimization cycle.
Cost Per Acquisition and Landing Page ROI
Landing page performance directly impacts cost per acquisition across fitness business types. Pilotium's benchmark data reveals how CPA varies by gym model:
| Gym Type | Avg. CPA | 12-Month LTV | LTV:CPA Ratio |
|---|---|---|---|
| Budget/HVLP | $28 | $180 | 6.4:1 |
| Mid-range | $62 | $720 | 11.6:1 |
| Boutique/specialty | $85 | $1,440 | 16.9:1 |
| CrossFit/functional | $74 | $2,160 | 29.2:1 |
| Personal training | $112 | $3,600 | 32.1:1 |
A healthy LTV-to-CPA ratio is 5:1 or better. Most well-run gyms land between 8:1 and 15:1, meaning every dollar spent on acquisition returns $8–$15 in the first year. Boutique and personal training studios achieve the highest ratios despite higher CPAs because their lifetime values are substantially larger.
Landing page optimization compounds these returns. The MAG Growth case study demonstrates the math: a 67% improvement in landing page conversion paired with a 42% reduction in CAC shifted ROAS from 1.8× to 3.4× — nearly doubling advertising efficiency without increasing ad spend. For brands focused on Google Ads strategy, landing page conversion is the lever with the highest marginal return.
Seasonal Patterns and Landing Page Adjustments
Fitness landing page performance fluctuates predictably with seasonal demand. January sees a 20–25% jump in gym sign-ups compared to December, driven by New Year's resolution traffic. Approximately 12% of all new gym sign-ups occur in January alone.
Conversely, summer months see up to 50% lower gym attendance as workouts shift outdoors and travel increases. Landing pages during off-peak months need stronger offers — extended free trials, no-commitment periods, or seasonal pricing — to maintain conversion velocity.
Smart fitness marketers adjust their landing page messaging seasonally: resolution-focused urgency in Q1, body-composition and outdoor-prep angles in Q2, flexible and low-commitment messaging during Q3's summer slowdown, and holiday challenge campaigns in Q4. Each seasonal shift requires updated hero copy, offer structure, and sometimes entirely different page layouts to match evolving prospect intent.
Frequently Asked Questions
What is a good conversion rate for a gym landing page?
A good gym landing page converts 10–20% of visitors into leads. The industry average across fitness campaigns is 11.2%, while top 10% performers reach 26.0%. Below 5% typically signals issues with message match, offer strength, or page speed. Cross-industry data places fitness at 8.3% median, making it the third-highest converting vertical.
How does mobile traffic affect fitness landing page conversion rates?
72.4% of fitness traffic comes from mobile devices, but mobile bounce rates are 9.1 percentage points higher than desktop (48.2% vs. 39.1%). Mobile-first design is essential. Pages loading in under 3 seconds and using simplified, thumb-friendly forms close much of this gap. A 1-second load time improvement can produce a 20% conversion lift.
How much does landing page CRO improve gym acquisition costs?
Documented CRO campaigns in fitness have produced 42–67% reductions in customer acquisition cost while simultaneously increasing conversion rates. The In-Shape Family Fitness test delivered 7,660 additional signups over 90 days through a single conversion rate optimization, demonstrating that CRO produces outsized returns relative to increasing ad spend.
What elements matter most on a fitness landing page?
The highest-impact elements are offer-first headlines (not gym names or taglines), single-CTA focus (no navigation distractions), video content (53% higher conversion), and social proof (15–25% lift). Form simplicity is critical — each field beyond name, email, and phone reduces conversion by approximately 10%. Speed to first contact after form submission is the most undervalued lever.
When should gym landing pages be updated for seasonal performance?
Landing pages should be refreshed at least quarterly to match seasonal intent. January pages need resolution urgency and challenge offers. Spring pages benefit from outdoor-prep and body-composition angles. Summer requires stronger incentives to overcome reduced gym attendance (down 50%). Q4 pages should feature holiday challenge campaigns and year-end pricing.
Sources
pilotium.cc/en/blog/state-of-gym-marketing-2026
leadsystemsgo.com/blog/landing-page-conversion-benchmarks-by-industry
cufinder.io/blog/benchmarks/fitness-and-wellness
glofox.com/blog/gym-landing-page
maggrowth.com/articles/how-we-boosted-landing-page-cvr-67-with-cro
getdalton.com/case-studies/case-inshape
seerinteractive.com/work/case-studies/70-increase-ppc-conversion-rate
pushpress.com/blog/leaky-funnel-gym-ads
worldmetrics.org/marketing-in-the-fitness-industry-statistics


