



Table of contents
The global fitness industry is on a sustained growth trajectory, and digital marketing is the engine driving member acquisition, retention, and revenue expansion. Valued at $131.31 billion in 2025 and projected to reach $244.70 billion by 2032 at a 9.3% CAGR (Fortune Business Insights via ABC Fitness), the fitness market is attracting more competitive marketing spend than ever before. Meanwhile, the online fitness market has surged from $38.43 billion in 2025 to an estimated $51.73 billion in 2026 — a staggering 34.6% year-over-year growth rate — as hybrid gym-digital models become the norm. These fitness digital marketing statistics compile the latest data on how gyms, studios, and wellness brands are investing in digital channels to grow their businesses.
Key Takeaways
- The global fitness industry market was valued at $131.31 billion in 2025, with projections reaching $244.70 billion by 2032 (CAGR 9.3%).
- 31% of U.S. gyms now use AI in their marketing, up from 12% in 2025.
- Gyms allocating 7–12% of revenue to digital marketing see 2.4× higher member acquisition rates than those spending less than 3%.
- SEO drives 38–48% of website traffic for fitness businesses, with local search accounting for 62% of that volume.
- Short-form video generates 3.1× more engagement than static posts for fitness brands on Instagram and TikTok.
- Email marketing delivers $42 per dollar invested for health and fitness businesses — the highest ROI of any digital channel.
- The online fitness market grew 34.6% year-over-year, reaching $51.73 billion in 2026.
| Metric | Fitness Industry Benchmark | All-Industry Average |
|---|---|---|
| Global market value (2025) | $131.31 billion | — |
| Projected market value (2032) | $244.70 billion | — |
| Marketing spend as % of revenue | 7–12% | 6–10% |
| Organic search traffic share | 38–48% | 47% |
| Social media engagement rate | 1.8–3.2% | 1.5% |
| Email marketing ROI | $42 per $1 | $36 per $1 |
| Avg. CPC (Google Ads) | $1.90–$4.20 | $2.69 |
Fitness Industry Market Size & Growth Data
The health and fitness industry continues its post-pandemic recovery with strong momentum. According to ABC Fitness's 2026 industry report, median revenue growth for fitness businesses reached 9.9% in 2025, with boutique studios and hybrid models outpacing traditional big-box gyms. North America accounts for the largest share of global fitness revenue, followed by Europe and the rapidly expanding Asia-Pacific market. In the United States alone, there are approximately 41,370 fitness facilities serving 72.5 million members — a penetration rate of about 21.5% of the adult population.
The digital transformation of fitness is the biggest structural shift. The online fitness market — encompassing virtual classes, fitness apps, wearable-connected platforms, and hybrid memberships — grew from $38.43 billion to $51.73 billion between 2025 and 2026. This segment now represents roughly 28% of total fitness industry revenue, up from just 9% pre-pandemic. For gym operators and wellness brands, investing in a comprehensive digital marketing strategy is no longer optional but a competitive requirement.
Digital Marketing Spend & Budget Allocation for Gyms
Fitness businesses that invest strategically in digital marketing consistently outperform those that rely on walk-in traffic and word-of-mouth alone. According to Pilotium's 2026 State of Gym Marketing report, gyms allocating 7–12% of revenue to digital marketing achieve 2.4× higher member acquisition rates than those spending less than 3%. The average gym marketing budget in 2026 breaks down as follows: 28% on social media (organic + paid), 22% on paid search (Google Ads, Bing), 18% on SEO and content, 15% on email marketing, 10% on website and conversion optimization, and 7% on video production.
AI adoption is accelerating budget efficiency. An estimated 31% of U.S. gyms now use some form of AI in their marketing — up from 12% in 2025 — primarily for content generation, ad copy optimization, and member segmentation. Gyms using AI-assisted marketing tools report 22–35% reductions in cost per acquisition while maintaining or improving lead quality.

SEO Performance for Fitness Businesses
Search engine optimization is the cornerstone of sustainable fitness marketing. Organic search drives 38–48% of total website traffic for fitness businesses, with local search queries accounting for 62% of that volume. Terms like "gym near me," "personal trainer [city]," and "yoga studio [neighborhood]" dominate the fitness search landscape, with monthly search volumes ranging from 2,000 to 50,000+ per metro area. According to RankPill's 2026 data, search volume for personal training and fitness keywords spikes predictably in January, with a secondary peak in September — seasonal patterns that inform content calendars.
Local SEO is particularly critical. Gyms with a fully optimized Google Business Profile — complete with photos, accurate hours, class schedules, and 25+ reviews — appear in the local map pack 3.2× more often than competitors with incomplete listings. The average fitness business Google listing receives 420 monthly views, generating an estimated 28 direction requests and 15 phone calls per month. Maintaining a strong local search presence complements broader Google Ads strategy by capturing both paid and organic real estate on the SERP.
| SEO Metric | Fitness Benchmark | Notes |
|---|---|---|
| Organic traffic share | 38–48% | Local queries dominate (62% of organic) |
| Avg. keyword difficulty (head terms) | 40–65 | "gym near me" KD ~55 |
| Organic conversion rate | 2.4–5.1% | Class booking pages convert highest |
| GBP monthly views (avg.) | 420 | Optimized profiles see 3.2× more |
| Time to page 1 (local) | 3–8 months | Faster for niche/boutique terms |
| Content ROI payback period | 6–12 months | Blog-driven traffic compounds in year 2 |
Social Media Marketing Benchmarks for Fitness Brands
Social media is the most visible marketing channel for fitness businesses, and the data confirms its outsized impact. Fitness brands achieve average engagement rates of 1.8–3.2% across platforms — significantly above the all-industry average of 1.5% — driven by the visual, aspirational nature of fitness content. Instagram remains the dominant platform at 89% adoption among fitness businesses, followed by Facebook (76%), TikTok (52%), YouTube (41%), and LinkedIn (18%).
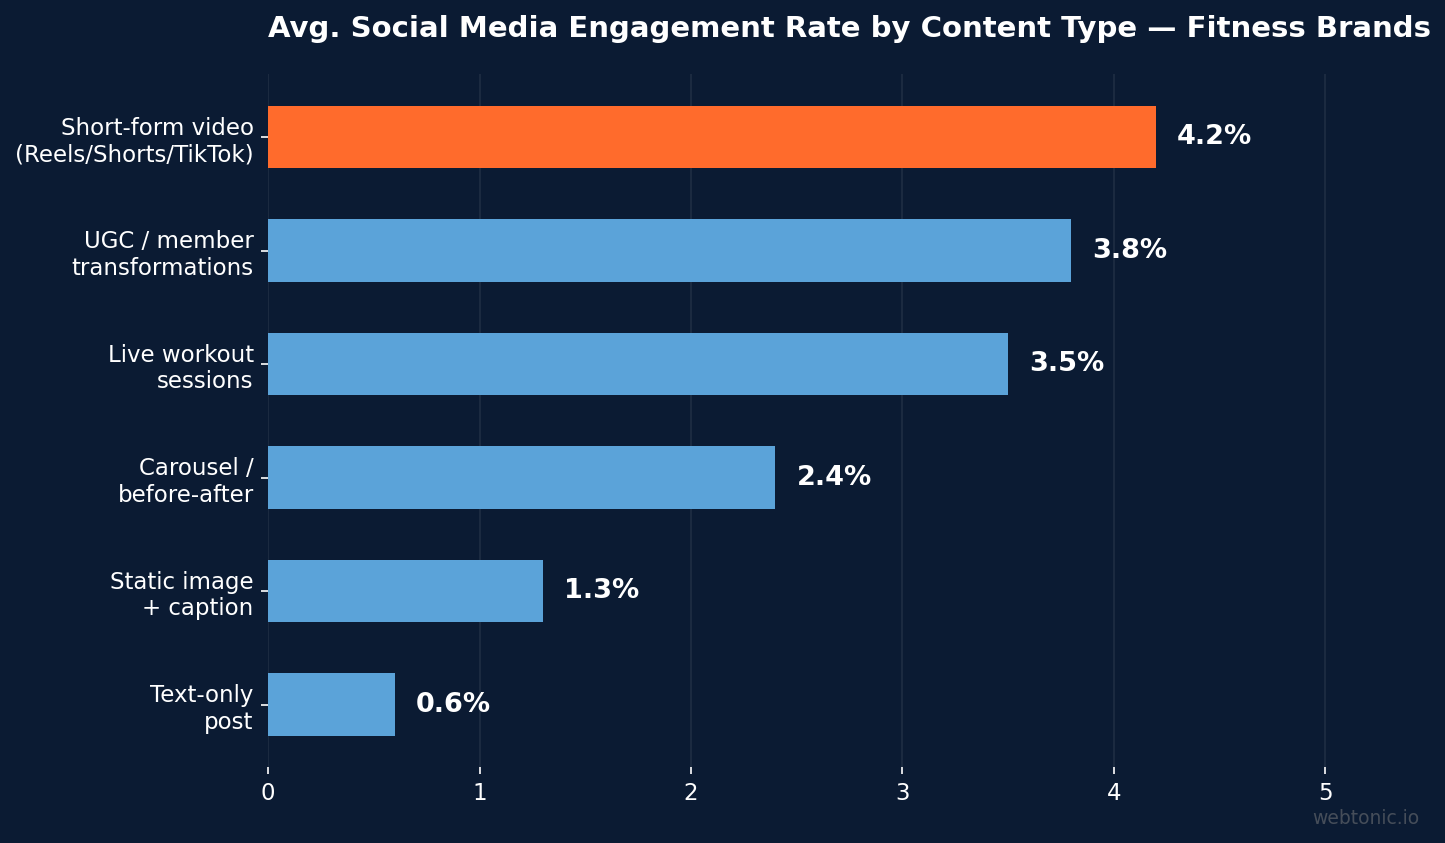
Short-form video is the clear content winner. Reels, Shorts, and TikTok clips generate 3.1× more engagement than static image posts, and fitness accounts posting short-form video at least 4× per week grow followers 78% faster than those posting fewer than twice weekly. According to HubSpot's state of marketing report, fitness and wellness is among the top 5 verticals for short-form video performance globally. User-generated content (transformation photos, workout check-ins, member testimonials) outperforms branded studio content by 2.4× in engagement.
Paid Advertising Performance: Google Ads & Social
Paid search and social advertising deliver measurable member acquisition for fitness businesses. The average cost per click (CPC) on Google Ads for fitness keywords ranges from $1.90 to $4.20, with "personal trainer" and "gym membership" among the most competitive terms. Conversion rates from Google Ads landing pages average 3.8–6.2% for trial/free-class offers and 1.5–2.8% for direct membership sign-ups. According to CuFinder's fitness benchmarks, the average cost per lead ranges from $18 to $45 depending on market competitiveness and targeting precision.
On the social advertising side, Meta Ads (Facebook and Instagram) remain the top performer for gym marketing, with CPMs of $8–$15 and cost per lead of $12–$32 for trial-offer campaigns. TikTok Ads are emerging as a cost-effective alternative, with CPMs 25–40% lower than Meta for fitness audiences aged 18–34. Video-first ad creative delivers 34% higher conversion rates across all paid platforms versus static image ads.
Email Marketing & Retention Statistics for Fitness
Email marketing is the highest-ROI digital channel for fitness businesses, delivering an estimated $42 per dollar invested — above even the cross-industry average of $36. Open rates for gym and studio emails average 23.8%, with click-through rates of 2.6%. The most effective email types are class reminder sequences (32% open rate), win-back campaigns for lapsed members (28% open rate with 8–12% reactivation), and promotional offers for trial passes (26% open rate).
Retention-focused email automation is especially valuable given the fitness industry's historically high churn. The average gym experiences 28–35% annual member attrition, and automated engagement sequences — workout milestone celebrations, inactivity nudges, birthday offers — reduce churn by 15–22%. Fitness businesses using data-driven segmentation (visit frequency, class type preferences, engagement scoring) see 2.8× higher email conversion rates than those sending blanket broadcasts.
Online Fitness Market & App Growth Data
The explosion of the online fitness market is reshaping competitive dynamics. Growing from $38.43 billion in 2025 to $51.73 billion in 2026 (The Business Research Company), the online segment is projected to sustain double-digit growth through 2030. Fitness app downloads surpassed 620 million globally in 2025, with subscription-based models accounting for 65% of app revenue. The top fitness apps — including Peloton, Nike Training Club, and Strava — spend an average of $2.1 million per month on user acquisition marketing.
Hybrid models (combining in-person and digital offerings) are outperforming pure-play operators. Gyms offering on-demand and live-streamed classes alongside physical memberships report 18–25% higher retention rates and 12–15% higher lifetime value per member. The content marketing playbook for hybrid fitness operators emphasizes community building, personalized workout recommendations, and wearable integration — strategies that deepen the value proposition beyond physical space access.
FAQ
How much should a gym spend on digital marketing?
Industry data shows that gyms allocating 7–12% of gross revenue to digital marketing achieve the best member acquisition results — about 2.4× higher than those spending under 3%. For a gym generating $500,000 in annual revenue, this translates to $35,000–$60,000 per year across all digital channels. The split should emphasize social and paid search, with growing allocations for SEO content and email automation.
What is the best social media platform for gym marketing?
Instagram leads with 89% adoption among fitness businesses and the highest engagement for visual fitness content. However, TikTok (52% adoption) is gaining fast, with 3.1× engagement multiplier from short-form video. The best approach is platform-specific content: Reels and workout clips for Instagram/TikTok, community-building on Facebook Groups, and educational content on YouTube.
What is the average cost per lead for gym advertising?
Google Ads leads cost between $18 and $45 depending on market competition and targeting quality. Meta Ads (Facebook/Instagram) deliver leads at $12–$32 for trial-offer campaigns. Retargeting campaigns typically reduce cost per lead by 35–50% compared to cold prospecting. Video-first ad creative consistently outperforms static formats by 34% in conversion rate.
How effective is SEO for fitness businesses?
SEO drives 38–48% of website traffic for fitness businesses, with local queries making up 62% of organic visits. Gyms with optimized Google Business Profiles appear in the local map pack 3.2× more often. Content-driven SEO (blogs, workout guides, nutrition articles) compounds over time, with most fitness businesses seeing positive ROI within 6–12 months of consistent investment.
How big is the online fitness market in 2026?
The online fitness market reached $51.73 billion in 2026, growing 34.6% year-over-year from $38.43 billion in 2025. This includes virtual classes, fitness apps, wearable-connected platforms, and hybrid memberships. The segment now represents about 28% of total fitness industry revenue and is projected to sustain double-digit growth through the end of the decade.
Sources
ABC Fitness — Fitness Industry Statistics 2026
Pilotium — The 2026 State of Gym Marketing
RankPill — SEO for Personal Trainers 2026
The Business Research Company — Online Fitness Market 2026
CuFinder — Fitness Marketing Benchmarks
HubSpot — State of Marketing Report
IHRSA — Industry Publications & Reports


