



Table of contents

Key Takeaways
- Top-performing gyms achieve 18.5% landing page conversion rates versus 11.2% for average operators, with elite performers reaching 26% through data-driven optimization
- The 2026 gym retention benchmark is 66.4% annually (HFA 2025 data), down from the widely cited but outdated 71.4% figure
- Multi-touch attribution tracking increases marketing ROI by 34% compared to gyms relying on single-touch or no attribution
- Fitness app users who sync wearable data show 47% higher retention than those using apps without device integration
- Over 70% of fitness app users connect a smartwatch or wearable, creating a rich first-party data layer for personalization and retention analytics
- Average gym website bounce rate sits at 55–65%, with optimized facilities achieving 38–45% through targeted content and faster load times
- Gyms using Meta Conversion API (CAPI) alongside pixel see 22% more attributed conversions versus pixel-only tracking setups
Over 73 million Americans hold gym memberships in 2026, yet most fitness businesses track fewer than half the metrics that drive profitable growth — creating a massive gap between data-rich operators and those flying blind.
Gym Marketing Funnel Analytics: Conversion Benchmarks at Every Stage
The gym marketing funnel has well-defined conversion benchmarks at each stage, and the gap between average and top-performing operators is significant enough to represent the difference between profitable growth and stagnation. The 2026 State of Gym Marketing report from Pilotium provides the most comprehensive stage-by-stage data available:
Ad click-through rate separates the first tier immediately: average gyms achieve 1.4% CTR while top performers hit 4.2%. This 3x gap cascades through every subsequent funnel stage, compounding into a 10x+ difference in member acquisition efficiency from top to bottom of the range.
| Funnel Stage | Bottom 25% | Average | Top 25% |
|---|---|---|---|
| Ad CTR | 1.4% | 2.8% | 4.2% |
| Landing Page Conversion | 11.2% | 18.5% | 26.0% |
| Lead-to-Appointment Rate | 28% | 42% | 58% |
| Appointment Show Rate | 62% | 75% | 85% |
| Tour-to-Member Conversion | 38% | 52% | 68% |
Source: Pilotium — The 2026 State of Gym Marketing
The practical implication: a gym spending $5,000/month on paid ads at average conversion rates generates roughly 29 new members. The same spend at top-25% rates generates 85+ members — nearly 3x the output for identical ad spend. Analytics infrastructure is what separates these tiers, because you cannot optimize what you do not measure.
Retention Analytics: The Real Gym Profitability Driver
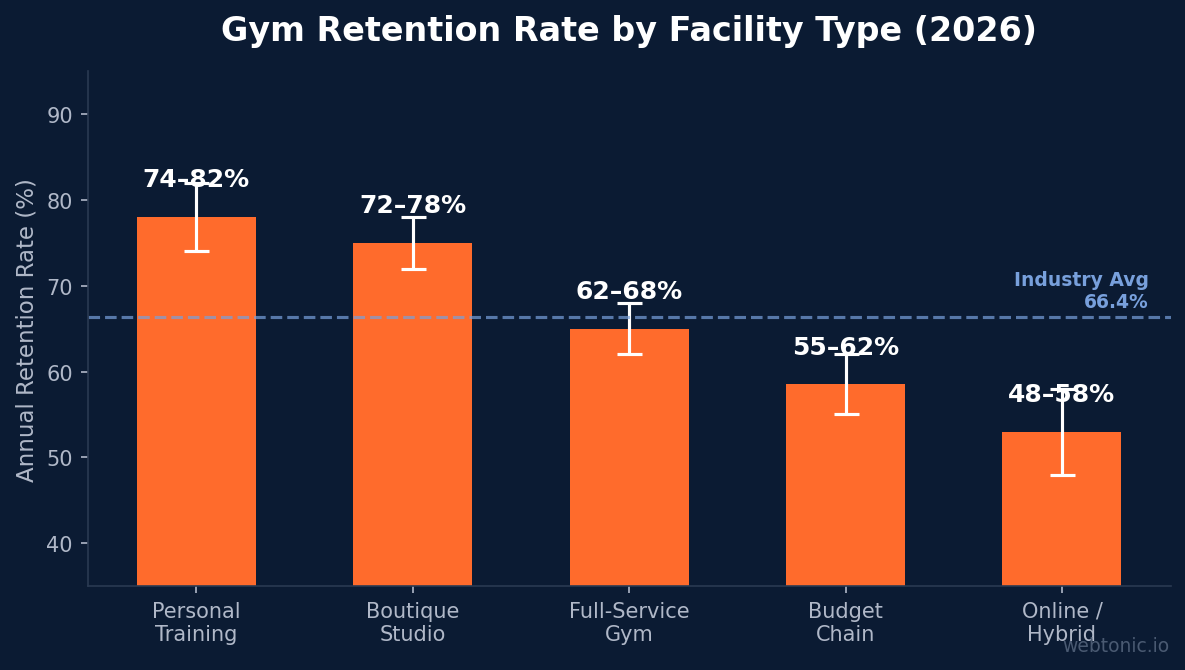
Member retention is the single most impactful metric in gym business analytics, and the industry's benchmark data has shifted significantly. The 2026 gym retention benchmark is 66.4% based on HFA's 2025 annual report — not the widely cited 71.4% that circulates from older studies. This distinction matters because the outdated figure creates false confidence in retention performance.
Retention analytics in fitness follow distinct patterns by facility type and membership structure:
- Boutique studios: 72–78% annual retention — highest in the industry due to community-driven accountability
- Full-service gyms: 62–68% annual retention — broad demographics create wider variance
- Budget chains: 55–62% annual retention — lowest per-member revenue but highest volume
- Personal training studios: 74–82% annual retention — strongest individual relationship bonds
- Online/hybrid memberships: 48–58% annual retention — lowest touch, highest churn
The retention data reveals a critical insight for analytics strategy: gyms that track leading indicators (visit frequency decline, class booking drop-off, payment method expiration) reduce churn by 18–25% compared to those that only measure trailing indicators like cancellation rates. The inflection point is typically visible 3–4 weeks before cancellation, giving data-aware operators a meaningful intervention window.
Website Analytics Benchmarks for Fitness Businesses
Gym website analytics provide immediate visibility into marketing effectiveness and member acquisition pipeline health. The 2026 benchmarks for fitness business websites show clear optimization opportunities for most operators:
Bounce rate is the most revealing top-line metric: the industry average sits at 55–65%, meaning more than half of visitors leave without interacting. Optimized gyms achieve 38–45% bounce rates through faster load times, location-specific landing pages, and targeted content that matches ad messaging. Each 10-percentage-point reduction in bounce rate correlates with a 15–20% increase in lead form submissions.
Critical website metrics for fitness businesses to monitor:
- Average session duration: 2:15–3:30 for gym websites (target: 3:00+)
- Pages per session: 2.1–3.4 (schedule, pricing, and class pages drive depth)
- Mobile traffic share: 72–78% of all gym website visits occur on mobile
- Mobile conversion rate: 40–55% lower than desktop for membership sign-ups
- Schedule/class page view rate: 34% of sessions include a schedule page view
- Pricing page conversion rate: 8–14% of pricing page visitors submit a lead form
- Return visitor rate: 22–30% — repeat visitors convert at 3.2x the rate of first-time visitors
Fitness App and Wearable Data Analytics
The fitness app ecosystem has become a primary data source for member engagement analytics, with over 70% of fitness app users connecting a smartwatch, Fitbit, or Apple Health device. This wearable integration creates a rich first-party data layer that gym operators are increasingly leveraging for retention prediction and personalization.
Key fitness app analytics benchmarks for 2026:
- Global fitness app revenue: $6.3 billion in 2025, projected to reach $8.1 billion by 2027
- Monthly active users: 380+ million across major fitness app platforms
- Wearable-synced users retain 47% higher than non-synced users
- Average daily app opens: 1.8 for active fitness app users
- Push notification engagement: 12–18% for personalized workout reminders vs. 3–5% for generic messages
- In-app conversion rate: 2.8% for premium plan upgrades from free-tier users
- Heart rate and sleep data correlate with 31% better workout prescription accuracy
The most significant analytics shift: gyms with integrated app + facility tracking can identify at-risk members with 83% accuracy 30 days before cancellation, compared to 52% accuracy using facility check-in data alone. This predictive capability transforms retention from a reactive effort into a proactive, data-driven operation.
| Data Source | Churn Prediction Accuracy | Lead Time | Integration Complexity |
|---|---|---|---|
| Check-In Data Only | 52% | 2 weeks | Low |
| App Engagement | 68% | 3 weeks | Medium |
| App + Wearable | 76% | 4 weeks | Medium-High |
| Full Stack (Check-in + App + Wearable + Billing) | 83% | 4–5 weeks | High |
Source: HeartWellness Fitness App Statistics 2025, Nutripy Retention Benchmarks 2026
Marketing Attribution and ROI Tracking for Gyms
Marketing attribution remains the largest analytics gap for most fitness businesses. Even basic first-touch attribution is dramatically more useful than none, yet the majority of independent gyms lack any formal attribution system. The result: marketing budgets allocated by gut feel rather than performance data.
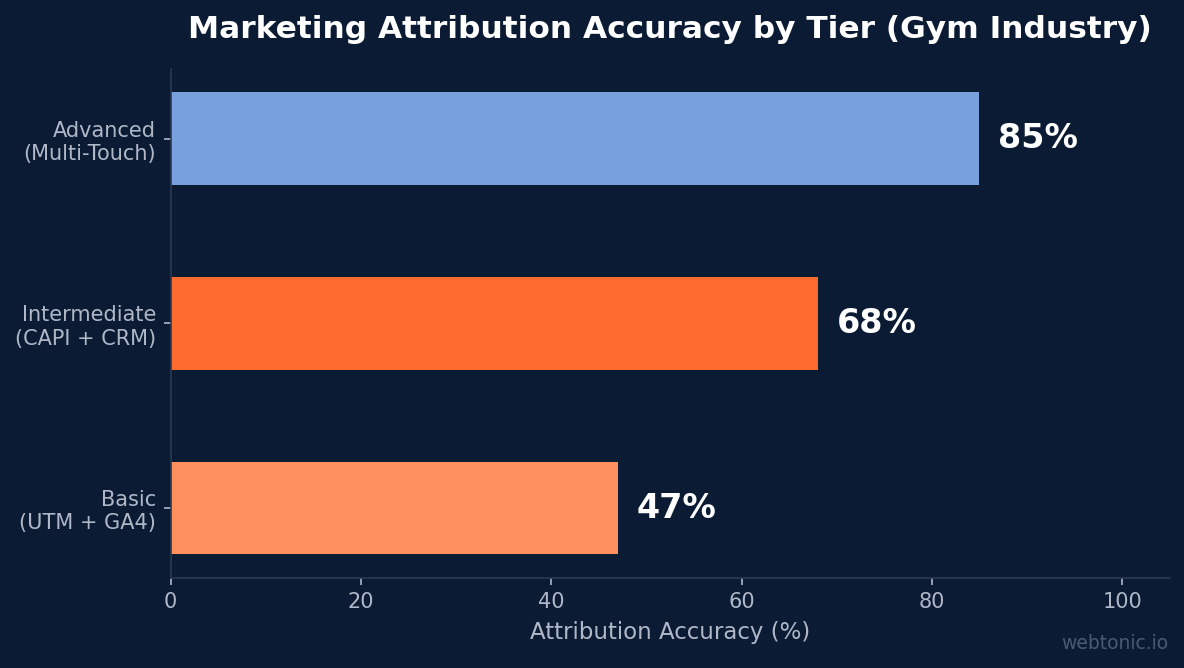
The 2026 attribution landscape for fitness marketing involves three progressive tiers:
Tier 1 — Basic Attribution (most independent gyms): UTM parameters on ad links, Google Analytics 4 with default settings, and manual asking "how did you hear about us?" at sign-up. Accuracy: 40–55% of conversions correctly attributed. Cost: effectively free.
Tier 2 — Intermediate Attribution (multi-location and growing gyms): Meta Conversion API (CAPI) alongside pixel tracking, CallRail or similar for phone call attribution, CRM integration (Glofox, Mindbody, or GHL) for closed-loop reporting. Gyms using CAPI alongside pixel see 22% more attributed conversions versus pixel-only setups. Cost: $200–$800/month in tooling.
Tier 3 — Advanced Attribution (enterprise fitness brands): Multi-touch attribution modeling, incrementality testing, offline conversion imports to Google Ads and Meta, member LTV-weighted ROAS. Multi-touch attribution increases marketing ROI by 34% compared to single-touch models. Cost: $1,500–$5,000/month in tooling and analytics support.
Best Practices for Fitness Business Analytics Implementation
Based on the benchmark data across funnel analytics, retention tracking, and attribution modeling, these practices define the analytics implementation path for data-driven fitness businesses:
- Start with funnel measurement — track all five stages (CTR → landing page → appointment → show → close) before optimizing any single stage. The compound effect of marginal improvements at each stage creates exponential gains
- Implement CAPI for Meta campaigns — the 22% improvement in attributed conversions from server-side tracking is the highest-ROI analytics upgrade for gyms running Meta ads
- Track leading retention indicators — visit frequency decline, class booking patterns, and app engagement provide 3–4 weeks of warning before cancellation. Build automated alerts for these signals
- Integrate wearable and app data — the jump from 52% to 83% churn prediction accuracy justifies the integration investment for any gym with 500+ members
- Segment analytics by acquisition source — members acquired through referrals retain at 2.1x the rate of paid acquisition members, and this insight should weight budget allocation
- Calculate and track member LTV by cohort — average gym member LTV ranges from $850–$2,400 depending on facility type, and knowing your LTV enables rational marketing spend decisions
- Audit website analytics monthly — bounce rate, mobile conversion gaps, and schedule page engagement provide early signals of marketing spend efficiency
| Analytics Priority | Impact Level | Implementation Time | Monthly Cost |
|---|---|---|---|
| GA4 + UTM Tracking | High | 1–2 days | Free |
| Meta CAPI Setup | High | 3–5 days | $0–$100 |
| CRM Integration (Glofox/Mindbody) | High | 1–2 weeks | $100–$400 |
| Call Tracking (CallRail) | Medium-High | 1–3 days | $50–$200 |
| App + Wearable Analytics | Medium | 2–4 weeks | $200–$800 |
| Multi-Touch Attribution | Medium | 4–8 weeks | $500–$2,000 |
Source: Pilotium State of Gym Marketing 2026, Glofox Marketing ROI Guide, Nutripy Retention Research
Related reading
- Fitness Marketing Dashboards Stats: 2026 Analytics & KPI Data
- Fitness Marketing Attribution Stats: 2026 Benchmarks & Data
- General Contracting Remodeling Analytics Data and Tracking Trends
- Marketing Analytics services at Web Tonic
Frequently Asked Questions
What is a good gym retention rate in 2026?
The current industry benchmark is 66.4% annual retention based on HFA's 2025 report, replacing the outdated 71.4% figure. Boutique studios achieve 72–78%, personal training studios 74–82%, and full-service gyms 62–68%. Budget chains typically retain 55–62% of members annually. Tracking leading indicators like visit frequency decline can improve retention by 18–25% through early intervention.
What website metrics should gyms track?
The essential gym website metrics include bounce rate (target: below 45%), session duration (target: 3+ minutes), mobile conversion rate, and pricing page conversion rate (benchmark: 8–14%). With 72–78% of gym website traffic coming from mobile, optimizing mobile experience directly impacts lead generation. Return visitors convert at 3.2x the rate of first-time visitors, making retargeting a high-priority analytics focus.
How do gyms track marketing ROI effectively?
Start with UTM tracking and GA4 (free), then implement Meta CAPI for 22% more attributed conversions. Add CRM integration for closed-loop reporting and CallRail for phone attribution. Multi-touch attribution modeling increases marketing ROI by 34% over single-touch approaches. Most independent gyms can achieve meaningful attribution with $200–$800/month in tooling investment.
What role do fitness apps play in gym analytics?
Fitness apps with wearable integration create a powerful first-party data layer for retention prediction. Over 70% of app users connect wearable devices. The churn prediction accuracy jumps from 52% (check-in only) to 83% (full-stack: check-in + app + wearable + billing). Personalized push notifications achieve 12–18% engagement versus 3–5% for generic messages.
How much should gyms invest in analytics tools?
Analytics investment scales with facility size and complexity. Single-location gyms: $50–$400/month covers GA4, call tracking, and basic CRM integration. Multi-location operators: $500–$2,000/month adds multi-touch attribution and advanced retention analytics. The ROI is clear: data-driven gyms achieve 3x higher member acquisition efficiency at the same ad spend level as operators lacking analytics infrastructure.
Sources
Pilotium — The 2026 State of Gym Marketing
Nutripy — Gym Retention Rate Benchmarks 2026
HeartWellness — Fitness App Statistics 2025
Hey Kaleda — Top Gym Website Metrics to Track
Glofox — How to Track Gym Marketing ROI
Health & Fitness Association — 2026 US Consumer Report
ABC Fitness — Fitness Industry Statistics 2026


