



Table of contents
Video marketing ROI in financial services is 49% higher than other content formats, yet fewer than one in five fintech firms has a documented video strategy. Here is a complete statistical analysis of fintech video marketing performance for 2026.
Key Takeaways
- Video marketing ROI in financial services is 49% higher than other formats, with 82% of marketers reporting positive returns (Zipdo, Wyzowl).
- Financial services brands using educational video generate 3x more inbound leads than those relying solely on written content (Portfolio MC).
- Fintech landing pages with explainer videos see up to 64% higher conversion rates, with complex financial products achieving 2.5x conversion uplift (Video Explainers, Oakgen).
- 85% of consumers have been convinced to buy a product after watching a video, with consideration-stage impact strongest for fintech (Vidico).
- TikTok delivers 2.34% engagement on fintech short-form video, outperforming Instagram Reels (1.48%) and YouTube Shorts (0.91%) (Naughty Marketing).
- Video ads on YouTube drive 52% higher engagement for BNPL explanations vs. static creatives (Gitnux).
Video Marketing ROI in Financial Services
Video consistently outperforms other content formats in financial services, and the data points converge from multiple sources. Video marketing ROI in financial services is 49% higher than other formats (Zipdo). Wyzowl's 12-year longitudinal study reports that 82% of marketers say video has given them a good ROI — down from the 2024 all-time high of 93% but still an overwhelmingly positive result (Wyzowl 2026). The dip reflects higher production costs and market saturation, not a decline in video effectiveness.
The industry benchmark for fintech advertising ROI is a minimum 300% return on ad spend, according to Lever Digital's 2025 analysis. Reaching that benchmark requires connecting creative decisions to pipeline outcomes rather than optimizing for platform dashboards (Vidico). Video content marketing for payments companies delivers a 2.9x higher ROI than other formats, with brand lift from video views reaching 23% and equating to $7.2 ROI per view (Gitnux). For fintech teams allocating budgets between content types, these numbers make the case for prioritizing video within a broader performance creative strategy.
Video Marketing ROI by Content Type (Financial Services)
| Metric | Video | Written Content | Static Display |
|---|---|---|---|
| ROI vs. Other Formats | +49% | Baseline | -15% |
| Inbound Leads | 3x more | Baseline | 0.5x |
| Marketer Positive ROI | 82% | ~65% | ~55% |
| Brand Lift | 23% | 8-12% | 5-8% |
| BNPL Engagement vs. Static | +52% | N/A | Baseline |
Explainer Video Conversion Performance
Explainer videos are the highest-converting video format for fintech companies, primarily because financial products require more explanation than impulse purchases. Fintech landing pages with explainer videos see up to 64% higher conversion rates (Video Explainers). For complex financial products, the uplift is even more dramatic: 2.5x higher conversion when an explainer video is present, along with a 25% reduction in support ticket volume per user (Oakgen).
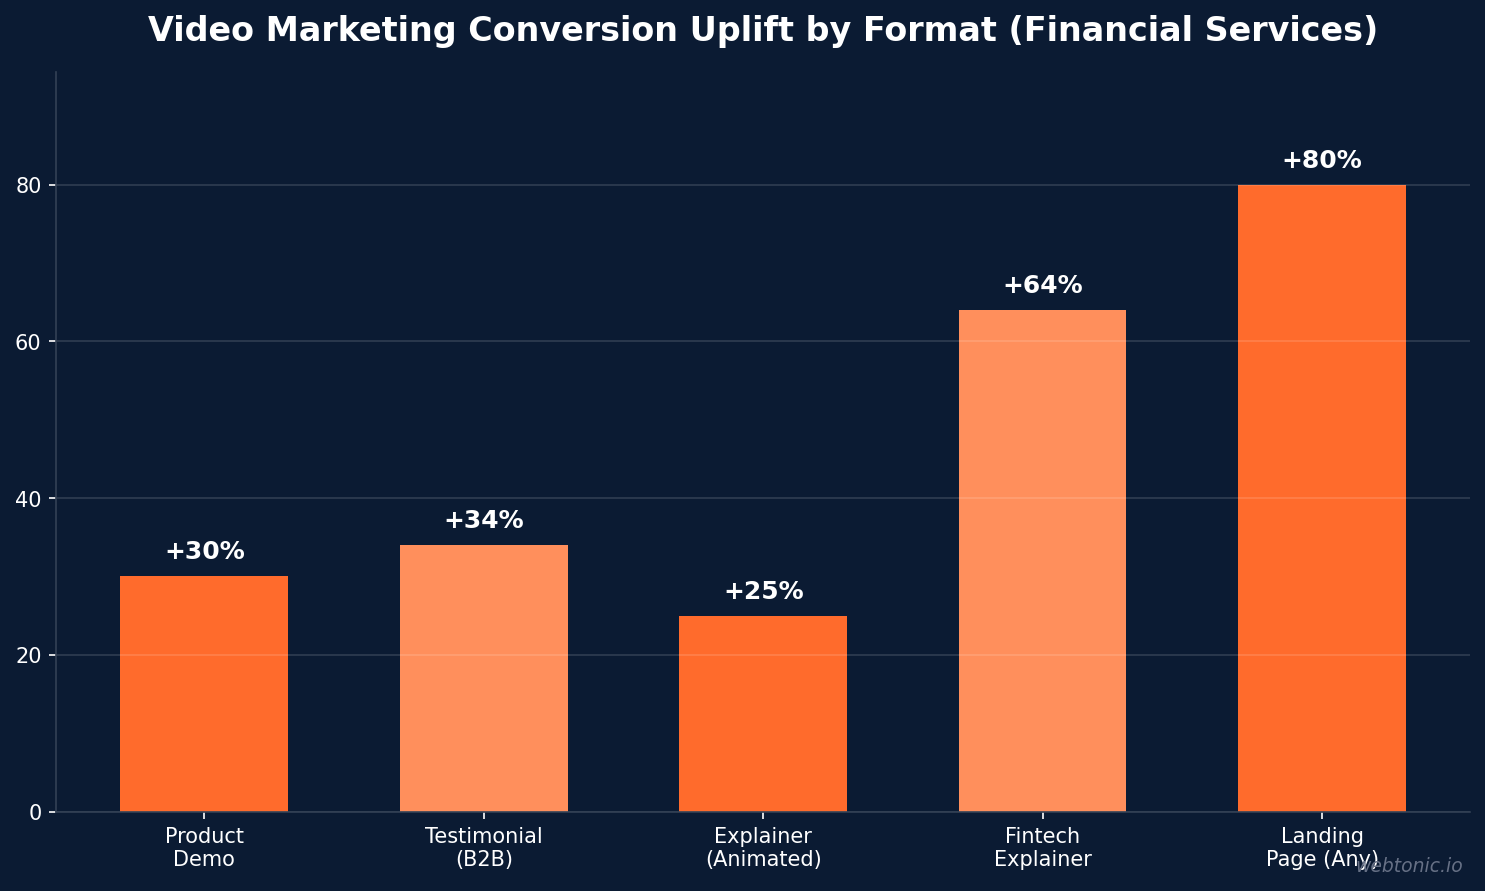
The broader landing page video data reinforces these fintech-specific findings. Landing pages with video can convert up to 80% higher than pages without video, according to Unbounce's benchmark data (Levitate Media). Video testimonials on sales pages lift conversions by up to 34% in VWO testing and up to 80% in individual case studies (Levitate Media). A total of 96% of consumers turn to explainer videos to gather information about a product, and 93% of marketers report video drives lead generation (Fable Financial Films). The benchmark for fintech explainer video success is a 60% view-through rate — a video watched to completion by 60% of viewers outperforms one with 10x the views but early drop-off (Pexo 2026 Explainer Guide). Video reduces friction in the sign-up process by answering key objections upfront: what the product does, how it works, and why it is safe to use.
Short-Form Video Performance by Platform
Platform engagement varies dramatically for fintech short-form content, and the winning platform depends heavily on whether you are targeting consumer or B2B audiences. TikTok delivers 2.34% engagement rates compared to Instagram Reels at 1.48% and YouTube Shorts at 0.91% for fintech-specific content (Naughty Marketing). Videos under one minute achieve the highest completion rates, while 42% of fintech users discover new products through short-form video content.
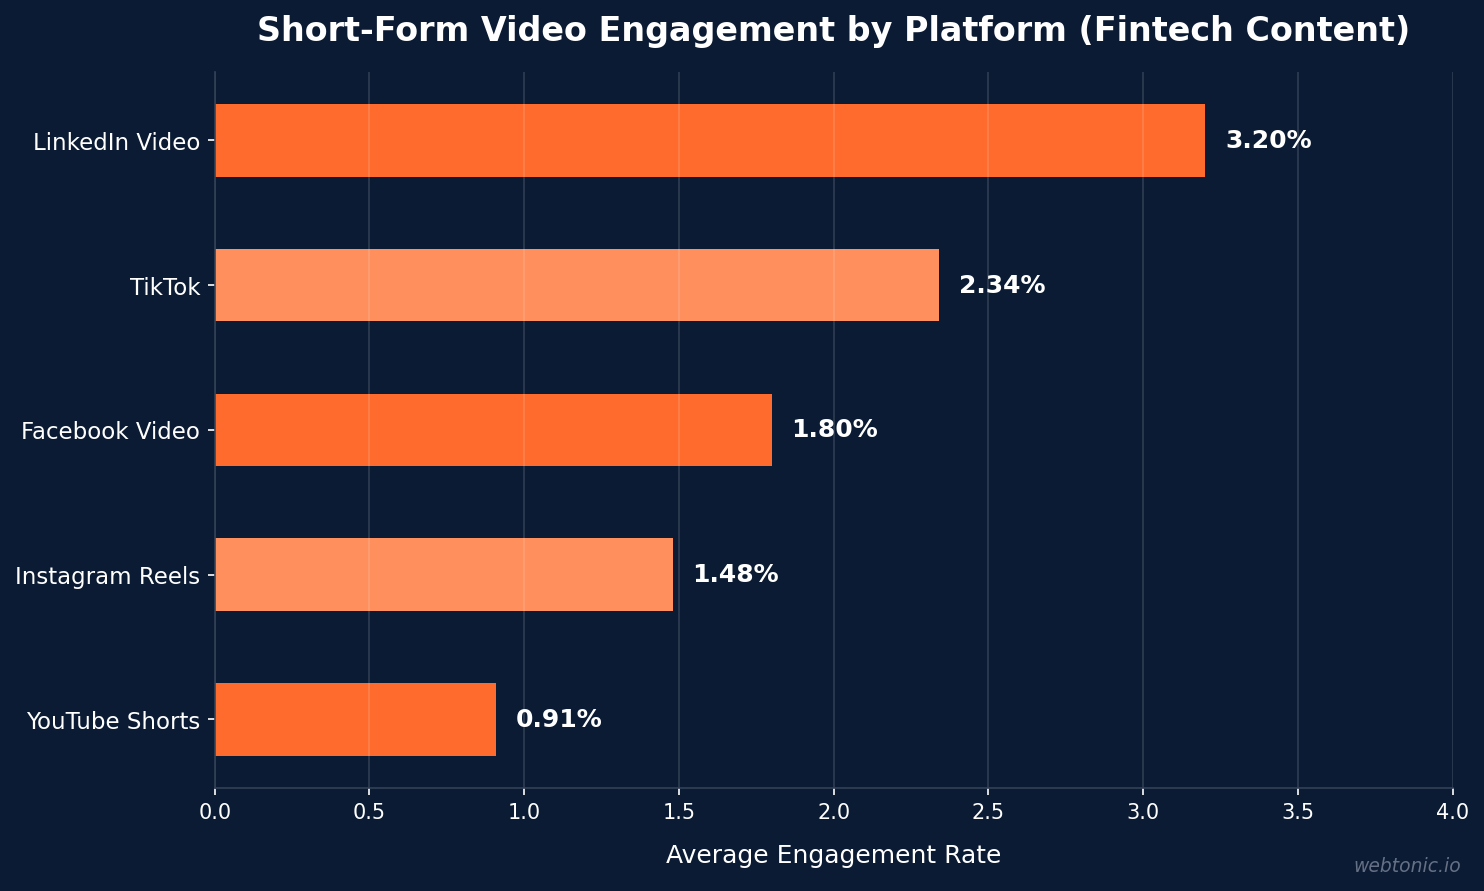
TikTok Ads specifically delivered 3.7x ROAS for fintech campaigns in 2026, with short-form video under 15 seconds outperforming longer formats by 45% in completion rate (Paid Media Studio). The platform's B2B lead generation conversion rate stands at 3.20%, with cost-per-lead 62% lower than other popular platforms (ContentBeta 2026 Short-Form Report). On LinkedIn, native video consistently outperforms written posts for organic reach, with 65% of millennials preferring video content for financial advice (Zipdo). These platform dynamics should inform any paid media budget allocation decision.
Short-Form Video Performance Benchmarks by Platform
| Platform | Engagement Rate | Completion Rate | Fintech-Specific Stat |
|---|---|---|---|
| TikTok | 2.34% | Highest (<15s) | 3.7x ROAS, 62% lower CPL |
| Instagram Reels | 1.48% | High | 3.1% FinServ engagement |
| YouTube Shorts | 0.91% | Moderate | 40% of FS video views |
| LinkedIn Video | 3.20% | High (B2B) | 65% millennials prefer video |
| Facebook Video | 1.80% | Moderate | $4.21 ROI insurance leads |
Video Production and Adoption Trends
Financial services companies are investing heavily in video production capabilities. Video creation increased 189% year-over-year across the financial services sector, according to Vidyard's 2024 benchmark report (Vidico). However, fewer than one in five fintech firms has a documented video content strategy, despite 86% of businesses now using video as a marketing tool (Portfolio MC). This gap between adoption and strategy represents one of the biggest opportunities in fintech marketing — the brands that systematize their video workflow will compound their advantage quarter over quarter.
AI is fundamentally transforming video production economics for fintech companies. Explainer video production costs range from $2,000-$12,000 at agencies but have dropped to $99-$500 with AI and DIY tools (FoundryCRO 2026 Video Benchmarks). This cost reduction makes video accessible to early-stage fintech startups that previously could not justify the production investment. 85% of people have been convinced to buy a product after watching a video, with fintech impact strongest at the consideration stage rather than awareness (Vidico/Wyzowl 2026). The category is moving fast — brands not building repeatable creative systems are already falling behind their competitors who have systematized video production workflows. Investing in Meta Ads video creative amplifies these organic gains through paid distribution at scale, creating a compounding advantage over time.
Trust Building Through Fintech Video Content
Trust is arguably the most important factor in financial services marketing, and video is uniquely positioned to build it. In fintech, trust is the product — the gap between a prospect who scrolls past and one who books a meeting often comes down to whether the brand has successfully communicated security, credibility, and human expertise through its content (Portfolio MC). Video addresses this directly by putting real people on screen, demonstrating product functionality in real time, and allowing prospective customers to evaluate tone and professionalism before committing.
UrbanGeko's trust-first framework identifies four distinct video types that map to different trust-building objectives in fintech. Explainer videos clarify the product concept and category positioning, making complex financial products accessible to non-expert audiences. Security and compliance videos establish institutional credibility by demonstrating regulatory adherence and data protection measures. Customer testimonial videos provide third-party social proof, which is especially powerful in financial services where peer recommendations carry outsized influence. Finally, founder-led thought leadership videos humanize the brand and create emotional connection — a critical differentiator in a sector often perceived as impersonal and automated (UrbanGeko). Companies that layer these four video types across their funnel consistently outperform competitors relying on text-only content strategies.
Video Performance Benchmarks
Oak and Rumble's B2B video reporting framework provides specific performance targets for fintech video campaigns across different page types and funnel stages. Homepage videos should target a 25-30% play rate and 40-55% bounce rate. Product and feature page videos aim for an 8-14% play rate with a 3-8% rate of action and approximately 65% average watch percentage (Oak & Rumble B2B Video Report). Support video should aim for 20-30% ticket deflection, which directly reduces operational costs while improving user satisfaction scores.
72% of financial services marketers plan to increase video ad budgets by 20% in the coming year (Zipdo). YouTube drives 40% of video views for financial services content, making it the single largest video distribution platform for the sector. Video ads on YouTube drive 52% higher engagement for BNPL explanations compared to static creatives (Gitnux). The trust-first framework outlined by UrbanGeko emphasizes that fintech video strategy should build trust across every stage of the customer journey: explainer videos clarify the product concept, security-focused videos establish credibility, testimonial videos validate the experience through social proof, and onboarding videos reduce churn by accelerating time-to-value (UrbanGeko). Smart growth marketing teams build these benchmarks into their quarterly content calendars and track performance against these stage-specific targets.
Related reading
- What Senior Living Marketers Should Budget for Video Production
- What Marketers Should Budget for Urgent Care Primary Care Video Marketing
- What Travel Marketers Should Budget for Video Marketing
- Branding services at Web Tonic
FAQ
What is the ROI of video marketing for fintech companies?
Video marketing ROI in financial services is 49% higher than other content formats. The payments industry sees 2.9x higher ROI from video content compared to other formats, while 82% of marketers report positive video returns. Brand lift from video views reaches 23%, translating to $7.2 ROI per view in the payments sector. The minimum benchmark for fintech advertising ROI is 300% ROAS.
How much do explainer videos improve fintech conversion rates?
Fintech landing pages with explainer videos see up to 64% higher conversion rates. For complex financial products, the uplift can reach 2.5x higher conversion, alongside a 25% reduction in support ticket volume. More broadly, landing pages with any form of video convert up to 80% higher than those without. The success benchmark is a 60% view-through rate rather than raw view count.
Which platform is best for fintech short-form video?
TikTok delivers the highest engagement at 2.34% for fintech short-form content, followed by Instagram Reels at 1.48% and YouTube Shorts at 0.91%. TikTok also offers 3.7x ROAS for fintech ads and 62% lower cost-per-lead than other platforms. LinkedIn Video drives the highest B2B engagement at 3.20%, making it the best platform for enterprise-focused fintech video content.
How are fintech companies increasing video production?
Financial services companies increased video creation by 189% year-over-year, though only 20% of fintech firms have a documented video strategy. AI tools have reduced explainer video costs from $2,000-$12,000 (agency) to $99-$500 (AI/DIY), making professional video accessible to fintech startups at every stage. The key is building repeatable production systems rather than one-off campaigns.
What video metrics should fintech companies track?
Key fintech video metrics include: play rate (25-30% for homepage, 8-14% for product pages), rate of action (3-8%), average watch percentage (~65%), conversion assists, and support ticket deflection (20-30% for help content). Track view-through rate over raw view counts — completion quality matters more than reach volume in financial services.
Sources
Zipdo — Financial Services Digital Marketing Statistics 2026
Wyzowl — Video Marketing Statistics 2026
Portfolio MC — Fintech Video Marketing
Vidico — Fintech Ads Best Practices 2026
Video Explainers — Fintech Explainer Videos
Oakgen — AI Explainer Videos for Fintech
Gitnux — Marketing in the Payments Industry
Naughty Marketing — Short Form Content for Fintech
Paid Media Studio — TikTok Ads Fintech 2026
Levitate Media — Video Conversion Statistics 2026
Fable Financial Films — Video in Financial Services
UrbanGeko — Fintech Video Marketing Strategy


