



Table of contents
Key Takeaways
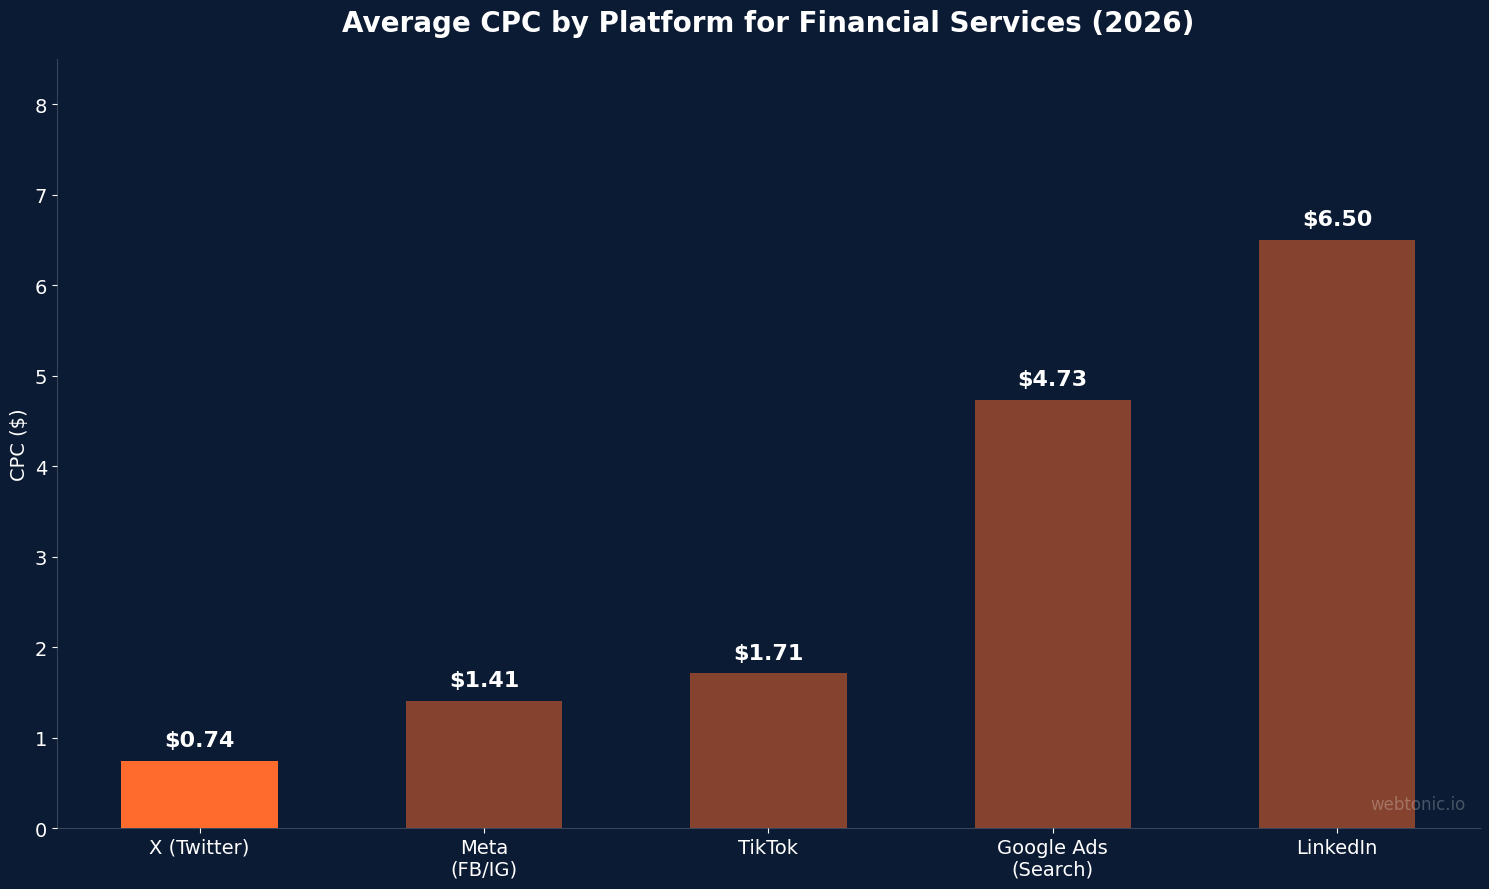
- X ads average a CPC of $0.74, roughly half of Meta's $1.41, making the platform one of the most cost-efficient paid social channels for fintech brands willing to navigate brand safety concerns (WebFX / HeyOz, 2026).
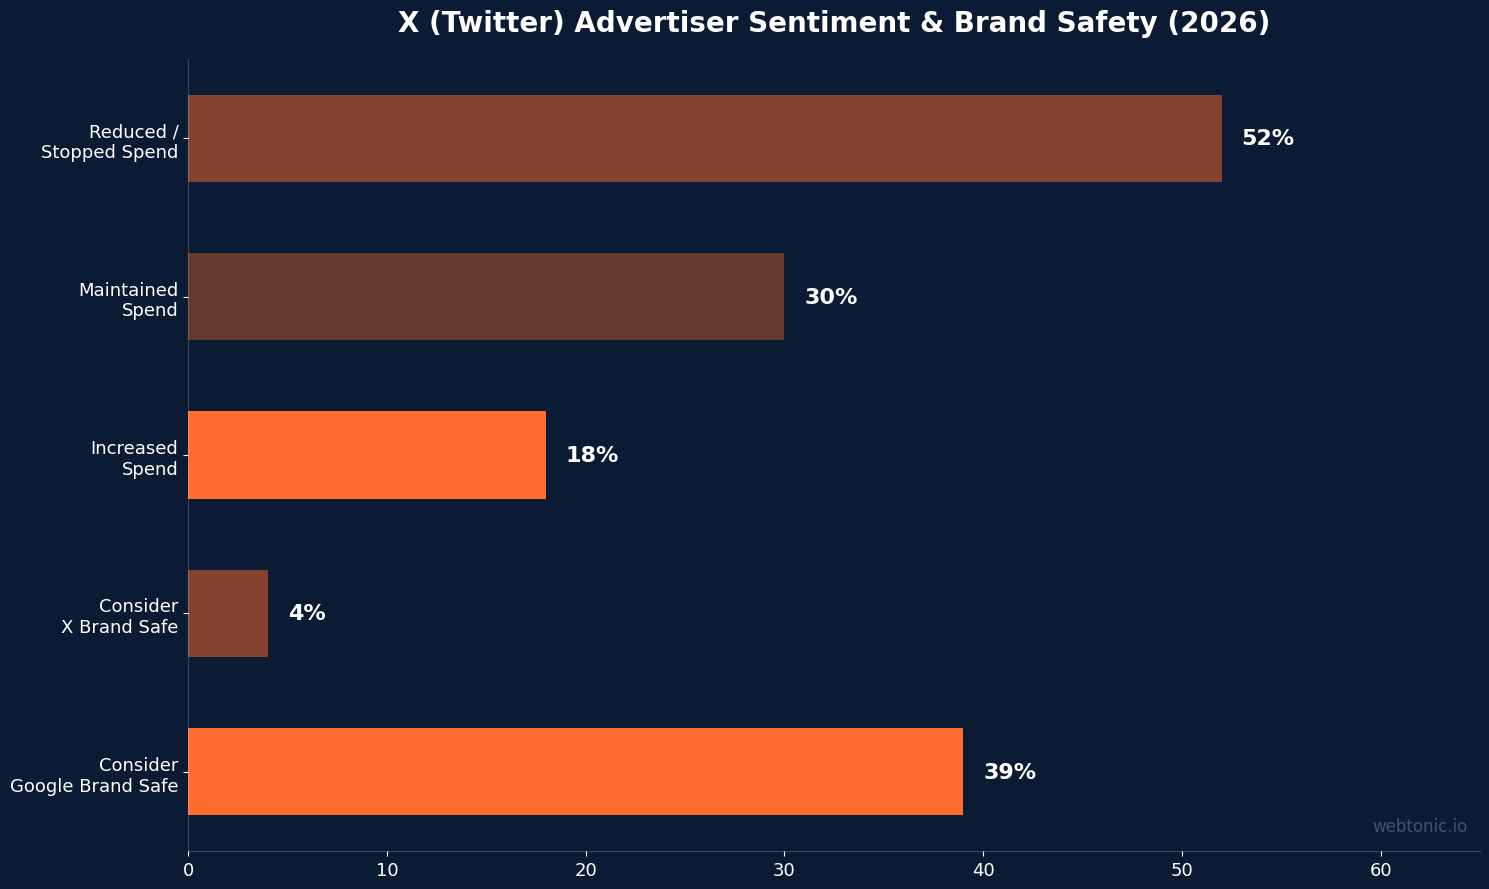
- 52% of marketers reduced or stopped their X ad budgets after the platform's ownership transition, while 18% increased spending to capitalize on the lower competition (SearchLab, 2026).
- Only 4% of marketers consider X ads brand safe, compared to 39% who trust Google Ads — a 10× gap that shapes fintech advertising decisions on the platform (The Global Statistics, 2026).
- X's average CTR of 0.86% sits between LinkedIn's 0.52% and Facebook's 0.90%, delivering competitive engagement for financial services content that thrives in real-time conversation contexts (The Global Statistics / Focus Digital, 2026).
- Financial services rank third by organic engagement on X at 0.025% per post, behind higher education (0.036%) and above the cross-industry median of 0.015% (SocialNexis, 2026).
- TradingBox achieved 6,134 free trials at $7.86 CPA through X advertising, demonstrating the platform's strength for fintech lead generation when targeting reaches active financial discussants (String Global, 2026).
- X's total ad revenue grew 7% year-over-year but remains below pre-acquisition levels, with subscriptions hitting $1 billion ARR and an estimated $500M–$2B xAI data licensing payment supplementing platform economics (True Interactive, 2026).
X (Twitter) Ads Cost Benchmarks for FinTech
The advertiser exodus from X following its 2022 ownership transition created a pricing environment that benefits performance-focused fintech brands. Lower competition has pushed costs down across every metric, though brand safety trade-offs remain central to the platform's value proposition.
| Metric | X (Twitter) Benchmark | Meta Comparison | Source |
|---|---|---|---|
| CPC (Cost Per Click) | $0.74 (avg) / $0.80–$2.50 (range) | $1.41 | WebFX / CO Consulting 2026 |
| CPM (Cost Per Mille) | $6.46 (avg) / $8–$15 (range) | $7.19 | HeyOz / CO Consulting 2026 |
| CTR (Click-Through Rate) | 0.86% | 0.90% | The Global Statistics 2026 |
| CPE (Cost Per Engagement) | $0.13 (median) | Variable | Enrich Labs 2026 |
| Engagement Rate | 0.59% | ~0.07–0.15% | Hootsuite 2026 |
| Conversion Rate | 0.02% | ~1.5–2.5% | Enrich Labs 2026 |
| Promoted Tweet CTR | 1–3% | N/A | SQ Magazine 2026 |
| CPL (Cost Per Lead) | $12–$40 | $27.66 | Twitter10K 2026 |
Platform Revenue and Advertiser Landscape
X's advertising ecosystem has stabilized after years of uncertainty, but the platform's revenue composition has shifted significantly from its pre-acquisition structure.
X's total ad revenue grew 7% year-over-year in 2026, a recovery signal but still well below pre-acquisition levels (True Interactive, 2026). Advertising contributes roughly 65% of X's total revenue, supplemented by subscriptions at $1 billion in annualized recurring revenue and an estimated $500 million–$2 billion xAI data licensing payment.
X captures about 1% of global digital ad revenue in 2026 (SQ Magazine, 2026). The platform reaches 586 million ad-reachable users globally, representing 7.1% of the world's population (SocialNexis, 2026). Advertisers ran 1.7 million ad campaigns across more than 250,000 advertiser accounts in 2024.
For fintech specifically, X delivers a distinct audience: financial services, B2B technology, media, and DTC brands with performance goals have the strongest case for advertising on the platform, while consumer packaged goods and mass-market retailers see less return.
Brand Safety and Advertiser Sentiment
Brand safety remains the dominant factor in fintech advertising decisions on X, with perception lagging behind the platform's actual moderation improvements.
Only 4% of marketers believe X ads are brand safe, compared to 39% who trust Google Ads — a nearly 10× gap that directly impacts fintech advertiser participation (The Global Statistics, 2026). This perception drives the broader trend: 52% of marketers have reduced or stopped X ad spending entirely since the ownership transition, while 18% increased their budgets to capture the resulting lower competition (SearchLab, 2026).
The opportunity for fintech brands lies precisely in this gap. X ads are cheaper than ever at $0.74 CPC due to the advertiser exodus, creating a "bargain buy" environment for brands with performance goals and internal brand safety protocols. Financial services companies with robust compliance frameworks can implement blocklists and category exclusions that mitigate most brand adjacency risks while capturing the cost advantages.
Ad engagement on X grew 22% year-over-year despite the advertiser pullback, suggesting that the remaining audience is more engaged, not less (The Global Statistics, 2026). Video ads outperform static image ads by 2–3× in engagement rate on the platform (HeyOz, 2026).
FinTech Engagement and Organic Performance on X
Beyond paid advertising, X maintains a unique organic position for fintech brands due to the platform's real-time, conversation-driven nature.
Financial services rank third by organic engagement rate on X at 0.025% per post, behind only higher education (0.036%) and above the cross-industry median of 0.015% (SocialNexis, 2026). This organic engagement provides a foundation for paid amplification: fintech posts that gain organic traction can be promoted as Spark-style ads for significantly lower costs than cold creative.
The platform hosts 611 million monthly active users in 2026, with financial discussion communities among the most active verticals. Real-time market commentary, regulatory updates, and product launches gain natural distribution in ways that other platforms cannot replicate.
For fintech specifically, X's character constraints and threaded conversation format favor data-driven, concise financial messaging that would feel out of place on visually-oriented platforms like Instagram or TikTok. Rate announcements, market data visualizations, and regulatory compliance updates all perform well organically and translate into effective paid creative.
FinTech X Ads Case Studies and ROI Data
Real-world performance data confirms that fintech brands can achieve strong returns on X when campaigns target the platform's financial discussion communities.
TradingBox achieved 6,134 free trials at $7.86 CPA through a structured X advertising campaign that generated 10.53 million impressions and 141,240 clicks (String Global, 2026). The campaign used a combination of free-trial conversion and remarketing education to build a repeatable acquisition model.
Broader X advertising delivers approximately 1:1 ROAS as a middle-tier channel, lower than Google search ads (3:1 to 6:1) but higher than cold-outreach channels like YouTube TrueView (CO Consulting, 2026). Real estate agents and capital raisers see the strongest returns among financial sub-verticals, with advisory businesses generating conversions through sales-call funnels that match X's discussion-oriented audience.
Average fintech CPA across all platforms is approximately £56 with a median ROAS of 3× (AdFuse AI, 2026). X's lower CPCs mean that fintech brands focused on top-of-funnel awareness and lead generation often achieve better unit economics on X than on more expensive platforms, provided they optimize for qualified leads rather than raw clicks.
X Ads Performance Compared to Other Platforms for FinTech
X occupies a distinct cost-performance position in the fintech media mix. Understanding these relative benchmarks helps allocate budget across channels effectively.
| Platform | Avg CPC | Avg CPM | Avg CTR | Brand Safety Trust |
|---|---|---|---|---|
| X (Twitter) | $0.74 | $6.46 | 0.86% | 4% |
| Meta (Facebook/IG) | $1.41 | $7.19 | 0.90% | ~30% |
| Google Ads | $3.00–$6.45 | Variable | 3–5% | 39% |
| $5.00–$8.00 | $30+ | 0.52% | ~35% | |
| TikTok | $1.71 | $13.20 | 0.72% | ~15% |
X Ad Formats and Creative Strategy for FinTech
X offers multiple ad formats, each with distinct performance characteristics for financial services advertisers. Understanding format-level benchmarks helps fintech brands allocate creative resources effectively.
Promoted tweets remain the dominant format for fintech advertisers, delivering 1–3% CTR when paired with financial data visualizations and market commentary (SQ Magazine, 2026). The format's native appearance in users' feeds generates significantly higher engagement than display-style placements.
An analysis of 111,000 X ads revealed that finance and sports betting brands cluster around text post + image card creative formats, using offer numbers and trust signals as the primary engagement drivers. Interactive Brokers, for example, anchors their X creative around specific rate offers and platform features rather than broad brand messaging.
The cost differential between formats is notable. Standard text + image CPC runs $0.74 on average, while video ads command a premium but deliver 2–3× the engagement rate. For fintech brands with existing video assets from performance creative programs, repurposing short-form content for X represents the highest efficiency play on the platform.
Collection ads on X average $0.75 CPC for mobile product showcases, making them suitable for fintech brands promoting multiple products — credit cards, savings accounts, and investment products — within a single ad unit. This format works particularly well for neobanks and multi-product fintech platforms looking to cross-sell existing users.
Best Practices for FinTech X Advertising
Fintech brands that succeed on X follow a pattern of strategic audience targeting combined with compliance-forward creative execution. Here are the key practices that growth marketing teams should implement:
- Implement comprehensive blocklists and category exclusions before launching campaigns. X's brand safety tools have improved, but fintech compliance requires proactive keyword and topic blocking to avoid adjacency to controversial content.
- Use video creative for 2–3× higher engagement compared to static image ads. Short-form financial explainers, market data visualizations, and product walkthroughs drive the best cost-per-engagement on the platform.
- Target financial discussion communities rather than broad demographic segments. X's conversation targeting lets you reach users actively discussing trading, neobanking, payments, and investment topics — audiences with proven intent signals.
- Promote organic posts that gain traction rather than running cold creative. The lower CPE ($0.13 median) means amplifying already-engaging financial content delivers the best cost efficiency on the platform.
- Focus on lead generation over direct conversion. X's 0.02% conversion rate makes it poorly suited for bottom-funnel e-commerce, but the $12–$40 CPL range makes it competitive for qualified lead acquisition.
- Monitor brand safety metrics alongside performance. Quarterly brand safety audits using third-party verification tools help maintain compliance while capturing X's cost advantages for multi-platform fintech campaigns.
Frequently Asked Questions
How much do X (Twitter) ads cost for fintech companies?
X ads for fintech average $0.74 CPC and $6.46 CPM, making the platform roughly half the cost of Meta on a per-click basis. CPL ranges from $12–$40 for financial services lead generation. The lower costs result from the advertiser exodus that reduced competition across the platform.
Are X ads brand safe for fintech companies?
Only 4% of marketers consider X ads brand safe, the lowest of any major platform. However, fintech brands with internal compliance frameworks can mitigate risks through keyword blocklists, category exclusions, and third-party verification tools. The cost savings often justify the additional compliance overhead.
What ROI can fintech brands expect from X advertising?
X advertising delivers approximately 1:1 ROAS as a middle-tier channel. TradingBox achieved 6,134 free trials at $7.86 CPA, demonstrating that targeted fintech campaigns can generate strong unit economics. Real estate and capital-raising sub-verticals see the strongest returns.
How does X compare to Meta for fintech ad performance?
X is cheaper ($0.74 vs $1.41 CPC) with nearly identical CTR (0.86% vs 0.90%), but its conversion rate is significantly lower at 0.02% versus Meta's 1.5–2.5%. X works best for awareness and lead generation, while Meta dominates full-funnel conversion.
Is X advertising growing or declining in 2026?
X ad revenue grew 7% year-over-year in 2026 after years of decline post-acquisition. Ad engagement increased 22% YoY, and the platform now generates roughly $1B in subscription revenue alongside its advertising business. Financial services remains one of X's strongest verticals.
Sources
theglobalstatistics.com — X (Twitter) Advertising Statistics 2026
heyoz.com — Are X Ads Worth It for Businesses in 2026
trueinteractive.com — Where Does X Stand with Advertisers in 2026
sqmagazine.co.uk — Twitter (X) Statistics 2026
christopholivierconsulting.com — X Ads in 2026: When They Pay Back
socialnexis.com — X (Twitter) Statistics 2026
string.global — TradingBox X Ads Case Study
searchlab.nl — X (Twitter) Statistics 2026
adfuseai.com — Fintech CPA Benchmarks 2026


