



Table of contents
Key Takeaways
Organic search accounts for 28.5% of all fintech website traffic, making it the second-largest channel behind direct visits at 44.1%. The top 10% of fintech companies generate over 24,000 organic visits per month with an estimated traffic value exceeding $200,000, while the median fintech site captures roughly 700 monthly organic sessions. Fintechs with verified author schemas and regulatory disclosure pages rank in the top 5 for primary terms 2.7× more often than those without these E-E-A-T signals. B2B fintech SaaS companies see organic SQL rates between 0.3% and 1.2%, with top performers pushing 1.5–3%. Fintech keyword difficulty averages significantly higher than most verticals, requiring 12–16 months of consistent authority building before meaningful ranking gains emerge.
Fintech SEO Performance at a Glance — 2026 Benchmarks
| Metric | FinTech Benchmark | All-Industry Average |
|---|---|---|
| Organic traffic share | 28.5% | 40–50% |
| Direct traffic share | 44.1% | 25–35% |
| Median organic visits/mo | ~700 | 1,500–3,000 |
| P90 organic visits/mo | 24,211 | 15,000–25,000 |
| Organic SQL rate (B2B SaaS) | 0.3–1.2% | 1–3% |
| E-E-A-T ranking advantage | 2.7× more top-5 positions | 1.5–2× |
| Time to rank (primary terms) | 12–16 months | 6–12 months |
Sources: CuFinder, Authority Specialist, Content RevOps, Daydream
Traffic Sources and Channel Mix for Fintech Websites
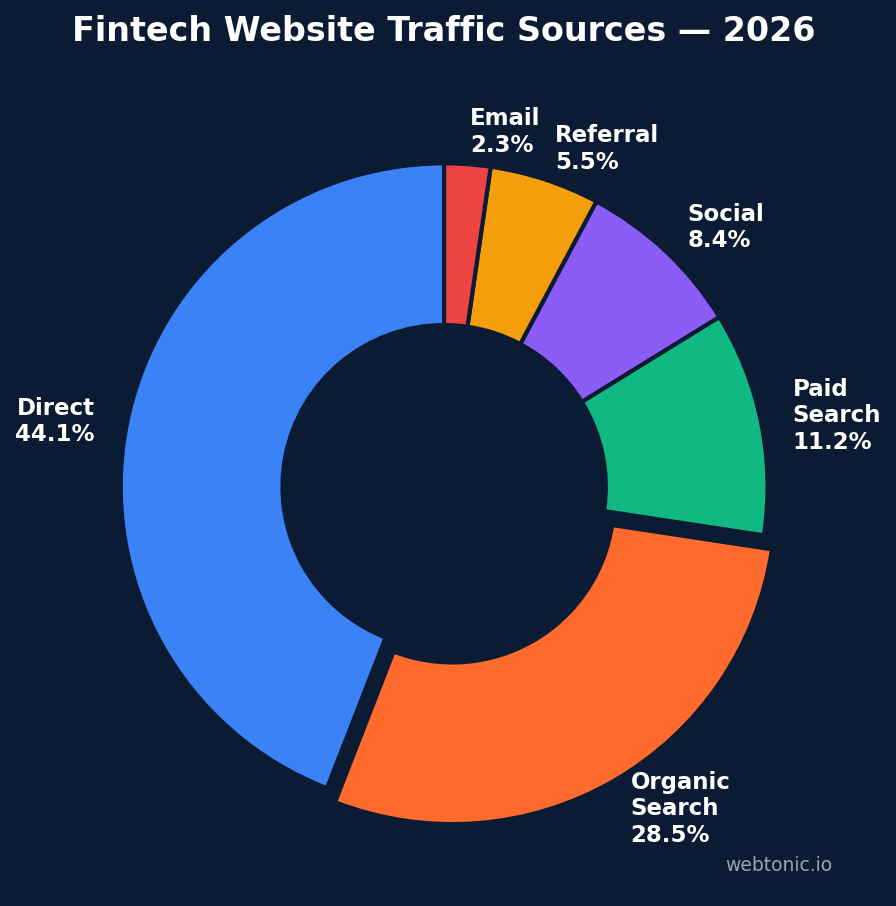
CuFinder's 2026 fintech marketing benchmarks reveal an unusual channel distribution. Direct traffic dominates at 44.1%, reflecting the strength of fintech brand recognition — nearly half of visitors arrive by typing URLs directly or launching apps. Organic search contributes 28.5% of traffic, followed by paid search at 11.2%, social at 8.4%, referral at 5.5%, and email at 2.3%.
The 44.1% direct traffic figure distinguishes fintech from most B2B verticals where organic search typically leads. It suggests that fintech users develop strong brand preferences — once a user trusts a payment platform, lending app, or investment tool, they return directly rather than searching again. However, organic search remains the primary discovery channel for new users who have not yet formed a brand preference, making SEO critical for top-of-funnel acquisition.
For companies building integrated growth marketing programs, this channel distribution suggests a two-track strategy: brand-building campaigns to maintain the direct traffic base, and SEO investment to capture the 28.5% of visitors arriving through search discovery. Neglecting either channel leaves significant volume on the table.
Organic Traffic Distribution Across Fintech Companies
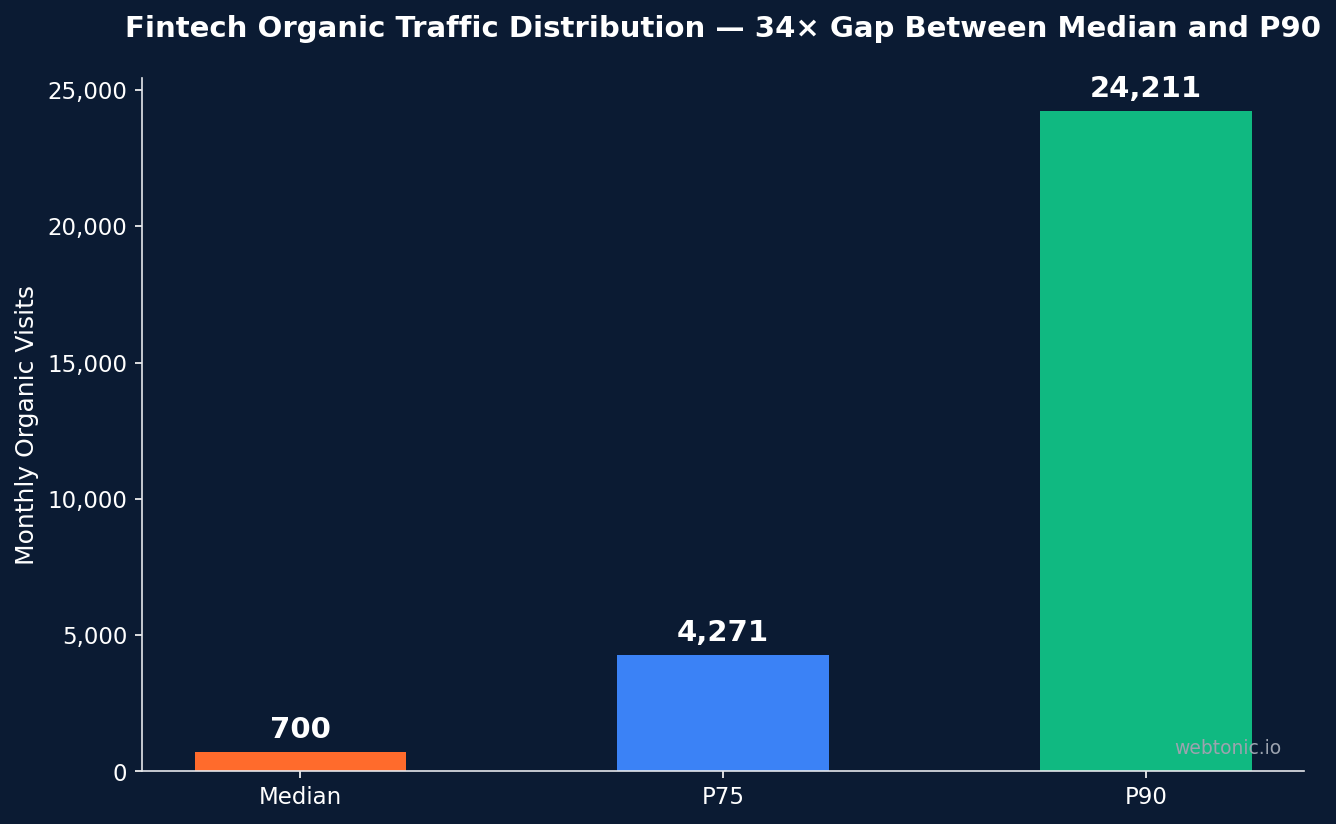
The gap between median and top-performing fintech companies is enormous. Content RevOps' 2026 fintech benchmarks break down the distribution clearly:
| Percentile | Ranked Keywords | Organic Traffic/mo | Est. Traffic Value/mo |
|---|---|---|---|
| Median | 110 | ~700 | ~$4,900 |
| P75 | 1,500 | 4,271 | $50,000 |
| P90 | 8,000+ | 24,211 | $200,000+ |
Source: Content RevOps — State of Content Marketing for Fintech 2026
The 34× gap between median organic traffic (700/mo) and P90 (24,211/mo) reflects the compounding nature of SEO in competitive verticals. Companies that cross the P75 threshold of 1,500 ranked keywords tend to see accelerating returns as topical authority compounds and internal linking structures mature. Top-tier performers like Revolut demonstrate the ceiling, with over 126,000 ranking keywords and 2,768 in positions 1–3 (SALT Agency).
E-E-A-T Signals and Their Impact on Fintech Rankings
Google's emphasis on Experience, Expertise, Authoritativeness, and Trustworthiness hits fintech harder than almost any other vertical because financial content falls under the "Your Money or Your Life" (YMYL) classification. Authority Specialist's 36-company study quantified the impact: fintechs with verified author schemas and regulatory disclosure pages rank in the top 5 for primary terms 2.7× more often than those without these signals.
The practical implications are significant. Companies that treat author bios, credential verification, and regulatory compliance pages as SEO assets — not just legal requirements — create measurable ranking advantages. Content published under named experts with verifiable credentials consistently outperforms anonymous or brand-authored content in fintech SERPs, particularly for high-intent transactional queries where Google applies the strictest quality thresholds.
This E-E-A-T premium also extends to link building. Links from sources that themselves demonstrate financial expertise (industry publications, regulatory bodies, established financial media) carry more weight than links from general-authority domains. For teams coordinating across data intelligence and content strategy, building an E-E-A-T foundation amplifies the value of every subsequent SEO investment.
Conversion Rates and Organic Lead Quality
Daydream's fintech SEO analysis provides conversion benchmarks that help teams set realistic expectations. B2B fintech SaaS companies see organic SQL rates between 0.3% and 1.2% initially, with top performers driving 1.5–3% of organic traffic to sales-qualified events such as trial signups, demo requests, or contact form submissions.
These rates are lower than SaaS averages because fintech purchasing decisions involve higher stakes, longer evaluation cycles, and more decision-makers. However, the quality of organic leads tends to be substantially higher than paid leads — organic visitors have already self-qualified through their search behavior and are further along the consideration journey. Growpad's case study documented a 2× increase in organic MQLs within five months by aligning content strategy with high-intent keyword clusters rather than chasing volume metrics.
Click-through rates for fintech SERPs are depressed by paid ad saturation and rich features — position one doesn't always deliver the traffic volume it would in less commercialized verticals (Authority Specialist). This makes conversion optimization on landing pages even more critical: every organic visitor that does click through carries higher replacement cost than in less competitive niches. Building integrated search strategies that combine SEO with paid can help capture traffic across both channels.
Keyword Difficulty and Ranking Timelines
Fintech keyword competition sits well above most B2B verticals. Authority Specialist's data shows that primary fintech terms require 12–16 months of consistent authority building before meaningful ranking gains emerge. Early ranking attempts accumulate impressions before clicks, with the typical pattern showing search console impressions growing steadily for 3–6 months before click-through rates begin improving.
The keyword difficulty landscape creates a natural barrier to entry that protects established players. Companies that pause SEO investment after six months of modest results typically exit just before the inflection point where authority compounds into consistent top-10 placements. The fintech companies that dominate organic results have maintained SEO programs for 24 months or longer, building content depth and backlink profiles that create defensible competitive moats.
This extended timeline has budget implications. Fintech SEO programs need to be funded as 18–24 month initiatives rather than 6-month experiments. Teams evaluating agency partnerships for organic growth should evaluate candidates on their understanding of fintech's longer ranking cycles and their willingness to set realistic milestone expectations.
AI Overviews and SERP Feature Trends
The emergence of AI Overviews in financial search results is reshaping fintech SEO strategy. Search Engine Land's analysis of fintech in AI search found that AI Overviews appear on a growing share of financial queries, pulling featured snippet and organic click traffic into Google's AI-generated answers. FintechSpecs' research confirms that the companies cited in AI Overviews tend to have strong structured data, clear E-E-A-T signals, and comprehensive pillar content.
For fintech brands, this means content strategy must optimize for citation in AI-generated responses alongside traditional ranking positions. Comparison tables, structured FAQ sections, and data-rich content formats increase the likelihood of AI Overview citation, while thin or opinion-heavy content is increasingly filtered out. Companies that build their content architecture around structured data and clear factual claims position themselves for both traditional SERP dominance and AI discovery channels.
Fintech SEO Benchmarks vs. Other Financial Verticals
Understanding how fintech compares to related financial verticals helps teams calibrate performance expectations and identify competitive opportunities.
| Metric | FinTech | Banking | Wealth Management |
|---|---|---|---|
| Organic traffic share | 28.5% | 38–54% | 30–45% |
| Direct traffic share | 44.1% | 30–40% | 25–35% |
| Avg. keyword difficulty | High (60–80+) | High (55–75) | Medium-High (45–65) |
| Time to rank (primary) | 12–16 months | 8–14 months | 6–12 months |
| E-E-A-T impact | Critical (YMYL) | Critical (YMYL) | Critical (YMYL) |
Sources: Authority Specialist, CuFinder
Fintech's higher direct traffic share and lower organic share relative to banking reflects the app-first nature of many fintech products. Users who adopt a neobank or payment platform tend to return via the app rather than searching again, which inflates direct traffic while depressing organic share as a percentage. This doesn't indicate weak SEO — it indicates a different user journey where organic search serves primarily as the acquisition channel rather than a retention one.
Best Practices for Fintech SEO Programs
- Fund 18–24 month programs — Primary fintech terms take 12–16 months to rank; cutting investment at 6 months wastes the foundation already built.
- Invest in E-E-A-T infrastructure — Verified author schemas, regulatory disclosures, and credential pages create a 2.7× ranking advantage. Treat these as core SEO assets.
- Target the P75 keyword threshold — Companies crossing 1,500 ranked keywords see accelerating returns. Structure content strategy to reach this tipping point.
- Optimize for AI citation — Build structured data, FAQ schemas, and comparison tables that AI Overviews and chat assistants can reference and cite.
- Measure organic SQL rate, not just traffic — The 0.3–1.2% baseline sets realistic expectations; focus on moving into the 1.5–3% top-performer range through intent alignment.
- Balance organic with brand investment — The 44.1% direct traffic share means brand awareness amplifies SEO returns by growing the pool of users who return directly. Organic acquires them; brand retains them.
- Use performance creative to support organic content — Visual assets created for paid campaigns can enhance blog and pillar page engagement, improving time-on-page signals that correlate with ranking stability.
- Build structured comparison and data content — Tables, calculators, and benchmark data earn both organic links and AI Overview citations, creating dual-channel visibility.
Related reading
- FinTech Technical SEO Statistics: 2026 Benchmarks & Data
- SEO for Fintech: A Practical Growth Playbook
- Fintech Local SEO Statistics Every Marketer Should Know (2026)
- GEO & AEO services at Web Tonic
Frequently Asked Questions
What percentage of fintech traffic comes from organic search?
Organic search accounts for 28.5% of all fintech website traffic according to CuFinder's 2026 benchmarks. While this trails the all-industry average of 40–50%, fintech's unusually high direct traffic share (44.1%) reflects strong brand loyalty rather than weak SEO performance — organic remains the primary discovery channel for new users who haven't yet formed a product preference. Paid search adds 11.2% and social contributes 8.4%.
How long does it take for fintech SEO to show results?
Primary fintech terms typically require 12–16 months of consistent investment before meaningful ranking gains materialize. Search console impressions often grow for 3–6 months before click-through rates begin improving, which can be discouraging for teams expecting faster feedback loops. Companies that maintain programs for 24+ months build defensible positions that are difficult for competitors to displace, while those that cut investment at the 6-month mark typically exit just before the inflection point where authority compounds.
What is the organic conversion rate for fintech companies?
B2B fintech SaaS companies see organic SQL rates between 0.3% and 1.2% initially, with top performers reaching 1.5–3%. While lower than SaaS averages, organic fintech leads are typically higher quality with longer lifetime value due to the considered nature of financial purchasing decisions.
How does E-E-A-T affect fintech SEO rankings?
E-E-A-T has a measurable impact. Fintechs with verified author schemas and regulatory disclosure pages rank in the top 5 for primary terms 2.7× more often than those without. Financial content falls under Google's YMYL classification, which applies the strictest quality thresholds to ranking decisions.
How many organic visits does a typical fintech website get?
The median fintech company generates approximately 700 organic visits per month, while P75 companies reach 4,271 and the top 10% exceed 24,000 monthly organic visits. The 34× gap between median and P90 reflects the compounding nature of SEO investment in competitive verticals where authority builds over time. Specialized agencies can help accelerate this trajectory through targeted content and link strategies.
Sources
cufinder.io
authorityspecialist.com
contentrevops.com
withdaydream.com
growpad.pro
salt.agency
searchengineland.com
fintechspecs.com
seoprofy.com


