Table of contents

Zero percent of banks can reliably attribute all marketing outcomes to spend — not a low number, literally zero — yet fintech teams implementing multi-touch attribution report 14–36% CPA improvement and an average 19% ROI lift in the first year. These statistics reveal the measurement gap that defines fintech marketing in 2026.
Key Takeaways
- 0% of banks can fully attribute marketing outcomes to spend, according to Cornerstone Advisors' survey of 126 senior executives.
- Multi-touch attribution adoption reached 58% in 2024, up from lower adoption rates, with data-driven attribution models now dominating.
- MTA delivers 14–36% CPA improvement and an average 19% ROI lift in the first year of implementation.
- Fintech CAC ranges from $50 to $14,772 depending on segment, making accurate attribution essential for budget allocation.
- Paid search receives the most budget, yet email delivers the strongest ROI — a structural misalignment attribution could fix.
- DDA auto-reverts to last-click below 600 monthly conversions, leaving most financial services firms with degraded attribution.
FinTech Attribution Benchmarks at a Glance
| Metric | Value | Source |
|---|---|---|
| Banks Fully Attributing ROI | 0% | Cornerstone Advisors |
| MTA Adoption Rate | 58% (2024) | Improvado |
| CPA Improvement from MTA | 14–36% | Improvado |
| Avg ROI Lift (Year 1 MTA) | 19% | Improvado |
| DDA Revert Threshold | <600 monthly conversions | Ridley & Co |
| Path Observability (MTA) | ~55% | Ridley & Co |
| CAC Range (FinTech) | $50–$14,772 | Foundry CRO |
| CAC Surge (Past Decade) | +222% | Prospeo |
| LTV:CAC Ratio (B2B FinTech) | 5:1 | Prospeo |
The Attribution Gap in Financial Services
The scale of the attribution problem in financial services is staggering. Ridley & Co's analysis of attribution in regulated finance cites a Cornerstone Advisors survey of 126 senior executives finding that zero percent of banks can reliably attribute all outcomes to their marketing spend. This is not a rounding error — it represents a structural measurement failure across the industry.
The Cornerstone Advisors Marketing ROI Gap report reveals the consequences: paid search receives the largest share of marketing budget, yet email is cited as delivering the strongest ROI. This disconnect between where dollars go and where institutions see the best return is a direct result of broken attribution. Financial institutions are systematically misallocating spend because they lack the data intelligence to measure what works.
Multi-Touch Attribution Adoption and Impact
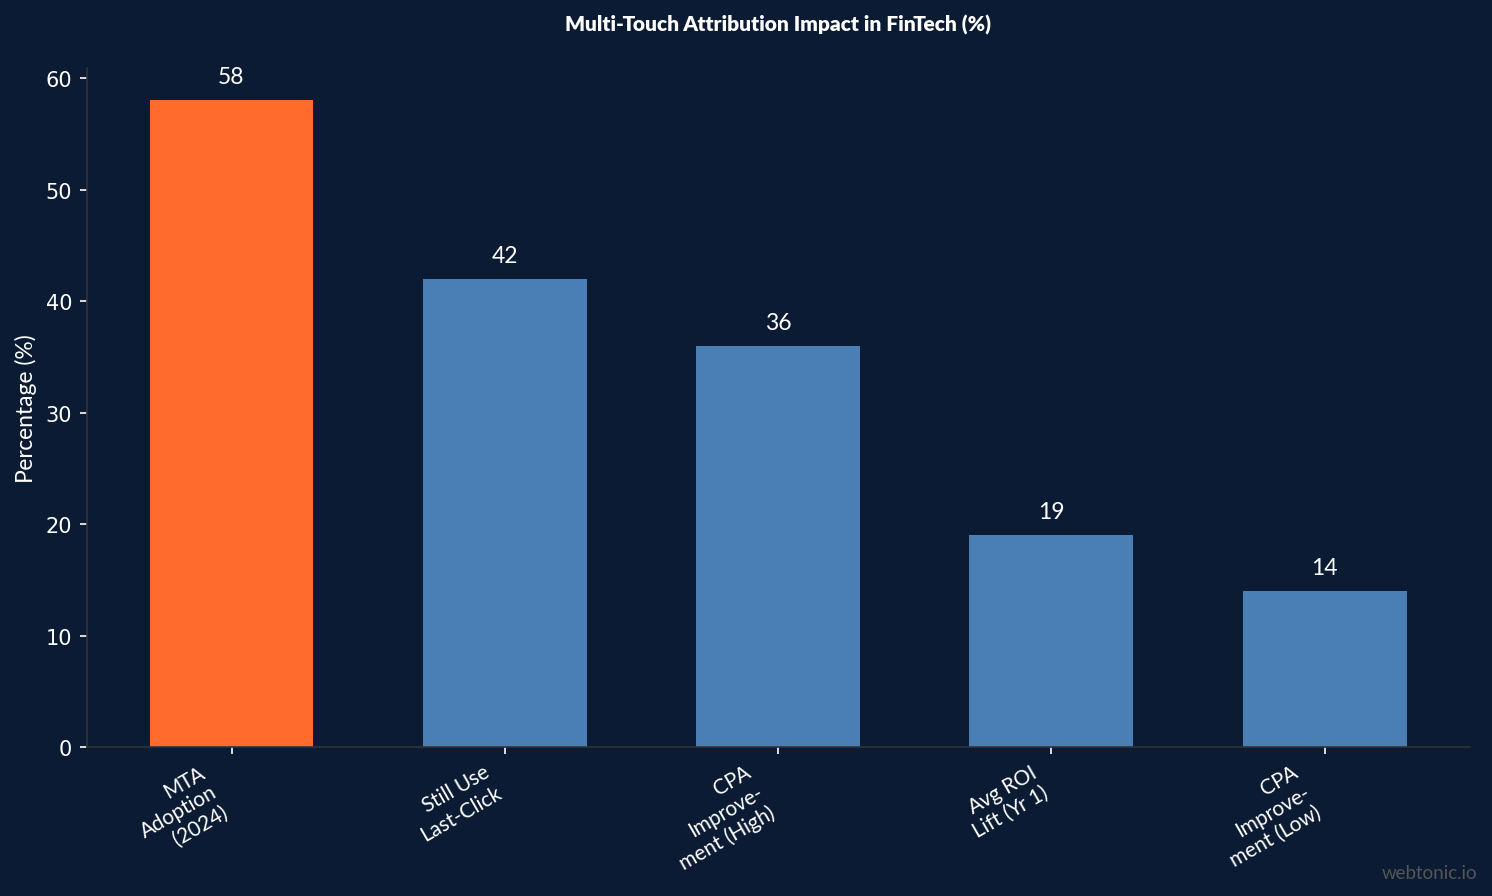
Despite the challenges, adoption is accelerating. Improvado's 2026 analysis reports that multi-touch attribution adoption grew to 58% in 2024. Teams implementing MTA report 14–36% cost-per-acquisition improvement and an average 19% ROI lift in the first year.
| Attribution Model | Strengths | Limitations for FinTech |
|---|---|---|
| Last-Click | Simple, universal | Ignores 60–120 day B2B sales cycles; credits only final touchpoint |
| Data-Driven (DDA) | Algorithmic credit distribution | Auto-reverts to last-click below 600 monthly conversions |
| Multi-Touch (MTA) | 14–36% CPA improvement | ~55% path observability; privacy constraints reduce data |
| Marketing Mix Modeling | Aggregate-level, privacy-safe | Requires 2+ years of data; slow to react |
| Incrementality Testing | Proves causal impact | Expensive to run; requires holdout groups |
However, Ridley & Co's detailed analysis warns that platform attribution overstates channel contributions: "Platform attribution suggests display contributed to 15% of conversions, but path observability is estimated at only ~55%." Google Analytics 4 defaults to DDA, but it auto-reverts to last-click below 600 monthly conversions — a threshold most financial services firms never hit. This means most fintech companies are operating with degraded attribution whether they realize it or not.
Customer Acquisition Cost Benchmarks by FinTech Segment
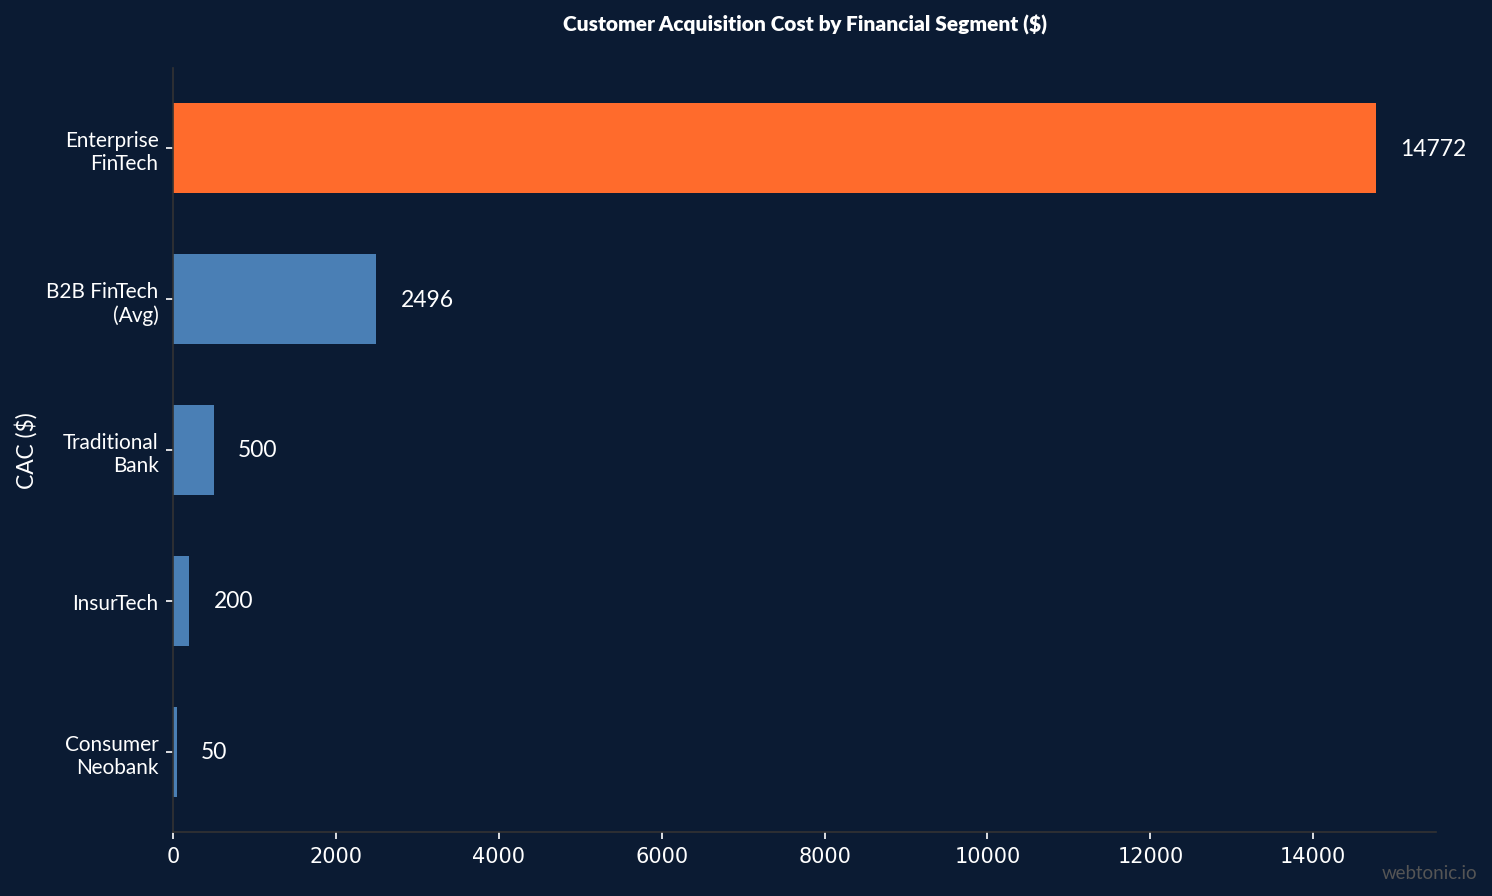
The CAC spread across fintech segments makes attribution accuracy existential. Foundry CRO's 2026 benchmarks document a $50 (consumer neobank) to $14,772 (enterprise fintech) range — a 295× spread within the same industry. "Fintech average CAC" is meaningless without product-type context.
| FinTech Segment | CAC | LTV | LTV:CAC |
|---|---|---|---|
| Consumer Neobank | $50 | $300–$800 | 6–16:1 |
| Consumer Lending | $150–$400 | $1,200–$3,000 | 3–8:1 |
| B2B FinTech (Avg) | $2,496 | $11,700 | 5:1 |
| Enterprise FinTech | $14,772 | $75,000+ | 5–7:1 |
| Payments / Processing | $200–$600 | $2,000–$8,000 | 4–10:1 |
Across digital businesses broadly, acquisition costs have surged 222% over the past decade, with digital ad costs climbing another 5.13% in 2025 alone (Prospeo). For B2B fintech specifically, the average LTV of $11,700 against a CAC of $2,496 yields a healthy 5:1 LTV:CAC ratio — but only if attribution correctly assigns credit across the 60–120 day decision cycle that Bill Rice Strategy Group identifies as typical for enterprise fintech sales.
Channel Attribution Challenges in FinTech
FinTech marketers face unique attribution challenges that most industries don't encounter. Hefflin's analysis of fintech CAC reduction identifies bad attribution as the biggest source of wasted fintech marketing spend. Most companies still rely on last-click attribution, meaning all credit goes to the final touchpoint before sign-up.
| Challenge | Impact on FinTech | Mitigation |
|---|---|---|
| Privacy Regulations (GDPR/CCPA) | Reduces trackable user journeys by 30–45% | Server-side tracking, consent-mode v2 |
| iOS ATT (App Tracking Transparency) | Blocks 75–85% of iOS conversion paths | SKAN, modeled conversions, MMM |
| Long B2B Sales Cycles (60–120 days) | Attribution windows miss late-stage conversions | Extended windows, CRM-linked attribution |
| Multi-Product Journeys | Users evaluate 3–5 products before selecting | Product-level attribution, cohort analysis |
| Regulatory Compliance Restrictions | Can't use all standard tracking pixels | Consent-based tracking, first-party data |
TrafficGuard warns about "ghost conversions" in fintech — last-touch and blended attribution models that make CAC look healthy while growth stalls. The root cause is that these models count touchpoints that didn't actually drive the decision, masking the true cost of acquisition across paid search and social channels.
FinTech Attribution Best Practices for 2026
- Move beyond last-click immediately. With 0% of banks fully attributing marketing ROI, even partial MTA implementation delivers 14–36% CPA improvement. Start with a linear or position-based model before investing in DDA.
- Verify your DDA threshold. If you have fewer than 600 monthly conversions, GA4's DDA has silently reverted to last-click. Supplement with MMM or incrementality testing for budget decisions.
- Match attribution windows to sales cycles. B2B fintech sales cycles run 60–120 days. A 7-day or 28-day attribution window misses the majority of influenced conversions.
- Triangulate with three models. Combine MTA (path-level), MMM (aggregate), and incrementality testing (causal) for a complete measurement picture — no single model captures fintech's complexity.
- Track funded accounts, not just leads. IREV's analysis shows fintech attribution must extend through application approval, first deposit, and first transaction — not stop at lead capture.
- Audit the email vs. paid search gap. If your budget allocation mirrors the Cornerstone finding (most budget to paid search, strongest ROI from email), rebalance based on attributed revenue, not spend history.
FinTech Attribution vs. Other Industries
| Metric | FinTech | E-commerce | B2B SaaS |
|---|---|---|---|
| MTA Adoption | 58% | 72% | 65% |
| Avg Attribution Window | 60–120 days | 7–14 days | 30–90 days |
| Path Observability | ~55% | ~75% | ~60% |
| DDA Viable (>600 conv/mo) | Rare for B2B | Common | Moderate |
| CAC Range | $50–$14,772 | $10–$200 | $500–$5,000 |
| Primary Challenge | Regulatory + long cycles | Multi-device tracking | Multi-stakeholder journeys |
FinTech faces the hardest attribution environment in digital marketing. The combination of regulatory constraints, long B2B sales cycles, and multi-product user journeys creates measurement complexity that e-commerce and even B2B SaaS rarely encounter. This is why the 19% average ROI lift from MTA implementation in fintech often exceeds gains in other verticals — the starting baseline is so much worse.
Building an Attribution Stack for FinTech in 2026
The most effective fintech marketing teams in 2026 are moving beyond single-model attribution toward a triangulated measurement stack. This approach acknowledges that no individual model captures the full complexity of fintech customer acquisition, where buyers research across multiple channels over extended timelines before converting.
The recommended stack combines three layers. First, multi-touch attribution at the path level provides granular journey insights for campaigns with sufficient conversion volume. Despite its limitations — approximately 55 percent path observability and degradation below 600 monthly conversions — MTA remains the best tool for understanding which specific touchpoints influence decisions at the individual level. Teams implementing MTA correctly see the documented 14 to 36 percent CPA improvement because they can identify and eliminate truly underperforming touchpoints rather than guessing.
Second, marketing mix modeling at the aggregate level provides a privacy-safe view of channel contribution that is unaffected by cookie deprecation or iOS tracking restrictions. MMM requires at least two years of historical spend and performance data, which limits its utility for early-stage fintechs. However, for established companies with the data foundation, MMM provides the budget allocation guidance that path-level attribution cannot — particularly for brand awareness channels whose impact is diffused across many touchpoints over long periods.
Third, incrementality testing provides causal proof that specific marketing activities drive outcomes beyond what would have occurred organically. While expensive to run — requiring holdout groups that sacrifice some short-term revenue — incrementality tests resolve the fundamental question that neither MTA nor MMM can answer definitively: did this campaign actually cause these conversions, or would they have happened anyway? For fintech companies investing heavily in channels like Meta Ads or Google Ads, incrementality testing is the only way to distinguish true contribution from correlation.
The key insight from the Cornerstone Advisors research is that zero percent full attribution does not mean zero progress. Even partial implementation of a triangulated stack delivers meaningful improvement over the industry default of last-click attribution. The gap between the average fintech marketing team and best-in-class is not technology — it is the organizational commitment to measure properly and act on what the data reveals.
Frequently Asked Questions
What percentage of financial institutions can fully attribute marketing ROI?
Zero percent. A Cornerstone Advisors survey of 126 senior executives found that no banks can reliably attribute all marketing outcomes to their spend. This represents a structural measurement failure across the industry, with paid search receiving the most budget while email delivers the strongest ROI.
What is the ROI of implementing multi-touch attribution in fintech?
Teams implementing MTA report 14–36% cost-per-acquisition improvement and an average 19% ROI lift in the first year. MTA adoption reached 58% in 2024, with data-driven attribution models now dominating the market.
Why does GA4 data-driven attribution fail for most fintech companies?
GA4's data-driven attribution auto-reverts to last-click below 600 monthly conversions. Most B2B fintech companies never hit this threshold, meaning they operate with degraded attribution that credits only the final touchpoint in 60–120 day sales cycles.
What is the average fintech customer acquisition cost?
Fintech CAC ranges dramatically by segment: $50 for consumer neobanks, $150–$400 for consumer lending, $2,496 average for B2B fintech, and up to $14,772 for enterprise fintech. The B2B average yields a 5:1 LTV:CAC ratio with an average LTV of $11,700.
How should fintech companies measure marketing attribution in 2026?
The recommended approach is triangulation: combine multi-touch attribution for path-level insights, marketing mix modeling for aggregate-level analysis, and incrementality testing for causal proof. Extend attribution windows to match 60–120 day B2B sales cycles and track through funded accounts, not just leads.
Sources
Ridley & Co — Attribution in Regulated Finance (Cornerstone Survey)
Ridley & Co — Why Last-Click Fails in Financial Services
Improvado — 12 Best Multi-Touch Attribution Solutions (2026)
Cornerstone Advisors / Fintel Connect — Marketing ROI Gap in Banking
Foundry CRO — Fintech CAC 2026 by Product Type
Prospeo — Fintech Customer Acquisition Cost: 2026 Benchmarks
Bill Rice Strategy Group — B2B Attribution Modeling for Fintech
Hefflin — How Fintech Companies Reduce CAC with Data
TrafficGuard — Ghost Conversions in Fintech
IREV — Fintech Affiliate Attribution: Leads to Funded Accounts
CUFinder — FinTech Industry Marketing Benchmarks 2026
Data Ally — Fintech Marketing Trends 2026