



Table of contents
Fintech landing pages convert at 4.6% on average but top performers reach 26.1% — a 5.7x gap that represents the single largest optimization opportunity before the KYC funnel even begins. In 2026, the intersection of regulatory friction and digital-first customer expectations makes landing page performance a decisive competitive advantage.
Key Takeaways
- Fintech landing pages convert at 4.6% on average, with registration-to-funded-account completion running at 18% (CuFinder).
- Financial services landing pages hit 8.4% median conversion, and top 10% performers reach 26.1% — a 3x gap between median and elite (FoundryCRO).
- The all-industry median landing page conversion rate is 6.6% based on 464 million visits, putting fintech below average due to regulatory and trust barriers (FoundryCRO).
- Fintech bounce rate averages 48.5%, with mobile at 54% and desktop at 38% — a 16-percentage-point device gap that demands mobile-first optimization (CuFinder).
- Single-field forms convert at 13.4%, dropping to 7.8% at five fields and 3.6% at ten-plus fields, per Unbounce's 2026 analysis of 1.4 million forms (DigitalApplied).
- Monzo's AI-assisted landing page achieved a 9.7% conversion uplift over the legacy version through optimized content layout and user flow refinement (HotMinute).
- Lulo Bank reduced onboarding drop-off by 15% through data-driven landing page personalization and audience segmentation (Rokt).
Fintech Landing Page Benchmarks at a Glance
The table below compiles 2026 conversion and engagement benchmarks specific to fintech landing pages, drawing from multiple research sources.
| Metric | Fintech Average | All-Industry Average | Top 10% Performers |
|---|---|---|---|
| Landing Page CVR | 4.6% | 6.6% | 26.1% |
| Bounce Rate | 48.5% | 45.0% | <25% |
| Mobile Bounce Rate | 54% | 50% | <32% |
| Time on Page | 52 sec | 54 sec | 80+ sec |
| Form Completion | 18% (reg→funded) | 28% | 45%+ |
Sources: CuFinder, FoundryCRO, Benchmarketing, Gitnux.
Conversion Rate by Financial Product Type
Not all fintech products convert at the same rate. The complexity of the product, the level of regulatory compliance required, and the trust barrier all impact landing page performance. FoundryCRO's product-level analysis and CuFinder's benchmark data combine to paint a detailed picture:
| Product Category | LP Conversion Rate | Reg→Funded Rate | Key Friction Point |
|---|---|---|---|
| Neobank Account | 5.5–8.0% | 22–30% | KYC/ID verification |
| Payment / Wallet App | 6.0–10.0% | 35–45% | App download barrier |
| Personal Loan | 2.5–4.5% | 8–15% | Credit check anxiety |
| Business Lending | 1.8–3.2% | 5–12% | Documentation requirements |
| Insurtech Quote | 3.0–5.5% | 12–20% | Personal info sensitivity |
| WealthTech / Robo | 3.5–6.0% | 15–25% | Suitability assessment |
| B2B Fintech Demo | 2.0–4.0% | 10–18% | Enterprise decision process |
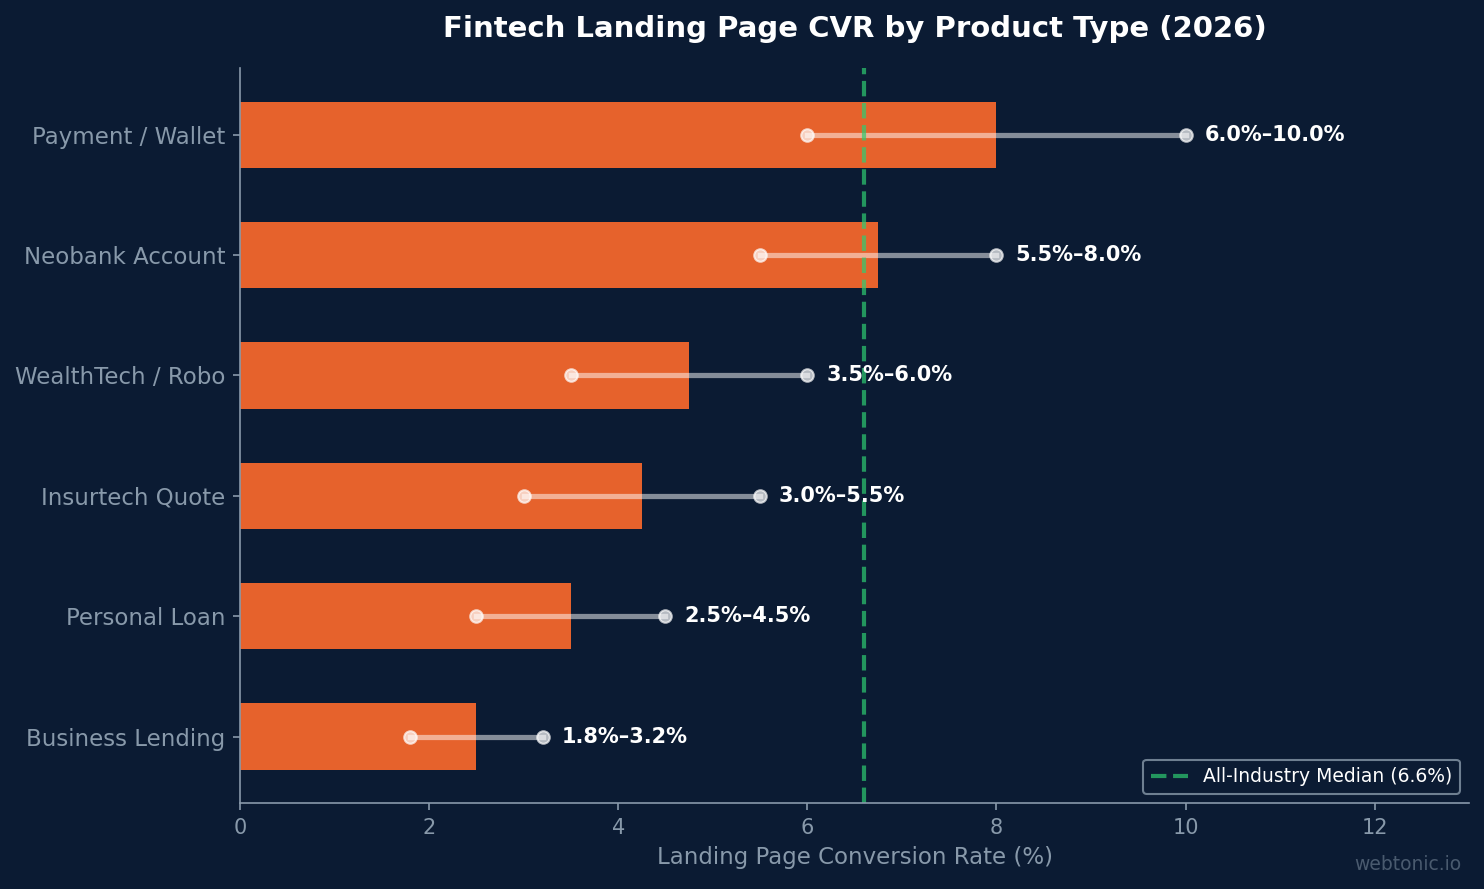
Payment and wallet apps achieve the highest conversion rates (6.0–10.0%) because the initial action — downloading an app or creating a basic account — requires minimal personal information. Lending products sit at the bottom because credit applications trigger anxiety about credit score impact and personal data exposure.
Form Fields and Conversion Impact
Form length is the most direct lever fintech teams can pull. DigitalApplied's analysis of Unbounce's 2026 Benchmark Report based on 1.4 million form submissions shows a clear inverse relationship:
- Single-field forms (email only): 13.4% conversion rate
- Three-field forms: 10.1% conversion rate
- Five-field forms: 7.8% conversion rate
- Seven-field forms: 5.3% conversion rate
- Ten-plus field forms: 3.6% conversion rate
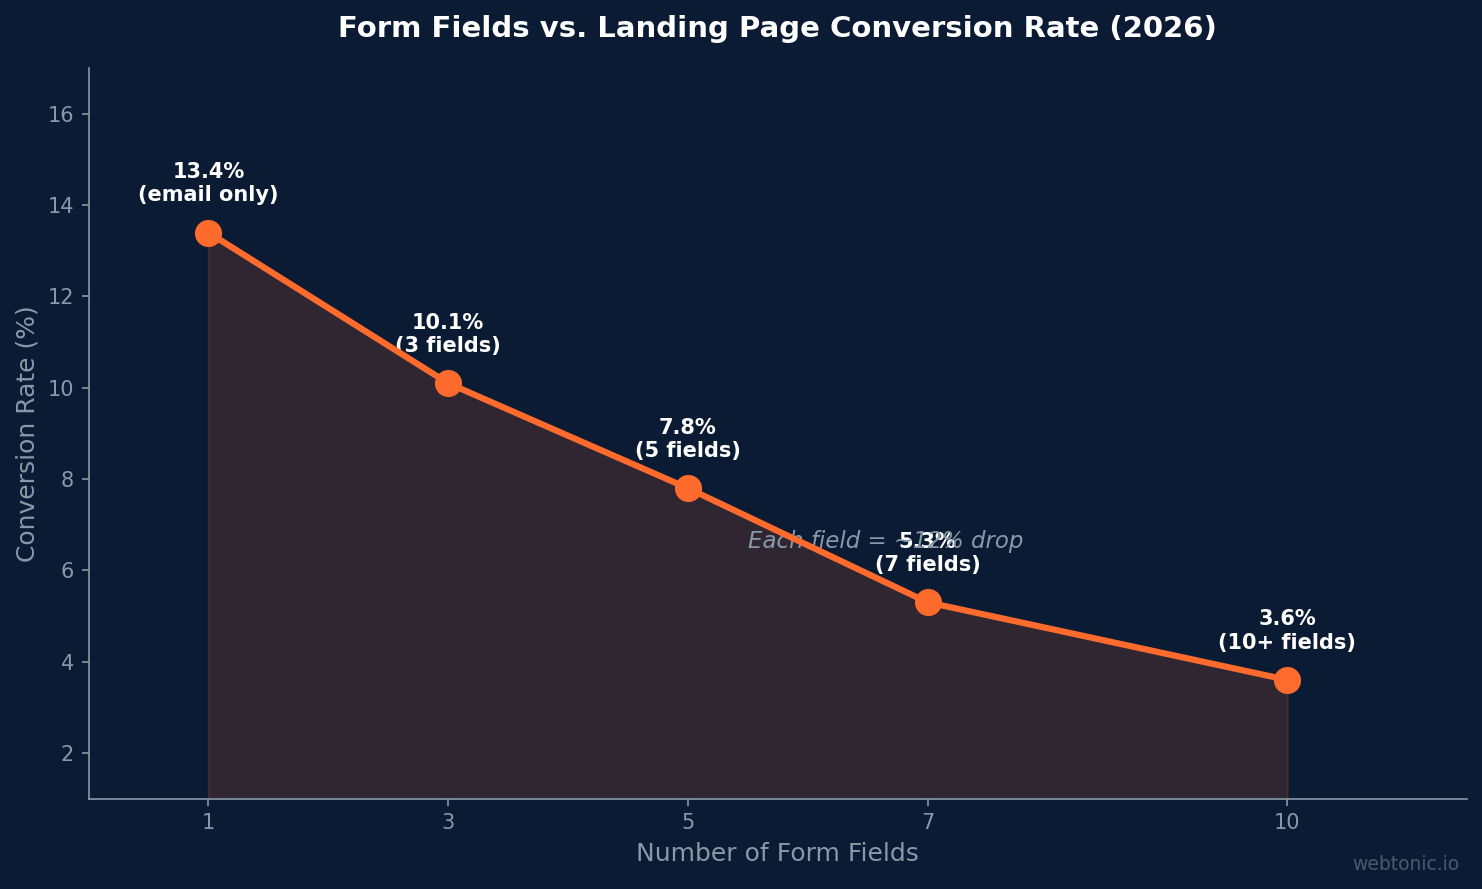
Each additional form field reduces conversions by approximately 11–15%. For fintech brands, this creates a tension between regulatory requirements (KYC mandates collecting name, date of birth, address, and government ID) and conversion optimization. The solution is progressive disclosure — capturing only an email on the landing page, then requesting additional information across a multi-step onboarding flow. WSA Design's CRO framework defines conversion goals by product category:
- Payments: First successful payment or wallet top-up
- Neobanking: Verified account + first deposit + card activation
- Lending: Completed application + approval + first disbursement
Mobile vs. Desktop Performance Gap
The 16-percentage-point bounce rate gap between mobile (54%) and desktop (38%) represents one of the biggest optimization opportunities in fintech CRO. CuFinder reports that 68% of fintech web traffic comes from mobile devices, yet mobile conversion rates trail desktop by 30–40% across the industry.
Key mobile optimization factors for fintech landing pages include:
- Page load speed: Each additional second of load time increases bounce rate by 12–15%. Fintech pages with LCP under 2.5 seconds convert 2.3x better than those above 4 seconds.
- App store handoff: For mobile-first products, the landing page should facilitate a seamless transition to the App Store or Google Play with deep linking and deferred attribution.
- Thumb-friendly form design: Input fields, buttons, and navigation must accommodate one-handed mobile use. Apexure notes that financial services landing pages average 8.4% conversion when fully optimized for mobile input.
- Trust signal placement: Security badges, regulation logos, and encryption indicators need prominent above-the-fold placement on mobile screens where real estate is limited.
Case Studies: What Works in Fintech CRO
Real-world examples demonstrate the impact of landing page optimization in fintech:
Monzo's AI-assisted redesign produced a 9.7% conversion uplift over the legacy version. According to HotMinute, the gain came primarily from improved content hierarchy and user flow optimization rather than visual redesign — confirming that information architecture matters more than aesthetics for financial products.
Lulo Bank achieved a 15% reduction in onboarding drop-off by implementing data-driven personalization. The Rokt case study also revealed that 18% of app installers were not creating savings accounts — a discovery that led to targeted in-app messaging and a streamlined landing page-to-account flow.
SingleGrain's AI-first CRO framework for fintech identifies three critical metrics for regulated onboarding: time-to-decision (application to approval), manual review rate (share of applications requiring human review), and CAC payback period. Fintech brands optimizing all three see 20–35% improvements in end-to-end conversion from landing page to active account.
Landing Page Conversion by Industry Comparison
Where fintech sits relative to other industries reveals both the challenge and the opportunity. Our growth marketing team works with clients across these verticals:
| Industry | Median CVR | Top 10% CVR | Source |
|---|---|---|---|
| Events & Entertainment | 12.3% | 30%+ | Unbounce |
| Home Services | 8.5% | 22% | COREPPC |
| Financial Services | 8.4% | 26.1% | Unbounce |
| SaaS Free Trial | 7.2% | 20% | COREPPC |
| Fintech (Specific) | 4.6% | 18%+ | CuFinder |
| E-commerce | 3.1% | 11% | COREPPC |
| All Industries | 6.6% | 11.45%+ | Unbounce |
The distinction between "Financial Services" (8.4% median) and "Fintech" (4.6%) is important. Broad financial services includes mortgage calculators, insurance quote forms, and retirement planners — products with established consumer trust. Fintech products like neobank signups, crypto wallets, and BNPL applications carry a higher trust barrier, which depresses the conversion rate despite strong ad relevance.
A/B Testing and Optimization Velocity
The 5.7x gap between average (4.6%) and top-performing (26.1%) fintech landing pages closes through systematic testing. According to Dupple's 2026 conversion analysis, the median landing page conversion rate sits at 2.35% across all industries, with the top quartile reaching 5.31% — meaning fintech's 4.6% already beats the all-industry median.
High-performing fintech CRO teams run 4–8 tests per month per landing page variant. The highest-impact test categories, ranked by average conversion lift, include:
- CTA copy and placement: 15–25% average lift — "Open your account in 2 minutes" outperforms generic "Sign up" by 2–3x in fintech contexts.
- Social proof positioning: 10–18% average lift — User count badges ("Join 2M+ customers") placed near the CTA consistently outperform testimonial carousels.
- Form reduction: 8–15% lift per field removed — Progressive disclosure recovers the conversion lost to mandatory regulatory fields.
- Hero section messaging: 5–12% average lift — Leading with the primary benefit ("No fees, ever") outperforms feature-led messaging ("AI-powered banking").
- Page speed improvements: 3–8% lift per second saved — Below 2.5s LCP is the minimum threshold for competitive conversion rates.
Our data intelligence approach helps fintech brands build the measurement infrastructure needed to run statistically valid landing page tests at scale, ensuring results are attributable and repeatable. The most successful fintech CRO programs test continuously — brands running 8+ tests per month close the gap between the 4.6% average and the 26.1% top-performer ceiling within 6–12 months.
Best Practices for Fintech Landing Page Optimization
For more on how our performance creative approach drives results, these fintech-specific best practices combine CRO research with regulatory compliance:
- Use progressive disclosure for KYC fields — Capture email-only on the landing page (13.4% CVR), then collect regulatory requirements across a 3–5 step onboarding flow.
- Prioritize mobile-first design — With 68% of traffic on mobile and a 54% bounce rate, mobile optimization is the highest-impact lever.
- Display trust signals above the fold — Regulation badges, encryption indicators, FDIC/FSCS coverage, and security certifications reduce the trust gap unique to financial products.
- Optimize page load to under 2.5 seconds — LCP directly impacts both conversion rate and bounce rate, with a 2.3x performance gap between fast and slow pages.
- Test AI-assisted content optimization — Monzo's 9.7% uplift demonstrates that AI-driven content hierarchy outperforms manual redesigns for financial landing pages.
- Track end-to-end funnel metrics — The 4.6% LP conversion rate only measures the first step. Track through KYC completion (60–75%), account funding (40–55%), and activation (70–85%).
- Separate landing pages by traffic source — Paid search visitors have different intent than social media traffic. Tailor messaging, form length, and trust signals for each channel.
Related reading
- Fertility & IVF Landing Page Statistics
- Financial Advisory Landing Page Statistics: 2026 Conversion Rate Benchmarks
- Fitness Landing Page Statistics: 2026 Conversion Benchmarks, A/B Testing Data & CRO Insights
- Landing Page Design services at Web Tonic
FAQ
What is a good conversion rate for a fintech landing page?
A good fintech landing page conversion rate is above 4.6% (the industry average). Top performers reach 18–26.1%, while the broader financial services median is 8.4%. If you are below 4.6%, focus on reducing form fields, improving mobile experience, and adding trust signals. Above 8% puts you in the top quartile for fintech.
Why do fintech landing pages have lower conversion rates than other industries?
Fintech landing pages face three unique headwinds: regulatory friction (KYC requirements add form fields), trust barriers (users hesitate to share financial data with newer brands), and complex products (financial products require more education before commitment). These factors create a structural conversion penalty compared to simpler verticals like events or home services.
How many form fields should a fintech landing page have?
One to three fields maximum on the initial landing page. Single-field (email only) forms convert at 13.4%, dropping to 7.8% at five fields and 3.6% at ten-plus fields. Use progressive disclosure to collect additional required information (name, DOB, address, ID) across subsequent onboarding steps rather than on the landing page itself.
What is the average bounce rate for fintech websites?
The average fintech bounce rate is 48.5%, with mobile at 54% and desktop at 38%. The 16-percentage-point device gap indicates significant mobile optimization opportunities. Elite performers achieve bounce rates below 25% through fast load times, mobile-first design, and immediately visible value propositions.
Does landing page design or content matter more for fintech conversions?
Content and information architecture matter more. Monzo's 9.7% conversion uplift came from content hierarchy changes, not visual redesign. For fintech, the key content elements are: clear product value proposition within 3 seconds, visible trust signals (regulation, security), social proof (user counts, reviews), and a single focused CTA. Design supports these content priorities rather than driving conversions independently.
Sources
https://cufinder.io/blog/benchmarks/fintech/
https://foundrycro.com/blog/landing-page-conversion-rate-benchmarks-2026/
https://foundrycro.com/blog/fintech-marketing-benchmarks-by-product-type/
https://www.digitalapplied.com/blog/landing-page-statistics-2026-conversion-data-points
https://www.benchmarketing.org/benchmarks/landing-pages
https://www.apexure.com/blog/landing-page-conversion-rate-benchmarks-by-industry
https://gitnux.org/landing-page-conversion-rate-statistics/
https://wsa.design/news/fintech-conversion-optimization-cro-framework-for-financial-brands
https://hotminute.co.uk/2026/06/02/monzo-let-ai-vibecode-its-new-website-but-wont-let-it-near-its-bank/
https://www.rokt.com/case-studies/lulo-bank-improves-customer-onboarding-with-actionable-insights-from-rokt-mparticle
https://www.singlegrain.com/cro/ai-first-cro-for-fintech-reducing-drop-off-in-regulated-onboarding-flows/


